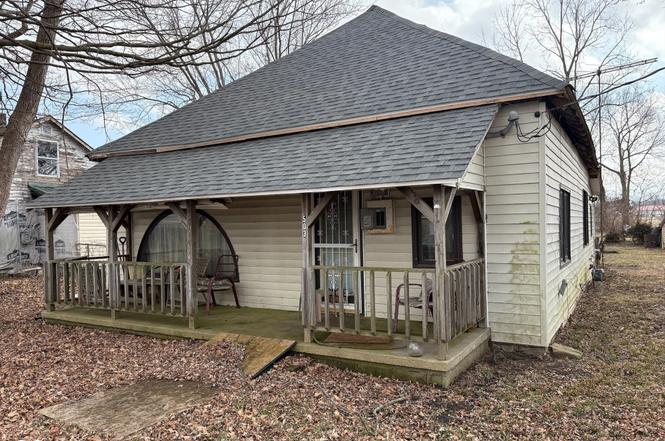
503 Oregon St · Trafalgar, IN
Flood risk 1/10 · Minimal
- FEMA flood zone
- X (unshaded)
- Chance of flooding over 30 yrs
- 0.0%
- Est. flood insurance / yr
- $507 – $1,088
Fire risk 1/10 · Minimal
- Est. fire insurance / yr
- $717 – $1,331
Heat risk 3/10 · Minor
- Hot days now (above 101°F)
- 7 days/yr
- Hot days in 30 yrs
- 19 days/yr
Wind risk 2/10 · Minimal
- Chance of severe wind over 30 yrs
- 1.0%
Air-quality risk 2/10 · Minimal
- Unhealthy air days now
- 1 days/yr
- Unhealthy air days in 30 yrs
- 2 days/yr
Risk factors via First Street. Map © Google.
Why this score? — see what drove the B- grade
The composite is a weighted blend of 9 inputs, each scored 0–100. Each bar is that input's sub-score; the figure is the points it added to the 100-point composite (weight × sub-score).
- Cash flow +30.0/30.0
- 1% rule +10.0/10.0
- DSCR +10.0/10.0
- ARV discount +7.5/15.0
- Schools +3.9/10.0
- Livability +3.6/5.0
- Rent growth +2.5/5.0
- Condition / age +2.5/5.0
- Appreciation +0.0/10.0
$85,000
🖨 Deal sheet 📄 Offer letter ✓ Due diligence
Listing remarks
Wonderful opportunity to revive this 2 bedroom, 1 bath bungalow in Trafalgar. Covered front porch sits off the quiet street. Large yard has potential for garage, but currently has a shed. Large rooms with 9' ceilings. Kitchen has slightly vaulted ceiling. Bonus room in back could be an office or sunroom. Lots of $200k+ renovated homes in the neighborhood.
Key facts
- Covered front porch
- Quiet street
- Large yard
Tags
Property features AI
Finance
- Other: Lot size approximately 0.17 acres; Building/living area reported as 1,176 (main level total)
Exterior
- Utilities: Public water; Municipal sewer connected; No solid waste service listed
- Home design: Single-family residence; One story; Property condition listed as fixer
- Construction: Wood and vinyl siding; Crawl space foundation
- Exterior features: Covered porch; Deck; No fence
Interior
- Kitchen: Kitchen on the main level
- Bedrooms: Two bedrooms on the main level
- Bathrooms: One full bathroom (main level)
- Heating & cooling: Forced air heating; No central cooling listed
- Interior features: Six main-level rooms including a living room and bonus room; Appliances: None listed
- Laundry & utility: Main-level laundry room
Neighborhood map
What this means for you Summary
Snapshot
- This is a 2-bed/1.0-bath single-family listed at $85k.
Deal economics
- At list price, monthly cash flow is $434 ($5k/yr) — positive.
- The deal already cash-flows at list — no discount required.
- Meets the 1% rule at list price ($1k rent vs $85k).
- Recommended offer: $77k (9.0% below list) — sets the bar for market timing.
- Cap rate 12.4% vs local median 3.2% in Trafalgar — top-decile yield for the area; either an underpriced asset or a hidden risk that comps aren't pricing in. Stress-test before assuming the spread holds.
Location & tenants
- Location reads 71/100 on livability (#124 in IN) — a middle-class / working-renter tenant base. Strengths: crime A+, cost of living A+, housing A+; Watch: amenities F, commute F.
- Nineveh-Hensley-Jackson United (rural): math 41% / reading 48% proficiency, ranked #93 of 301 in IN (top 31%) — families likely to look elsewhere, expect single-tenant / working-renter base with shorter leases.
- Market conditions: 49 active listings in the ZIP; 1 comparable units currently listed for rent nearby; 1,133 units permitted in Johnson County in 2024 (0 in 5+ unit buildings).
Forward outlook
- Local home prices are declining (-3.0%/yr); year-one equity from $588 of loan paydown is wiped out by about $3k of value loss. Plan a longer hold.
- Johnson County population projected at +26% by 2050 — long-run rental-demand tailwind backs the buy-and-hold thesis.
- At projected returns (-3.0% appreciation + 3.0% rent growth), your $24k cash investment doubles in ~6 years — after that, you're playing with house money.
Negotiation context
- It's been on market 118 days — a 9% lower offer ($77k) is reasonable based on typical stale-listing flexibility.
Risks & watch-outs
- Watch-outs: built in 1930 — expect roof / HVAC / electrical / plumbing capex.
Questions for the listing agent
- It's been on market 118 days. Have you received any prior offers? Is the seller open to a 9% concession, seller financing, or rate buy-down credit?
- Built in 1930 — when were the roof, HVAC, electrical panel, plumbing, and water heater last replaced?
- Why hasn't it sold? Are there any deal-killer items the seller is aware of (foundation, flood, title, zoning, code violations)?
- Is there a deadline driving the sale (1031 exchange, divorce, estate, relocation)? That informs how much negotiation room exists.
- Schools are B-rated — typically a magnet for longer-tenancy family renters. What's the average tenant stay here, and is there a school-zone premium baked into asking?
- What's the average days-on-market for RENTAL listings here right now (not sales)? A rising rental-DOM trend means longer vacancies and softer asking-rent achievability than the comps imply.
- What's the recent tenant-quality profile in this submarket — average credit score on applications, eviction rate, late-payment / NSF rate, and stable-employment percentage? A property-management company in the area should have these aggregated.
- How much new for-sale + rental construction is in the pipeline within 1–3 miles? Heavy new supply typically softens prices + rents 12–24 months out; constrained supply supports both.
Investment metrics
- 1% rule
- 1.50% ✓
- Cap rate
- 12.42%
- Cash-on-cash
- 21.89%
- DSCR
- 1.97
- GRM
- 5.6
CMA / ARV
- ARV (on-the-fly)
- $241,080
- Comps found
- 7
Show comp detail 7 sales within ~0.75 mi
| Address | Dist | Beds/Ba | Sqft | Sold | Price | $/sf | Match |
|---|---|---|---|---|---|---|---|
| 289 W Raymond Ave | 0.29mi | 3/2.0 (+1) | 1,107 (-6%) | 8mo | $226,500 | $205 | 61 |
| 303 W Ohio St | 0.10mi | 3/1.0 (+1) | 1,260 (+7%) | 22mo | $190,000 | $151 | 61 |
| 5 Watson Dr | 0.29mi | 3/2.0 (+1) | 1,244 (+6%) | 10mo | $255,000 | $205 | 60 |
| 632 Derek Ln | 0.22mi | 3/2.0 (+1) | 1,251 (+6%) | 13mo | $264,995 | $212 | 59 |
| 305 W Pearl St | 0.08mi | 2/1.5 | 1,026 (-13%) | 21mo | $200,000 | $195 | 56 |
| 373 Geralyn Dr | 0.49mi | 3/2.0 (+1) | 1,228 (+4%) | 8mo | $269,995 | $220 | 54 |
| 34 Clear Spring Ln | 0.45mi | 3/2.0 (+1) | 1,289 (+10%) | 2mo | $271,000 | $210 | 52 |
Match score weights: distance 35% · size 25% · config 20% · recency 20%. Top-matched comps best support the ARV.
Projected returns pro-forma
-3.0% appreciation · 3.0% rent growth · sell at horizon
- IRR
- 14.6%
- Equity multiple
- 1.58×
- Total profit
- $13,892
- Equity at exit
- $12,674
- IRR
- 23.3%
- Equity multiple
- 3.01×
- Total profit
- $47,750
- Equity at exit
- $7,349
Cash invested: $23,800 (down + closing). Projections, not guarantees.
Landlord ↔ Tenant lean methodology
- Overall (STATE)
- 90 Strongly Landlord-Friendly
- State Indiana
- 90 Strongly Landlord-Friendly · R+11
- County
- — inherits STATE
- City
- — inherits STATE
ZIP-level market 46181
- Home prices YoY
- -11.8%
- Active inventory
- 49
- Price-to-rent
- 5.6×
Monthly cashflow live
- Estimated rent
- $1,275 medium interval (Pro) →
- Mortgage (P&I)
- −$446
- Tax from tax record
- −$92 /mo · $1,102/yr
- Insurance
- −$35
- HOA
- −$0
- Vacancy / Maint / Mgmt
- −$268
- Net cashflow
- $434
Break-even live
UW: 25.0% down · 7.5% · 30yr · 1.5% tax · 5.0% vac · 8.0% maint · 8.0% mgmt
Financing live
Cash to close
- Down payment
- $21,250
- Closing costs
- $2,550
- Reserves months
- —
- Total cash needed
- —
Loan-product check · same deal, 3 products live
Conventional
25% down · 7.5% · 30yr
- Down + closing
- —
- Monthly P&I
- —
- Monthly cashflow
- —
- DSCR
- —
- Eligible?
- —
Personal DTI + credit; lowest rate.
DSCR
20% down · 8.5% · 30yr
- Down + closing
- —
- Monthly P&I
- —
- Monthly cashflow
- —
- DSCR
- —
- Eligible?
- —
No personal income docs; deal must DSCR.
Hard money
10% down · 12.0% · 12mo
- Down + closing
- —
- Monthly P&I
- —
- Monthly cashflow
- —
- DSCR
- —
- Eligible?
- —
Short-term bridge; refi at stabilization.
Rent comps 1 comps
| Address | Beds | Baths | Sqft | Rent | $/sqft | DOM | Units | Dist |
|---|---|---|---|---|---|---|---|---|
| 711 W Trafalgar Pointe Way Trafalgar, IN | 1.0–3.0 | 1.0–2.0 | 949 | $1,275 | $1.34 | 1d | 3 | 0.19mi |
Listing history 14 events
-
2026-06-18days on market $85,000 Active 118 DOM
-
2026-06-17days on market $85,000 Active 117 DOM
-
2026-06-16days on market $85,000 Active 116 DOM
-
2026-06-15days on market $85,000 Active 115 DOM
-
2026-06-13days on market $85,000 Active 113 DOM
-
2026-06-09days on market $85,000 Active 109 DOM
-
2026-06-08days on market $85,000 Active 108 DOM
-
2026-06-07days on market $85,000 Active 107 DOM
-
2026-06-03days on market $85,000 Active 103 DOM
-
2026-06-02days on market $85,000 Active 102 DOM
-
2026-06-01days on market $85,000 Active 101 DOM
-
2026-05-31days on market $85,000 Active 100 DOM
-
2026-03-25price $85,000
-
2026-02-20$90,000 Active
ⓘ Source: listings_history table (triggers on properties + properties_extension) + one-shot
backfill from property_details.listing_events for pre-trigger history.
Tax reassessment forecast IN · Partial reset (capped growth)
- Current annual tax
- $1,102 · $92/mo
- Projected year-2 tax
- $1,102 · $92/mo
- Expected delta
- $0/yr ($0/mo · 0.0%)
ⓘ Screening estimate from a state-policy table — verify with the county assessor before closing.
Climate risk First Street
- Flood 1/10 Low FEMA zone X (unshaded) · 0% chance over 30 yrs
- Wildfire 1/10 Low
- Heat 3/10 Moderate 7 d/yr ≥101°F today · 19 d/yr by 30 yrs out
- Wind 2/10 Low 100% chance of damaging wind over 30 yrs
- Air quality 2/10 Low 1 unhealthy d/yr today · 2 by 30 yrs out
Nearby sold comps map
Loading sold comps map…
Walkable amenities ~0.75 mi
Loading nearby amenities…
Taxation est. · year 1
- Rental income
- $15,300
- − Mortgage interest
- −$4,761
- − Property taxes
- −$1,102
- − Insurance
- −$425
- − Repairs & maintenance
- −$1,224
- − Management
- −$1,224
- − Depreciation
- −$2,473
- Taxable income
- $4,091
- Est. tax owed @ 24.0%
- −$982
- After-tax cash flow
- $4,229/yr
For passive investors: Depreciation is non-cash, so a rental often shows a tax loss while cash-flowing — sheltering income. Rental losses are passive: they offset passive income freely, and up to $25,000/yr can offset ordinary (W-2) income if you actively participate and your MAGI is under $100k (phasing out to $0 by $150k); unused losses carry forward. On sale, claimed depreciation is recaptured at up to 25%, and gains may owe capital-gains tax (a 1031 exchange can defer both). Figures are a year-1 estimate at your 24.0% rate — not tax advice; consult a CPA.
Schools (NCES district)
- District
- Nineveh-Hensley-Jackson United
- NCES district ID
- 1807620
- Math proficiency
- 41% ▼ -12.00%
- Reading proficiency
- 48% ▼ -10.00%
- Median HH income
- $59,040
- Composite
- 39.07/100
- National rank
- #4053
- State rank
- #93 of 301 in IN
Livability — Trafalgar
- Score
- 71/100
- State rank
- #124
- US rank
- #6528
Category grades
Schools grade is shown separately in the Schools card above.
Census & demographics
- Census place
- Trafalgar, IN
- Population (ZIP)
- 5,094
Population outlook (Johnson County) Hauer SSP2
- Today (2025)
- 170,080 people
- By 2030
- 179,983 · +5.8%
- By 2040
- 198,580 · +16.8%
- By 2050
- 214,661 · +26.2%
- By 2075
- 247,990 · +45.8%
- By 2100
- 257,821 · +51.6%
Race, ethnicity, and origin ACS 2023
- Neighborhood character
- Predominantly White (98%)
- Race & ethnicity
- White 98% Two or more races 1%
- Common ancestry
- Italian 3% Slovak 2% Serbian 1%
- Foreign-born
- 1% · Canada
Political lean MEDSL · Johnson
- 2024 margin
- Solid R (+34.3) · D 32.0% · R 66.3% · Other 1.7%
- 2008→2024 swing
- -8.9pp toward R · 2008: -25.5pp · 2024: -34.3pp
- All cycles
- 2024: R+34.3 2020: R+34.1 2016: R+42.5 2012: R+38.5 2008: R+25.5
Not yet ingested
- Civics
- —
Market trends
- HPI YoY
- ▼ -28.99%
- Current HPI
- 216.5526
- Rent YoY
- —
- Metro
- —
- State GDP YoY
- ▲ 2.90%
- F500 in state
- 18
Industry mix (Fortune 500 HQ in IN)
| Industry | F500 HQs | Revenue |
|---|---|---|
| Industrial Machinery | 2 | $37B |
|
||
| Healthcare | 1 | $177B |
|
||
| Pharmaceuticals | 1 | $45B |
|
||
| Metals / Steel | 1 | $18B |
|
||
| Agriculture | 1 | $17B |
|
||
| Packaging | 1 | $12B |
|
||
Price history
-5.6% since first listed2 events — show timeline
- 2026-03-25 Price Changed $85,000 MIBOR as Distributed by MLS Grid
- 2026-02-20 Listed $90,000 MIBOR as Distributed by MLS Grid
Property tax history
+1.4%/yrLatest (2024): $1,102 · +323.3% YoY. Source: county tax records.
Cash-flow waterfall
monthlySold comps — $/sqft
last 12 mo · ≤1 miLoading sold comps…