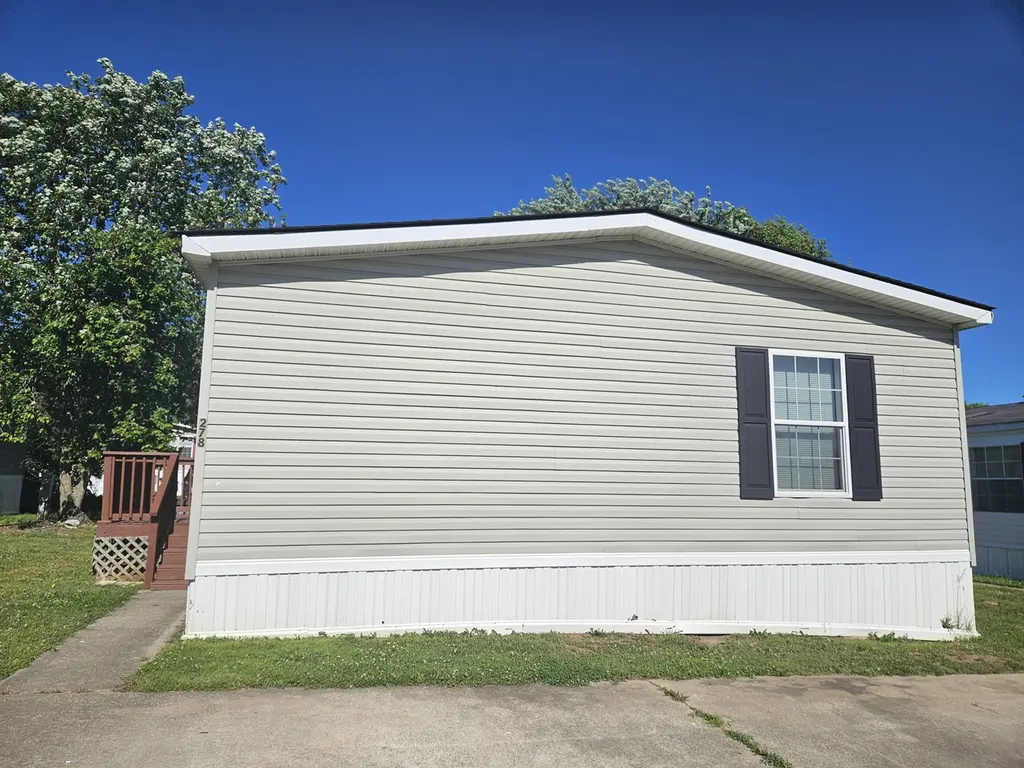
278 Kettering Ct · Clarksville, TN
Flood risk 1/10 · Minimal
- FEMA flood zone
- X (unshaded)
- Chance of flooding over 30 yrs
- 0.0%
- Est. flood insurance / yr
- $507 – $1,088
Fire risk 2/10 · Minimal
- Est. fire insurance / yr
- $949 – $1,763
Heat risk 6/10 · Moderate
- Hot days now (above 107°F)
- 7 days/yr
- Hot days in 30 yrs
- 21 days/yr
Wind risk 4/10 · Minor
- Chance of severe wind over 30 yrs
- 10.0%
Air-quality risk 1/10 · Minimal
- Unhealthy air days now
- 0 days/yr
- Unhealthy air days in 30 yrs
- 0 days/yr
Risk factors via First Street. Map © Google.
Why this score? — see what drove the B grade
The composite is a weighted blend of 9 inputs, each scored 0–100. Each bar is that input's sub-score; the figure is the points it added to the 100-point composite (weight × sub-score).
- Cash flow +30.0/30.0
- 1% rule +10.0/10.0
- DSCR +10.0/10.0
- ARV discount +7.5/15.0
- Livability +4.2/5.0
- Condition / age +4.0/5.0
- Rent growth +2.8/5.0
- Schools +2.5/10.0
- Appreciation +0.0/10.0
$51,900
🖨 Deal sheet (PDF) 📄 Offer letter ✓ Due diligence
Listing remarks
Time to relax in your new home!! This is a great 3 bedroom, 2 bath home with AMAZING storage areas and open floor plan! The kitchen has all appliances included as well as the washer and dryer. The kitchen also has a large walk-in pantry and a separate laundry area. All bedrooms are large enough to fit a queen sized bed and have walk-in closets. The Primary bath has a walk-in shower and a linen closet. You will completely enjoy your new home! Come in or schedule your tour today Don't miss out on this great opportunity to make this home yours!
Key facts
- Open floor plan
- Linen closet
- Walk-in closets
Tags
Property features AI
Finance
- Financial info: List price $51,900
Exterior
- Home design: Single-section, 3 bed 2 bath plan; Spec new construction
- Exterior features: Living area approximately 1,456
Interior
- Bedrooms: 3 bedrooms
- Bathrooms: 2 full bathrooms
- Interior features: Dishwasher; Disposal; Refrigerator
Neighborhood map
What this means for you Summary
Snapshot
- This is a 3-bed/2.0-bath manufactured listed at $52k. Condition is rated good.
Deal economics
- At list price, monthly cash flow is $836 ($10k/yr) — positive.
- The deal already cash-flows at list — no discount required.
- Meets the 1% rule at list price ($2k rent vs $52k).
- Recommended offer: $51k (1.5% below list) — sets the bar for market timing.
- Cap rate 25.6% vs local median 3.5% in Clarksville — top-decile yield for the area; either an underpriced asset or a hidden risk that comps aren't pricing in. Stress-test before assuming the spread holds.
Location & tenants
- Location reads 84/100 on livability (#1 in TN, #798 nationally) — a professional / high-income tenant draw. Strengths: amenities A+, commute A+, cost of living A+; Watch: employment C-, crime D+.
- Montgomery County (urban): math 25% / reading 31% proficiency, ranked #65 of 139 in TN (top 47%) — low school quality limits family demand, transient renter base, plan for 1-2y turnover.
- Zoned schools: Rossview Elementary (math 66% / reading 58%, grade B, #49 of 952 statewide, top 6%, 1,261 students, 0% FRL); Rossview Middle (math 31% / reading 32%, grade F, #89 of 333 statewide, top 28%, 1,022 students, 0% FRL); Rossview High (math 10% / reading 51%, grade F, #75 of 332 statewide, top 24%, 2,030 students, 0% FRL) — zoned schools average 0% FRL vs 40% district-wide (40 pts lower); this property's tenant base skews higher-income than the district average.
- Zoned-school proficiency averages 41% at this address vs 28% district-wide (+13 pts) — the actual schools serving this property are materially stronger than the Montgomery County average implies; a family-tenant draw the district grade alone would hide.
- Market conditions: Rents rising (+1.3%/yr); 608 active listings in the ZIP; 31 comparable units currently listed for rent nearby; rentals at typical pace (median 23d on market — plan ~3-4 weeks tenant-placement turnaround); 2,583 units permitted in Montgomery County in 2024 (617 in 5+ unit buildings).
Forward outlook
- Local home prices are declining (-3.0%/yr); year-one equity from $359 of loan paydown is wiped out by about $2k of value loss. Plan a longer hold.
- Montgomery County population projected at +49% by 2050 — long-run rental-demand tailwind backs the buy-and-hold thesis.
- At projected returns (-3.0% appreciation + 1.3% rent growth), your $15k cash investment doubles in ~2 years — after that, you're playing with house money.
Negotiation context
- It's been on market 17 days — a 2% lower offer ($51k) is reasonable based on typical stale-listing flexibility.
Risks & watch-outs
- Climate carrying-cost: extreme-heat days projected 7→21/yr by 2055 (HVAC capex compounding) — expect insurance premiums to compound above CPI over the hold.
Questions for the listing agent
- Is there a deadline driving the sale (1031 exchange, divorce, estate, relocation)? That informs how much negotiation room exists.
- Crime grade is D in this area — have there been break-ins, vandalism, or insurance claims at this property in the last 3 years? What carrier currently insures it and at what premium?
- What's the average days-on-market for RENTAL listings here right now (not sales)? A rising rental-DOM trend means longer vacancies and softer asking-rent achievability than the comps imply.
- What's the recent tenant-quality profile in this submarket — average credit score on applications, eviction rate, late-payment / NSF rate, and stable-employment percentage? A property-management company in the area should have these aggregated.
- How much new for-sale + rental construction is in the pipeline within 1–3 miles? Heavy new supply typically softens prices + rents 12–24 months out; constrained supply supports both.
Investment metrics
- 1% rule
- 2.91% ✓
- Cap rate
- 25.63%
- Cash-on-cash
- 69.06%
- DSCR
- 4.07
- GRM
- 2.9
CMA / ARV
No comps found within radius.
Projected returns pro-forma
-3.0% appreciation · 1.32% rent growth · sell at horizon
- IRR
- 66.6%
- Equity multiple
- 3.92×
- Total profit
- $42,364
- Equity at exit
- $7,738
- IRR
- 70.3%
- Equity multiple
- 7.58×
- Total profit
- $95,595
- Equity at exit
- $4,487
Cash invested: $14,532 (down + closing). Projections, not guarantees.
Landlord ↔ Tenant lean methodology
- Overall (STATE)
- 87 Strongly Landlord-Friendly
- State Tennessee
- 87 Strongly Landlord-Friendly · R+13
- County
- — inherits STATE
- City
- — inherits STATE
ZIP-level market 37040
- Home prices YoY
- -22.0%
- Rents YoY
- 1.3%
- Active inventory
- 608
- Price-to-rent
- 2.9×
Monthly cashflow live
- Estimated rent
- $1,513 high interval (Pro) →
- Mortgage (P&I)
- −$272
- Tax est. 1.5%
- −$65 /mo · $778/yr
- Insurance
- −$22
- HOA
- −$0
- Vacancy / Maint / Mgmt
- −$318
- Net cashflow
- $836
Break-even live
Sensitivity live
| Price | -10% $872 | -5% $854 | +0% $836 | +5% $818 | +10% $800 |
|---|---|---|---|---|---|
| Rent | -10% $717 | -5% $777 | +0% $836 | +5% $896 | +10% $956 |
| Rate | -1.0pp $862 | -0.5pp $850 | base $836 | +0.5pp $823 | +1.0pp $809 |
UW: 25.0% down · 7.5% · 30yr · 1.5% tax · 5.0% vac · 8.0% maint · 8.0% mgmt
Financing live
Cash to close
- Down payment
- $12,975
- Closing costs
- $1,557
- Reserves months
- —
- Total cash needed
- —
Loan-product check · same deal, 3 products live
Conventional
25% down · 7.5% · 30yr
- Down + closing
- —
- Monthly P&I
- —
- Monthly cashflow
- —
- DSCR
- —
- Eligible?
- —
Personal DTI + credit; lowest rate.
DSCR
20% down · 8.5% · 30yr
- Down + closing
- —
- Monthly P&I
- —
- Monthly cashflow
- —
- DSCR
- —
- Eligible?
- —
No personal income docs; deal must DSCR.
Hard money
10% down · 12.0% · 12mo
- Down + closing
- —
- Monthly P&I
- —
- Monthly cashflow
- —
- DSCR
- —
- Eligible?
- —
Short-term bridge; refi at stabilization.
Rent comps 31 comps
| Address | Beds | Baths | Sqft | Rent | $/sqft | DOM | Units | Dist |
|---|---|---|---|---|---|---|---|---|
| 278 Kettering Ct Unit 189 Clarksville, TN | 3.0 | 2.0 | 1456 | $1,369 | $0.94 | 15d | 1 | 0.01mi |
| 179 Lynnwood Cir Unit 103 Clarksville, TN | 3.0 | 2.0 | 1456 | $1,369 | $0.94 | 22d | 1 | 0.07mi |
| 118 Alexander Blvd Clarksville, TN | 2.0 | 2.5 | 1252 | $2,275 | $1.82 | 22d | 1 | 0.16mi |
| 172 Alexander Blvd Clarksville, TN | 2.0 | 2.5 | 1216 | $1,350 | $1.11 | 22d | 1 | 0.17mi |
| 955 Professional Park Dr Unit 102 Clarksville, TN | 2.0 | 2.5 | 1200 | $1,400 | $1.17 | 22d | 1 | 0.17mi |
| 106 Alexander Blvd Unit 1 Clarksville, TN | 2.0 | 2.5 | 1215 | $1,150 | $0.95 | 22d | 1 | 0.18mi |
| 311 Sam Houston Cir Clarksville, TN | 2.0 | 2.5 | 1216 | $1,200 | $0.99 | 22d | 1 | 0.19mi |
| 64 Lynnwood Cir Unit 28 Clarksville, TN | 3.0 | 2.0 | 1456 | $1,519 | $1.04 | 22d | 1 | 0.20mi |
| 337 Sam Houston Cir Clarksville, TN | 2.0 | 2.5 | 1216 | $1,350 | $1.11 | 22d | 1 | 0.24mi |
| 332 Sam Houston Cir Clarksville, TN | 2.0 | 2.5 | 1216 | $1,350 | $1.11 | 22d | 1 | 0.24mi |
| 43 Ellington Ter Clarksville, TN | 2.0 | 2.5 | 1216 | $1,295 | $1.06 | 22d | 1 | 0.24mi |
| 341 Sam Houston Cir Clarksville, TN | 2.0 | 2.5 | 1216 | $1,265 | $1.04 | 22d | 1 | 0.25mi |
| 94 Lynnwood Cir Unit 43 Clarksville, TN | 4.0 | 2.0 | 1568 | $1,439 | $0.92 | 22d | 1 | 0.33mi |
| 841 Professional Park Dr Clarksville, TN | 3.0 | 2.5 | 1330 | $1,595 | $1.20 | 22d | 1 | 0.38mi |
| 645 Stowe Ct Unit L Clarksville, TN | 2.0 | 2.5 | 1216 | $1,395 | $1.15 | 15d | 1 | 0.40mi |
| 820 Professional Park Dr Apt 3-A Clarksville, TN | 2.0 | 1.5 | 1100 | $1,140 | $1.04 | 22d | 1 | 0.45mi |
| 850 Professional Park Dr Unit A201 Clarksville, TN | 2.0 | 2.0 | 1176 | $1,485 | $1.26 | 15d | 1 | 0.46mi |
| 638 Stowe Ct Unit CC Clarksville, TN | 2.0 | 2.5 | 1225 | $1,375 | $1.12 | 15d | 1 | 0.47mi |
| 950 Big Sky Dr Clarksville, TN | 1.0–2.0 | 1.0–2.0 | 871 | $1,310 | $1.50 | 15d | 21 | 0.59mi |
| 851 Ted A Crozier Sr Blvd Clarksville, TN | 1.0–3.0 | 1.0–2.0 | 937 | $1,625 | $1.73 | 15d | 18 | 0.59mi |
| 632 White Face Dr Clarksville, TN | 3.0 | 2.0 | 1700 | $1,850 | $1.09 | 22d | 1 | 0.60mi |
| 632 White Face Dr Clarksville, TN | 3.0 | 2.0 | 1700 | $1,800 | $1.06 | 15d | 1 | 0.60mi |
| 2228 Killington Dr Clarksville, TN | 4.0 | 2.0 | 1729 | $1,900 | $1.10 | 22d | 1 | 0.64mi |
| 537 Bellamy Ln Clarksville, TN | 3.0 | 2.5 | 1401 | $1,800 | $1.28 | 22d | 1 | 0.76mi |
| 475 Bellamy Ln Unit 3001 Clarksville, TN | 2.0 | 2.0 | 1150 | $2,000 | $1.74 | 22d | 1 | 1.13mi |
| 1115 Thornberry Dr Clarksville, TN | 3.0 | 2.0 | 1716 | $1,995 | $1.16 | 15d | 1 | 1.25mi |
| 445 Warfield Blvd Clarksville, TN | 1.0–2.0 | 1.0–2.0 | 1051 | $1,450 | $1.38 | 15d | 1 | 1.31mi |
| 2157 Watertown Pl Clarksville, TN | 3.0 | 2.0 | 1275 | $1,550 | $1.22 | 15d | 1 | 1.44mi |
| 2157 Watertown Pl Clarksville, TN | 3.0 | 2.0 | 1275 | $1,550 | $1.22 | 22d | 1 | 1.44mi |
| 2315 Raleigh Ct Clarksville, TN | 2.0 | 1.5 | 1050 | $1,022 | $0.97 | 22d | 1 | 1.46mi |
| 284 Raleigh Dr Clarksville, TN | 2.0 | 1.5 | 1080 | $1,850 | $1.71 | 22d | 1 | 1.49mi |
Listing history 12 events
-
2026-06-21days on market $51,900 Active 17 DOM
-
2026-06-18days on market $51,900 Active 14 DOM
-
2026-06-17days on market $51,900 Active 13 DOM
-
2026-06-16days on market $51,900 Active 12 DOM
-
2026-06-15days on market $51,900 Active 11 DOM
-
2026-06-14days on market $51,900 Active 9 DOM
-
2026-06-13days on market $51,900 Active 8 DOM
-
2026-06-09days on market $51,900 Active 5 DOM
-
2026-06-08days on market $51,900 Active 4 DOM
-
2026-06-07days on market $51,900 Active 3 DOM
-
2026-06-05remarks 547-char remark
-
2026-06-05$51,900 Active 1 DOM
ⓘ Source: listings_history table (triggers on properties + properties_extension) + one-shot
backfill from property_details.listing_events for pre-trigger history.
Climate risk First Street
- Flood 1/10 Low FEMA zone X (unshaded) · 0% chance over 30 yrs
- Wildfire 2/10 Low
- Heat 6/10 Major 7 d/yr ≥107°F today · 21 d/yr by 30 yrs out
- Wind 4/10 Moderate 10% chance of damaging wind over 30 yrs
- Air quality 1/10 Low 0 unhealthy d/yr today · 0 by 30 yrs out
Nearby sold comps map
Loading sold comps map…
Walkable amenities ~0.75 mi
Loading nearby amenities…
Taxation est. · year 1
- Rental income
- $18,152
- − Mortgage interest
- −$2,907
- − Property taxes
- −$778
- − Insurance
- −$260
- − Repairs & maintenance
- −$1,452
- − Management
- −$1,452
- − Depreciation
- −$1,510
- Taxable income
- $9,793
- Est. tax owed @ 24.0%
- −$2,350
- After-tax cash flow
- $7,686/yr
For passive investors: Depreciation is non-cash, so a rental often shows a tax loss while cash-flowing — sheltering income. Rental losses are passive: they offset passive income freely, and up to $25,000/yr can offset ordinary (W-2) income if you actively participate and your MAGI is under $100k (phasing out to $0 by $150k); unused losses carry forward. On sale, claimed depreciation is recaptured at up to 25%, and gains may owe capital-gains tax (a 1031 exchange can defer both). Figures are a year-1 estimate at your 24.0% rate — not tax advice; consult a CPA.
Condition & rehab AI · 13 photos
This 3-bedroom, 2-bath manufactured home is in good condition with modern updates and a good curb appeal. It is ready for a new owner to move in and enjoy.
Value-add opportunities
- Both paint exterior — enhances curb appeal and value
- Both replace carpet — improves comfort and reduces maintenance
Renovation cost estimate screening
Value-add ROI direction
- Both paint exterior — enhances curb appeal and value ↑
- Both replace carpet — improves comfort and reduces maintenance ↑
ⓘ Cost ranges are severity-bucket heuristics (US national rule-of-thumb). Get contractor quotes + a written scope before underwriting a rehab budget.
Schools (NCES district)
- District
- Montgomery County
- NCES district ID
- 4703030
- Math proficiency
- 25% ▼ -20.00%
- Reading proficiency
- 31% ▼ -10.00%
- Median HH income
- $50,423
- Composite
- 24.56/100
- National rank
- #7641
- State rank
- #65 of 139 in TN
Livability — Clarksville
- Score
- 84/100
- State rank
- #1
- US rank
- #798
Category grades
Schools grade is shown separately in the Schools card above.
Census & demographics
- Census place
- Clarksville, TN
- County
- Montgomery County · 211,371 people
- City population
- 211,371
- Metro
- Clarksville, TN-KY
- Population (ZIP)
- 64,977
- Household income
- $67,745
- Rent vs Own
- Severe rent burden
- 2670.0
Population outlook (Montgomery County) Hauer SSP2
- Today (2025)
- 236,633 people
- By 2030
- 258,978 · +9.4%
- By 2040
- 305,456 · +29.1%
- By 2050
- 353,147 · +49.2%
- By 2075
- 471,289 · +99.2%
- By 2100
- 564,122 · +138.4%
Race, ethnicity, and origin ACS 2023
- Neighborhood character
- Diverse neighborhood (Simpson 0.61)
- Race & ethnicity
- White 56% Black 25% Two or more races 11% Hispanic / Latino 10% Asian 2%
- Hispanic origin (detail)
- Mexican 6% Puerto Rican 2%
- Common ancestry
- Italian 4% Lithuanian 1% Slovak 1%
- Foreign-born
- 6% · Canada, South Korea
- Languages at home
- 90% English-only · Spanish 5% Other Asian/Pacific 1% Other Indo-European 1%
Political lean MEDSL · Montgomery
- 2024 margin
- R (+18.4) · D 40.0% · R 58.5% · Other 1.5%
- 2008→2024 swing
- -10.5pp toward R · 2008: -7.9pp · 2024: -18.4pp
- All cycles
- 2024: R+18.4 2020: R+12.7 2016: R+18.6 2012: R+10.5 2008: R+7.9
Not yet ingested
- Civics
- —
Market trends
- HPI YoY
- ▼ -75.79%
- Current HPI
- 269.0601
- Rent YoY
- ▲ 1.32%
- Metro
- Clarksville, TN-KY
- State GDP YoY
- ▲ 2.78%
- F500 in state
- 22
Industry mix (Fortune 500 HQ in TN)
| Industry | F500 HQs | Revenue |
|---|---|---|
| Healthcare | 3 | $91B |
|
||
| Retail | 3 | $72B |
|
||
| Transportation / Logistics | 1 | $88B |
|
||
| Paper / Packaging | 1 | $19B |
|
||
| Insurance | 1 | $13B |
|
||
| Energy | 1 | $12B |
|
||
Cash-flow waterfall
monthlySold comps — $/sqft
last 12 mo · ≤1 miLoading sold comps…