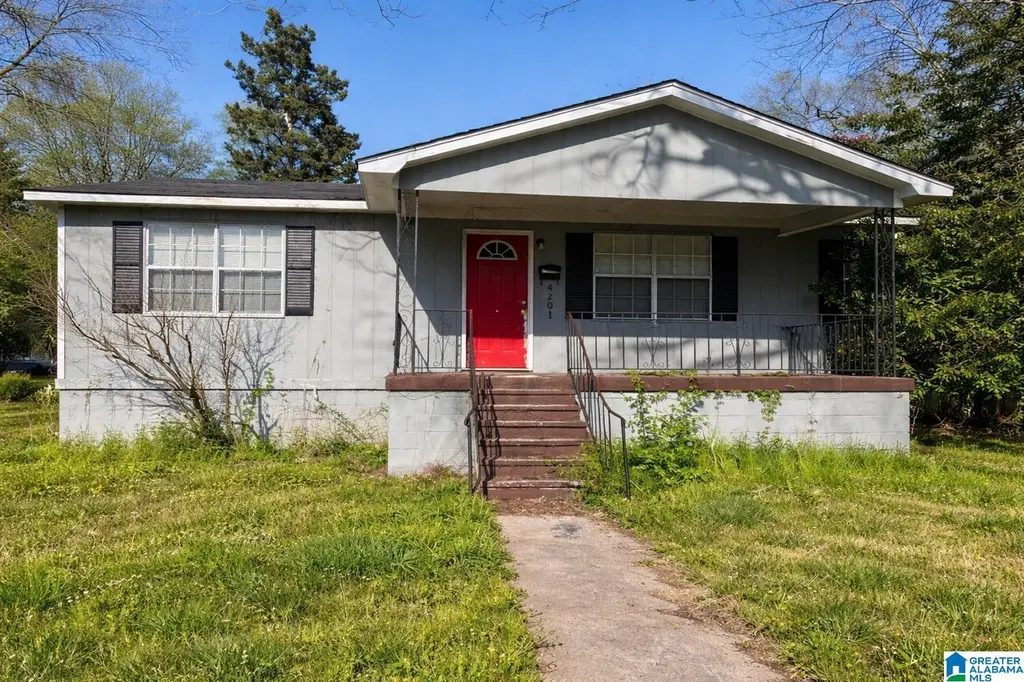
4201 Pulaski St · Birmingham, AL
Flood risk 1/10 · Minimal
- FEMA flood zone
- X (unshaded)
- Chance of flooding over 30 yrs
- 0.0%
- Est. flood insurance / yr
- $507 – $1,088
Fire risk 3/10 · Minor
- Est. fire insurance / yr
- $916 – $1,700
Heat risk 6/10 · Moderate
- Hot days now (above 106°F)
- 7 days/yr
- Hot days in 30 yrs
- 19 days/yr
Wind risk 6/10 · Moderate
- Chance of severe wind over 30 yrs
- 27.0%
Air-quality risk 5/10 · Moderate
- Unhealthy air days now
- 9 days/yr
- Unhealthy air days in 30 yrs
- 10 days/yr
Risk factors via First Street. Map © Google.
Why this score? — see what drove the C+ grade
The composite is a weighted blend of 9 inputs, each scored 0–100. Each bar is that input's sub-score; the figure is the points it added to the 100-point composite (weight × sub-score).
- Cash flow +30.0/30.0
- 1% rule +10.0/10.0
- DSCR +10.0/10.0
- Rent growth +3.4/5.0
- Livability +3.4/5.0
- Condition / age +2.5/5.0
- Schools +0.9/10.0
- ARV discount +0.2/15.0
- Appreciation +0.0/10.0
$69,900
🖨 Deal sheet 📄 Offer letter ✓ Due diligence
Listing remarks MLS
Opportunity awaits with this 3-bedroom home situated on a large lot at 4201 Pulaski. Offering plenty of space and potential, this property is ideal for buyers looking to customize or add value. The generous lot provides room for expansion, outdoor living, or additional improvements. A great option for investors or those seeking a project with upside. Receivership property being sold as-is.
Key facts
- Large lot
- Room for expansion
- Outdoor living
Tags
Neighborhood map
What this means for you Summary
Snapshot
- This is a 3-bed/2.0-bath single-family listed at $70k.
Deal economics
- At list price, monthly cash flow is $437 ($5k/yr) — positive.
- The deal already cash-flows at list — no discount required.
- Meets the 1% rule at list price ($1k rent vs $70k).
- Recommended offer: $66k (6.0% below list) — sets the bar for market timing.
- Cap rate 13.8% vs local median 6.2% in Birmingham — top-decile yield for the area; either an underpriced asset or a hidden risk that comps aren't pricing in. Stress-test before assuming the spread holds.
Location & tenants
- Location reads 67/100 on livability (#78 in AL) — a middle-class / working-renter tenant base. Strengths: commute A+, cost of living A+, housing A+; Watch: amenities C-, schools F, crime F.
- Birmingham City (urban): math 4% / reading 20% proficiency, ranked #116 of 129 in AL (top 90%) — low school quality limits family demand, transient renter base, plan for 1-2y turnover; 82% free/reduced lunch — lower-income household profile, screen leases tightly.
- Market conditions: Rents rising (+3.6%/yr); 94 active listings in the ZIP; 40 comparable units currently listed for rent nearby; rentals lingering (median 44d on market — plan ~5-8 weeks vacancy on turnover, expect pricing pressure); 60% of comp listings sitting > 30 days — soft ceiling on asking rent; lower-income renter base — watch delinquency; 2,114 units permitted in Jefferson County in 2024 (556 in 5+ unit buildings).
- This rent runs 34% of the median local income ($40k/yr) — at the standard rent-burdened threshold; future hikes will face affordability resistance.
Forward outlook
- Local home prices are declining (-3.0%/yr); year-one equity from $483 of loan paydown is wiped out by about $2k of value loss. Plan a longer hold.
- Jefferson County population projected to shrink 4% by 2050 — rents likely to lag national; underwrite the cash flow, not the appreciation.
- At projected returns (-3.0% appreciation + 3.6% rent growth), your $20k cash investment doubles in ~5 years — after that, you're playing with house money.
Negotiation context
- It's been on market 79 days — a 6% lower offer ($66k) is reasonable based on typical stale-listing flexibility.
- 3 sale attempts since 13y ago with the ask held roughly flat each time — persistent listings suggest the price (not the market) is what's stuck; bring a comps-based counter.
- Current owner paid $41k; list at $70k implies a 70% gain — meaningful room to come down on a strong offer.
Risks & watch-outs
- Climate carrying-cost: major wind risk, 27% chance of damaging wind over 30y; extreme-heat days projected 7→19/yr by 2055 (HVAC capex compounding) — expect insurance premiums to compound above CPI over the hold.
Questions for the listing agent
- It's been on market 79 days. Have you received any prior offers? Is the seller open to a 6% concession, seller financing, or rate buy-down credit?
- Built in 1978 — when were the roof, HVAC, electrical panel, plumbing, and water heater last replaced?
- Why hasn't it sold? Are there any deal-killer items the seller is aware of (foundation, flood, title, zoning, code violations)?
- Is there a deadline driving the sale (1031 exchange, divorce, estate, relocation)? That informs how much negotiation room exists.
- Schools are F-rated, which usually means shorter tenancies and higher turnover. Who's the typical renter profile here, and what's been the actual vacancy rate?
- Crime grade is F in this area — have there been break-ins, vandalism, or insurance claims at this property in the last 3 years? What carrier currently insures it and at what premium?
- What's the average days-on-market for RENTAL listings here right now (not sales)? A rising rental-DOM trend means longer vacancies and softer asking-rent achievability than the comps imply.
- What's the recent tenant-quality profile in this submarket — average credit score on applications, eviction rate, late-payment / NSF rate, and stable-employment percentage? A property-management company in the area should have these aggregated.
- How much new for-sale + rental construction is in the pipeline within 1–3 miles? Heavy new supply typically softens prices + rents 12–24 months out; constrained supply supports both.
Investment metrics
- 1% rule
- 1.64% ✓
- Cap rate
- 13.80%
- Cash-on-cash
- 26.82%
- DSCR
- 2.19
- GRM
- 5.1
CMA / ARV
- ARV (median comp)
- $60,187
- List price
- $69,900
- Delta
- 16.14%
- Verdict
- OVERPRICED
- Comps
- 20 within 1.0 mi
Show comp detail 12 sales within ~0.75 mi
| Address | Dist | Beds/Ba | Sqft | Sold | Price | $/sf | Match |
|---|---|---|---|---|---|---|---|
| 4125 40th Ave N | 0.51mi | 3/2.0 | 1,144 (-1%) | 4mo | $67,000 | $59 | 72 |
| 4300 Pulaski St | 0.08mi | 2/1.0 (-1) | 1,045 (-9%) | 1mo | $45,000 | $43 | 71 |
| 3929 41st Ave N | 0.33mi | 2/1.0 (-1) | 1,120 (-3%) | 2mo | $52,000 | $46 | 69 |
| 725 Fulton Ave | 0.36mi | 3/1.0 | 1,110 (-4%) | 5mo | $80,050 | $72 | 69 |
| 4421 43rd St N | 0.42mi | 3/1.0 | 1,200 (+4%) | 4mo | $42,000 | $35 | 66 |
| 4208 50th Ave N | 0.43mi | 3/1.0 | 1,104 (-4%) | 7mo | $67,500 | $61 | 63 |
| 621 Bell Ave | 0.27mi | 3/1.0 | 1,008 (-12%) | 1mo | $68,000 | $67 | 62 |
| 4316 Gadsden St | 0.35mi | 2/1.0 (-1) | 1,048 (-9%) | 5mo | $50,000 | $48 | 56 |
| 817 Jackson Blvd | 0.46mi | 3/1.0 | 1,025 (-11%) | 1mo | $114,429 | $112 | 55 |
| 4125 43rd Ave N | 0.29mi | 2/1.0 (-1) | 981 (-15%) | 4mo | $28,000 | $29 | 49 |
| 732 Fulton Ave | 0.39mi | 4/2.0 (+1) | 1,320 (+15%) | 4mo | $95,000 | $72 | 49 |
| 1045 Waverly St | 0.74mi | 3/1.0 | 1,014 (-12%) | 9mo | $65,000 | $64 | 34 |
Match score weights: distance 35% · size 25% · config 20% · recency 20%. Top-matched comps best support the ARV.
Projected returns pro-forma
-3.0% appreciation · 3.58% rent growth · sell at horizon
- IRR
- 21.4%
- Equity multiple
- 1.88×
- Total profit
- $17,212
- Equity at exit
- $10,422
- IRR
- 29.9%
- Equity multiple
- 3.74×
- Total profit
- $53,678
- Equity at exit
- $6,044
Cash invested: $19,572 (down + closing). Projections, not guarantees.
Landlord ↔ Tenant lean methodology
- Overall (STATE)
- 90 Strongly Landlord-Friendly
- State Alabama
- 90 Strongly Landlord-Friendly · R+15
- County
- — inherits STATE
- City
- — inherits STATE
ZIP-level market 35217
- Rents YoY
- 3.6%
- Active inventory
- 94
- Price-to-rent
- 5.1×
Monthly cashflow live
- Estimated rent
- $1,144 high interval (Pro) →
- Mortgage (P&I)
- −$367
- Tax from tax record
- −$71 /mo · $847/yr
- Insurance
- −$29
- HOA
- −$0
- Vacancy / Maint / Mgmt
- −$240
- Net cashflow
- $437
Break-even live
UW: 25.0% down · 7.5% · 30yr · 1.5% tax · 5.0% vac · 8.0% maint · 8.0% mgmt
Financing live
Cash to close
- Down payment
- $17,475
- Closing costs
- $2,097
- Reserves months
- —
- Total cash needed
- —
Loan-product check · same deal, 3 products live
Conventional
25% down · 7.5% · 30yr
- Down + closing
- —
- Monthly P&I
- —
- Monthly cashflow
- —
- DSCR
- —
- Eligible?
- —
Personal DTI + credit; lowest rate.
DSCR
20% down · 8.5% · 30yr
- Down + closing
- —
- Monthly P&I
- —
- Monthly cashflow
- —
- DSCR
- —
- Eligible?
- —
No personal income docs; deal must DSCR.
Hard money
10% down · 12.0% · 12mo
- Down + closing
- —
- Monthly P&I
- —
- Monthly cashflow
- —
- DSCR
- —
- Eligible?
- —
Short-term bridge; refi at stabilization.
Rent comps 40 comps
| Address | Beds | Baths | Sqft | Rent | $/sqft | DOM | Units | Dist |
|---|---|---|---|---|---|---|---|---|
| 4549 40th Pl N Birmingham, AL | 2.0 | 1.0 | 728 | $850 | $1.17 | 43d | 1 | 0.07mi |
| 4301 Greenwood St Birmingham, AL | 3.0 | 1.0 | 1140 | $1,025 | $0.90 | 2d | 1 | 0.10mi |
| 4329 Pulaski St Birmingham, AL | 3.0 | 2.0 | 1240 | $1,353 | $1.09 | 23d | 1 | 0.12mi |
| 4329 Harmon St Birmingham, AL | 3.0 | 1.0 | 1227 | $950 | $0.77 | 43d | 1 | 0.13mi |
| 4329 Harmon St Birmingham, AL | 3.0 | 1.0 | 1227 | $950 | $0.77 | 3d | 1 | 0.13mi |
| 4344 Pulaski St Birmingham, AL | 3.0 | 1.0 | 1268 | $1,050 | $0.83 | 43d | 1 | 0.16mi |
| 4244 Jackson St Birmingham, AL | 3.0 | 1.0 | 858 | $1,100 | $1.28 | 43d | 1 | 0.18mi |
| 1316 Spring St Birmingham, AL | 2.0 | 1.0 | 920 | $1,195 | $1.30 | 3d | 1 | 0.22mi |
| 3823 43rd Ave N Birmingham, AL | 3.0 | 2.0 | 1500 | $1,200 | $0.80 | 43d | 1 | 0.28mi |
| 3823 43rd Ave N Birmingham, AL | 3.0 | 2.0 | 1500 | $1,200 | $0.80 | 23d | 1 | 0.28mi |
| 4101 50th Ave N Unit B Birmingham, AL | 2.0 | 1.0 | 850 | $900 | $1.06 | 43d | 1 | 0.34mi |
| 732 Fulton Ave Birmingham, AL | 4.0 | 2.0 | 1320 | $1,450 | $1.10 | 43d | 1 | 0.37mi |
| 4316 Gadsden St Birmingham, AL | 2.0 | 1.0 | 1048 | $1,100 | $1.05 | 3d | 1 | 0.37mi |
| 1303 Main St Birmingham, AL | 4.0 | 2.0 | 1432 | $1,300 | $0.91 | 43d | 1 | 0.38mi |
| 4208 50th Ave N Birmingham, AL | 3.0 | 1.0 | 1104 | $1,200 | $1.09 | 43d | 1 | 0.40mi |
| 4217 43rd Ave N Birmingham, AL | 3.0 | 1.0 | 1140 | $1,200 | $1.05 | 3d | 1 | 0.41mi |
| 4028 40th Ave N Birmingham, AL | 3.0 | 1.0 | 1186 | $950 | $0.80 | 43d | 1 | 0.45mi |
| 5015 42nd Pl N Birmingham, AL | 3.0 | 2.0 | 1500 | $1,200 | $0.80 | 43d | 1 | 0.46mi |
| 4220 40th Ct N Birmingham, AL | 3.0 | 1.0 | 948 | $1,200 | $1.27 | 43d | 1 | 0.52mi |
| 4925 43rd Way N Birmingham, AL | 3.0 | 2.0 | 1232 | $1,461 | $1.19 | 1d | 1 | 0.54mi |
| 5025 43rd Pl N Birmingham, AL | 4.0 | 2.0 | 1017 | $1,300 | $1.28 | 43d | 1 | 0.56mi |
| 4317 41st Ave N Birmingham, AL | 3.0 | 1.0 | 864 | $1,000 | $1.16 | 43d | 1 | 0.57mi |
| 4400 43rd St N Birmingham, AL | 3.0 | 1.0 | 1152 | $850 | $0.74 | 43d | 1 | 0.58mi |
| 4400 43rd St N Birmingham, AL | 3.0 | 1.0 | 1152 | $850 | $0.74 | 14d | 1 | 0.58mi |
| 4231 40th Ave N Birmingham, AL | 3.0 | 1.0 | 1272 | $850 | $0.67 | 19d | 1 | 0.60mi |
| 1043 Jackson Blvd Birmingham, AL | 4.0 | 2.0 | 1300 | $1,095 | $0.84 | 14d | 1 | 0.62mi |
| 1224 Maple St Birmingham, AL | 2.0 | 1.0 | 812 | $690 | $0.85 | 19d | 1 | 0.62mi |
| 4236 39th Ave N Birmingham, AL | 3.0 | 2.0 | 1000 | $1,195 | $1.20 | 23d | 1 | 0.64mi |
| 1237 Elm Ave Birmingham, AL | 2.0 | 1.5 | 1312 | $1,150 | $0.88 | 43d | 1 | 0.67mi |
| 3708 42nd Ave N Birmingham, AL | 3.0 | 1.0 | 876 | $950 | $1.08 | 43d | 1 | 0.69mi |
| 1045 Waverly St Birmingham, AL | 3.0 | 1.0 | 1014 | $1,000 | $0.99 | 43d | 1 | 0.72mi |
| 1120 Hall St Birmingham, AL | 2.0 | 1.0 | 887 | $775 | $0.87 | 43d | 1 | 0.78mi |
| 1116 Hall St Birmingham, AL | 2.0 | 1.0 | 887 | $775 | $0.87 | 43d | 1 | 0.79mi |
| 1113 Elm Ave Unit c Birmingham, AL | 2.0 | 1.0 | 800 | $749 | $0.94 | 43d | 1 | 0.85mi |
| 1249 Waverly St Birmingham, AL | 3.0 | 1.0 | 1260 | $1,000 | $0.79 | 43d | 1 | 0.87mi |
| 1076 Green St Birmingham, AL | 3.0 | 1.0 | 1172 | $1,050 | $0.90 | 16d | 1 | 0.92mi |
| 1439 Sloan Ave Birmingham, AL | 3.0 | 1.0 | 936 | $900 | $0.96 | 43d | 1 | 0.95mi |
| 1137 Sloan Ave Birmingham, AL | 2.0 | 1.0 | 750 | $750 | $1.00 | 14d | 1 | 0.96mi |
| 1415 Virginia St Birmingham, AL | 2.0 | 1.0 | 781 | $650 | $0.83 | 43d | 1 | 0.98mi |
| 1401 Wharton Ave Birmingham, AL | 2.0 | 1.0 | 1104 | $950 | $0.86 | 19d | 1 | 0.98mi |
Listing history 21 events
-
2026-06-18days on market $69,900 Active 79 DOM
-
2026-06-17days on market $69,900 Active 78 DOM
-
2026-06-16days on market $69,900 Active 77 DOM
-
2026-06-15days on market $69,900 Active 76 DOM
-
2026-06-13days on market $69,900 Active 74 DOM
-
2026-06-10days on market $69,900 Active 71 DOM
-
2026-06-09days on market $69,900 Active 70 DOM
-
2026-06-08days on market $69,900 Active 69 DOM
-
2026-06-07days on market $69,900 Active 68 DOM
-
2026-06-03days on market $69,900 Active 64 DOM
-
2026-06-02days on market $69,900 Active 63 DOM
-
2026-06-01days on market $69,900 Active 62 DOM
-
2026-05-31days on market $69,900 Active 61 DOM
-
2026-03-30$69,900 Active 392-char remark
Show marketing remark (392 chars)
Opportunity awaits with this 3-bedroom home situated on a large lot at 4201 Pulaski. Offering plenty of space and potential, this property is ideal for buyers looking to customize or add value. The generous lot provides room for expansion, outdoor living, or additional improvements. A great option for investors or those seeking a project with upside. Receivership property being sold as-is.
-
2026-02-03price $69,900
-
2019-05-20soldstatus $41,000 Sold
-
2019-05-09historical Contingent
-
2019-04-19$42,000 Active
-
2013-10-29soldstatus $14,900
-
2013-08-30$19,900
-
1982-11-08soldstatus $40,000
ⓘ Source: listings_history table (triggers on properties + properties_extension) + one-shot
backfill from property_details.listing_events for pre-trigger history.
Tax reassessment forecast AL · Resets to sale price
- Current annual tax
- $847 · $71/mo
- Projected year-2 tax
- $847 · $71/mo
- Expected delta
- $0/yr ($0/mo · 0.0%)
ⓘ Screening estimate from a state-policy table — verify with the county assessor before closing.
Climate risk First Street
- Flood 1/10 Low FEMA zone X (unshaded) · 0% chance over 30 yrs
- Wildfire 3/10 Moderate
- Heat 6/10 Major 7 d/yr ≥106°F today · 19 d/yr by 30 yrs out
- Wind 6/10 Major 27% chance of damaging wind over 30 yrs
- Air quality 5/10 Major 9 unhealthy d/yr today · 10 by 30 yrs out
Nearby sold comps map
Loading sold comps map…
Walkable amenities ~0.75 mi
Loading nearby amenities…
Taxation est. · year 1
- Rental income
- $13,727
- − Mortgage interest
- −$3,915
- − Property taxes
- −$847
- − Insurance
- −$350
- − Repairs & maintenance
- −$1,098
- − Management
- −$1,098
- − Depreciation
- −$2,033
- Taxable income
- $4,385
- Est. tax owed @ 24.0%
- −$1,052
- After-tax cash flow
- $4,197/yr
For passive investors: Depreciation is non-cash, so a rental often shows a tax loss while cash-flowing — sheltering income. Rental losses are passive: they offset passive income freely, and up to $25,000/yr can offset ordinary (W-2) income if you actively participate and your MAGI is under $100k (phasing out to $0 by $150k); unused losses carry forward. On sale, claimed depreciation is recaptured at up to 25%, and gains may owe capital-gains tax (a 1031 exchange can defer both). Figures are a year-1 estimate at your 24.0% rate — not tax advice; consult a CPA.
Schools (NCES district)
- District
- Birmingham City
- NCES district ID
- 0100390
- Math proficiency
- 4% ▼ -17.00%
- Reading proficiency
- 20% ▼ -4.00%
- Median HH income
- $31,988
- Composite
- 9.49/100
- National rank
- #9850
- State rank
- #116 of 129 in AL
Livability — Birmingham
- Score
- 67/100
- State rank
- #78
- US rank
- #10412
Category grades
Schools grade is shown separately in the Schools card above.
Census & demographics
- Census place
- Birmingham, AL
- County
- Jefferson County · 527,445 people
- City population
- 210,422
- Metro
- Birmingham-Hoover, AL
- Population (ZIP)
- 12,240
- Household income
- $40,486
- Rent vs Own
- Severe rent burden
- 594.0
Population outlook (Jefferson County) Hauer SSP2
- Today (2025)
- 669,185 people
- By 2030
- 669,694 · +0.1%
- By 2040
- 661,388 · -1.2%
- By 2050
- 643,086 · -3.9%
- By 2075
- 577,267 · -13.7%
- By 2100
- 474,758 · -29.1%
Race, ethnicity, and origin ACS 2023
- Neighborhood character
- Diverse neighborhood (Simpson 0.58)
- Race & ethnicity
- Black 57% White 27% Hispanic / Latino 14% Two or more races 6%
- Hispanic origin (detail)
- Mexican 9%
- Common ancestry
- Slovak 3% Italian 1%
- Foreign-born
- 7% · Canada, Guatemala
- Languages at home
- 86% English-only · Spanish 13%
Political lean MEDSL · Jefferson
- 2024 margin
- D (+10.4) · D 54.6% · R 44.2% · Other 1.2%
- 2008→2024 swing
- +5.4pp toward D · 2008: 5.1pp · 2024: 10.4pp
- All cycles
- 2024: D+10.4 2020: D+13.2 2016: D+7.2 2012: D+6.0 2008: D+5.1
Not yet ingested
- Civics
- —
Market trends
- HPI YoY
- ▼ -74.54%
- Current HPI
- 117.416
- Rent YoY
- ▲ 3.58%
- Metro
- Birmingham-Hoover, AL
- State GDP YoY
- ▲ 2.94%
- F500 in state
- 4
Industry mix (Fortune 500 HQ in AL)
| Industry | F500 HQs | Revenue |
|---|---|---|
| Financial Services | 1 | $8B |
|
||
| Healthcare | 1 | $5B |
|
||
Price history
+74.8% since first listed8 events — show timeline
- 2026-03-30 Listed $69,900 Greater Alabama MLS
- 2026-02-03 Price Changed $69,900 Greater Alabama MLS
- 2019-05-20 Sold (MLS) $41,000 Greater Alabama MLS
- 2019-05-09 Contingent — Greater Alabama MLS
- 2019-04-19 Listed $42,000 Greater Alabama MLS
- 2013-10-29 Sold (MLS) $14,900 Greater Alabama MLS
- 2013-08-30 Listed $19,900 Greater Alabama MLS
- 1982-11-08 Sold (Public Records) $40,000 Public Records
Property tax history
-1.2%/yrLatest (2025): $847 · +0.0% YoY. Source: county tax records.
Cash-flow waterfall
monthlySold comps — $/sqft
last 12 mo · ≤1 miLoading sold comps…