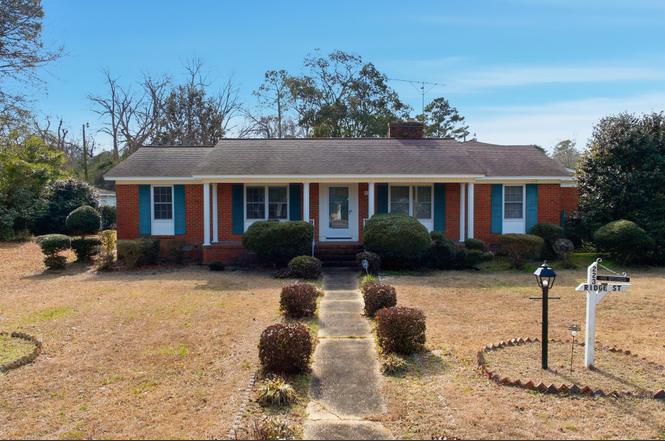
223 Ridge St · Bishopville, SC
Flood risk 1/10 · Minimal
- FEMA flood zone
- X (unshaded)
- Chance of flooding over 30 yrs
- 0.0%
- Est. flood insurance / yr
- $507 – $1,088
Fire risk 3/10 · Minor
- Est. fire insurance / yr
- $783 – $1,453
Heat risk 7/10 · Major
- Hot days now (above 108°F)
- 7 days/yr
- Hot days in 30 yrs
- 16 days/yr
Wind risk 7/10 · Major
- Chance of severe wind over 30 yrs
- 78.0%
Air-quality risk 1/10 · Minimal
- Unhealthy air days now
- 0 days/yr
- Unhealthy air days in 30 yrs
- 0 days/yr
Risk factors via First Street. Map © Google.
Why this score? — see what drove the D+ grade
The composite is a weighted blend of 9 inputs, each scored 0–100. Each bar is that input's sub-score; the figure is the points it added to the 100-point composite (weight × sub-score).
- ARV discount +15.0/15.0
- Cash flow +12.8/30.0
- Appreciation +4.9/10.0
- DSCR +3.8/10.0
- 1% rule +2.8/10.0
- Livability +2.8/5.0
- Rent growth +2.5/5.0
- Condition / age +2.5/5.0
- Schools +1.3/10.0
$150,000
🖨 Deal sheet 📄 Offer letter ✓ Due diligence
Listing remarks
Come see this wonderful 1 story home, located in Bishopville SC. 3 Bedroom 2 bath with large back yard, a lot of parking spaces for all your recreational vehicles and extra automobiles. Disclaimer: CMLS has not reviewed and, therefore, does not endorse vendors who may appear in listings.
Key facts
- Parking spaces
- Large back yard
- 0.84 acre lot
Tags
Property features AI
Exterior
- Parking: 4 parking spaces
- Utilities: Public sewer; Public water
- Home design: Single-story home
- Construction: Block exterior finish; Crawlspace foundation
- Exterior features: Screened back porch; Partial fencing; Public water
Interior
- Kitchen: Kitchen on the main level with vinyl flooring
- Bedrooms: Main-level master bedroom with ceiling fan and hardwood floors; Main-level second bedroom with ceiling fan and hardwood floors; Main-level third bedroom with ceiling fan and hardwood floors; Fourth bedroom located on the main level
- Flooring: Hardwood floors in living areas and bedrooms; Vinyl flooring in the kitchen
- Bathrooms: Two full bathrooms on the main level
- Heating & cooling: Central heating; Central cooling
- Interior features: Masonry fireplace; Dishwasher; Electric water heater
- Laundry & utility: Washer and dryer located on the main level
Neighborhood map
What this means for you Summary
Snapshot
- This is a 3-bed/2.0-bath single-family listed at $150k.
Deal economics
- At list price, monthly cash flow is $-15 ($-176/yr) — negative.
- To cash-flow at today's rent, offer at most $147k (1.7% below list).
- To meet the 1% rule (rent ≥ 1% of price), the offer needs to be $117k (21.7% below list).
- Recommended offer: $117k (21.7% below list) — sets the bar for 1% rule.
Location & tenants
- Location reads 55/100 on livability (#307 in SC) — a working-class tenant base; expect higher turnover. Strengths: cost of living A+, housing A+; Watch: schools F, crime F, amenities F.
- Lee 01 (rural): math 10% / reading 23% proficiency, ranked #78 of 80 in SC (top 98%) — low school quality limits family demand, transient renter base, plan for 1-2y turnover; 84% free/reduced lunch — lower-income household profile, screen leases tightly.
- Market conditions: 28 active listings in the ZIP; 18 units permitted in Lee County in 2024 (0 in 5+ unit buildings).
Forward outlook
- In year one you build about $767 of equity ($1k loan paydown + $-270 appreciation (-0.2% local appreciation)).
- Lee County population projected at -33% by 2050 — secular population decline; favor cash flow + early exit over multi-decade hold.
Negotiation context
- It's been on market 105 days — a 9% lower offer ($136k) is reasonable based on typical stale-listing flexibility.
- 2 sale attempts; this cycle's ask has dropped $40k (21%) from the opening price — seller is motivated, your offer sets the floor, not the list.
- Current owner paid $92k; list at $150k implies a 63% gain — meaningful room to come down on a strong offer.
Risks & watch-outs
- Climate carrying-cost: major wind risk, 78% chance of damaging wind over 30y; extreme-heat days projected 7→16/yr by 2055 (HVAC capex compounding) — expect insurance premiums to compound above CPI over the hold.
Questions for the listing agent
- What do current leases actually rent for vs. the listed asking? Can we see a recent rent roll and the last 12 months of T-12 income?
- It's been on market 105 days. Have you received any prior offers? Is the seller open to a 22% concession, seller financing, or rate buy-down credit?
- Built in 1963 — when were the roof, HVAC, electrical panel, plumbing, and water heater last replaced?
- Why hasn't it sold? Are there any deal-killer items the seller is aware of (foundation, flood, title, zoning, code violations)?
- Is there a deadline driving the sale (1031 exchange, divorce, estate, relocation)? That informs how much negotiation room exists.
- Schools are F-rated, which usually means shorter tenancies and higher turnover. Who's the typical renter profile here, and what's been the actual vacancy rate?
- Crime grade is F in this area — have there been break-ins, vandalism, or insurance claims at this property in the last 3 years? What carrier currently insures it and at what premium?
- The area grade is low — what's the realistic commute time and amenity access for the typical tenant pool here? Any planned neighborhood developments (good or bad) we should know about?
- What's the average days-on-market for RENTAL listings here right now (not sales)? A rising rental-DOM trend means longer vacancies and softer asking-rent achievability than the comps imply.
- What's the recent tenant-quality profile in this submarket — average credit score on applications, eviction rate, late-payment / NSF rate, and stable-employment percentage? A property-management company in the area should have these aggregated.
- How much new for-sale + rental construction is in the pipeline within 1–3 miles? Heavy new supply typically softens prices + rents 12–24 months out; constrained supply supports both.
Investment metrics
- 1% rule
- 0.78% ✗
- Cap rate
- 6.18%
- Cash-on-cash
- -0.42%
- DSCR
- 0.98
- GRM
- 10.6
CMA / ARV
- ARV (on-the-fly)
- $207,095
- Comps found
- 6
Show comp detail 6 sales within ~0.75 mi
| Address | Dist | Beds/Ba | Sqft | Sold | Price | $/sf | Match |
|---|---|---|---|---|---|---|---|
| 217 Roundup Dr | 0.23mi | 4/2.0 (+1) | 2,000 (-6%) | 13mo | $188,000 | $94 | 63 |
| 312 Elk St | 0.46mi | 4/2.5 (+1) | 2,000 (-6%) | 7mo | $127,000 | $64 | 55 |
| 301 Harris St | 0.51mi | 3/2.0 | 1,971 (-8%) | 17mo | $215,500 | $109 | 50 |
| 113 Saint Charles Rd | 0.56mi | 2/2.0 (-1) | 1,883 (-12%) | 5mo | $200,000 | $106 | 45 |
| 304 W Church St | 0.41mi | 3/3.0 | 1,974 (-8%) | 24mo | $127,000 | $64 | 44 |
| 609 W Church St | 0.46mi | 4/3.5 (+1) | 2,427 (+14%) | 12mo | $235,000 | $97 | 34 |
Match score weights: distance 35% · size 25% · config 20% · recency 20%. Top-matched comps best support the ARV.
Projected returns pro-forma
-0.18% appreciation · 3.0% rent growth · sell at horizon
- IRR
- -3.4%
- Equity multiple
- 0.84×
- Total profit
- $-6,624
- Equity at exit
- $42,212
- IRR
- 2.5%
- Equity multiple
- 1.27×
- Total profit
- $11,132
- Equity at exit
- $49,682
Cash invested: $42,000 (down + closing). Projections, not guarantees.
Landlord ↔ Tenant lean methodology
- Overall (STATE)
- 90 Strongly Landlord-Friendly
- State South Carolina
- 90 Strongly Landlord-Friendly · R+6
- County
- — inherits STATE
- City
- — inherits STATE
ZIP-level market 29010
- Home prices YoY
- -0.1%
- Active inventory
- 28
- Price-to-rent
- 10.6×
Monthly cashflow live
- Estimated rent
- $1,175 medium interval (Pro) →
- Mortgage (P&I)
- −$787
- Tax from tax record
- −$93 /mo · $1,121/yr
- Insurance
- −$62
- HOA
- −$0
- Vacancy / Maint / Mgmt
- −$247
- Net cashflow
- $-15
Break-even live
UW: 25.0% down · 7.5% · 30yr · 1.5% tax · 5.0% vac · 8.0% maint · 8.0% mgmt
Financing live
Cash to close
- Down payment
- $37,500
- Closing costs
- $4,500
- Reserves months
- —
- Total cash needed
- —
Loan-product check · same deal, 3 products live
Conventional
25% down · 7.5% · 30yr
- Down + closing
- —
- Monthly P&I
- —
- Monthly cashflow
- —
- DSCR
- —
- Eligible?
- —
Personal DTI + credit; lowest rate.
DSCR
20% down · 8.5% · 30yr
- Down + closing
- —
- Monthly P&I
- —
- Monthly cashflow
- —
- DSCR
- —
- Eligible?
- —
No personal income docs; deal must DSCR.
Hard money
10% down · 12.0% · 12mo
- Down + closing
- —
- Monthly P&I
- —
- Monthly cashflow
- —
- DSCR
- —
- Eligible?
- —
Short-term bridge; refi at stabilization.
Listing history 15 events
-
2026-06-13status $150,000 Pending 105 DOM
-
2026-06-10days on market $150,000 Active 105 DOM
-
2026-06-09days on market $150,000 Active 104 DOM
-
2026-06-08days on market $150,000 Active 103 DOM
-
2026-06-07pricedays on market $150,000 Active 102 DOM
-
2026-06-05days on market $170,000 Active 99 DOM
-
2026-06-02days on market $170,000 Active 97 DOM
-
2026-06-01days on market $170,000 Active 96 DOM
-
2026-05-31days on market $170,000 Active 95 DOM
-
2026-05-30days on market $170,000 Active 94 DOM
-
2026-04-27price $170,000
-
2026-04-27status Active
-
2026-04-13status Pending
-
2026-02-11$190,000 Active
-
1998-09-02soldstatus $92,200
ⓘ Source: listings_history table (triggers on properties + properties_extension) + one-shot
backfill from property_details.listing_events for pre-trigger history.
Tax reassessment forecast SC · Resets to sale price
- Current annual tax
- $1,121 · $93/mo
- Projected year-2 tax
- $1,121 · $93/mo
- Expected delta
- $0/yr ($0/mo · 0.0%)
ⓘ Screening estimate from a state-policy table — verify with the county assessor before closing.
Climate risk First Street
- Flood 1/10 Low FEMA zone X (unshaded) · 0% chance over 30 yrs
- Wildfire 3/10 Moderate
- Heat 7/10 Severe 7 d/yr ≥108°F today · 16 d/yr by 30 yrs out
- Wind 7/10 Severe 78% chance of damaging wind over 30 yrs
- Air quality 1/10 Low 0 unhealthy d/yr today · 0 by 30 yrs out
Nearby sold comps map
Loading sold comps map…
Walkable amenities ~0.75 mi
Loading nearby amenities…
Taxation est. · year 1
- Rental income
- $14,094
- − Mortgage interest
- −$8,402
- − Property taxes
- −$1,121
- − Insurance
- −$750
- − Repairs & maintenance
- −$1,128
- − Management
- −$1,128
- − Depreciation
- −$4,364
- Taxable loss
- −$2,798
- Est. tax savings @ 24.0%
- +$671
- After-tax cash flow
- $496/yr
For passive investors: Depreciation is non-cash, so a rental often shows a tax loss while cash-flowing — sheltering income. Rental losses are passive: they offset passive income freely, and up to $25,000/yr can offset ordinary (W-2) income if you actively participate and your MAGI is under $100k (phasing out to $0 by $150k); unused losses carry forward. On sale, claimed depreciation is recaptured at up to 25%, and gains may owe capital-gains tax (a 1031 exchange can defer both). Figures are a year-1 estimate at your 24.0% rate — not tax advice; consult a CPA.
Schools (NCES district)
- District
- Lee 01
- NCES district ID
- 4502670
- Math proficiency
- 10% ▼ -8.00%
- Reading proficiency
- 23% ▼ -1.00%
- Median HH income
- $28,700
- Composite
- 12.93/100
- National rank
- #9583
- State rank
- #78 of 80 in SC
Livability — Bishopville
- Score
- 55/100
- State rank
- #307
- US rank
- #23408
Category grades
Schools grade is shown separately in the Schools card above.
Census & demographics
- Census place
- Bishopville, SC
- Population (ZIP)
- 11,564
Population outlook (Lee County) Hauer SSP2
- Today (2025)
- 15,822 people
- By 2030
- 14,703 · -7.1%
- By 2040
- 12,434 · -21.4%
- By 2050
- 10,603 · -33.0%
- By 2075
- 8,103 · -48.8%
- By 2100
- 6,932 · -56.2%
Race, ethnicity, and origin ACS 2023
- Neighborhood character
- Majority Black (61%)
- Race & ethnicity
- Black 61% White 35% Two or more races 3% Hispanic / Latino 1%
- Common ancestry
- Serbian 2% Slovak 1%
- Foreign-born
- 2% · Canada
- Languages at home
- 96% English-only · Spanish 2%
Political lean MEDSL · Lee
- 2024 margin
- D (+17.7) · D 55.8% · R 38.1% · Other 6.1%
- 2008→2024 swing
- -13.9pp toward R · 2008: 31.5pp · 2024: 17.7pp
- All cycles
- 2024: D+17.7 2020: D+27.5 2016: D+29.4 2012: D+35.3 2008: D+31.5
Not yet ingested
- Civics
- —
Market trends
- HPI YoY
- ▼ -0.18%
- Current HPI
- 120.6432
- Rent YoY
- —
- Metro
- —
- State GDP YoY
- ▲ 4.51%
- F500 in state
- 2
Industry mix (Fortune 500 HQ in SC)
| Industry | F500 HQs | Revenue |
|---|---|---|
| Packaging | 1 | $7B |
|
||
Price history
+84.4% since first listed5 events — show timeline
- 2026-04-27 Price Changed $170,000 Consolidated MLS
- 2026-04-27 Relisted — Consolidated MLS
- 2026-04-13 Pending — Consolidated MLS
- 2026-02-11 Listed $190,000 Consolidated MLS
- 1998-09-02 Sold (Public Records) $92,200 Public Records
Property tax history
+6.5%/yrLatest (2025): $1,121 · -60.4% YoY. Source: county tax records.
Cash-flow waterfall
monthlySold comps — $/sqft
last 12 mo · ≤1 miLoading sold comps…