 🏷️ Likely Rental
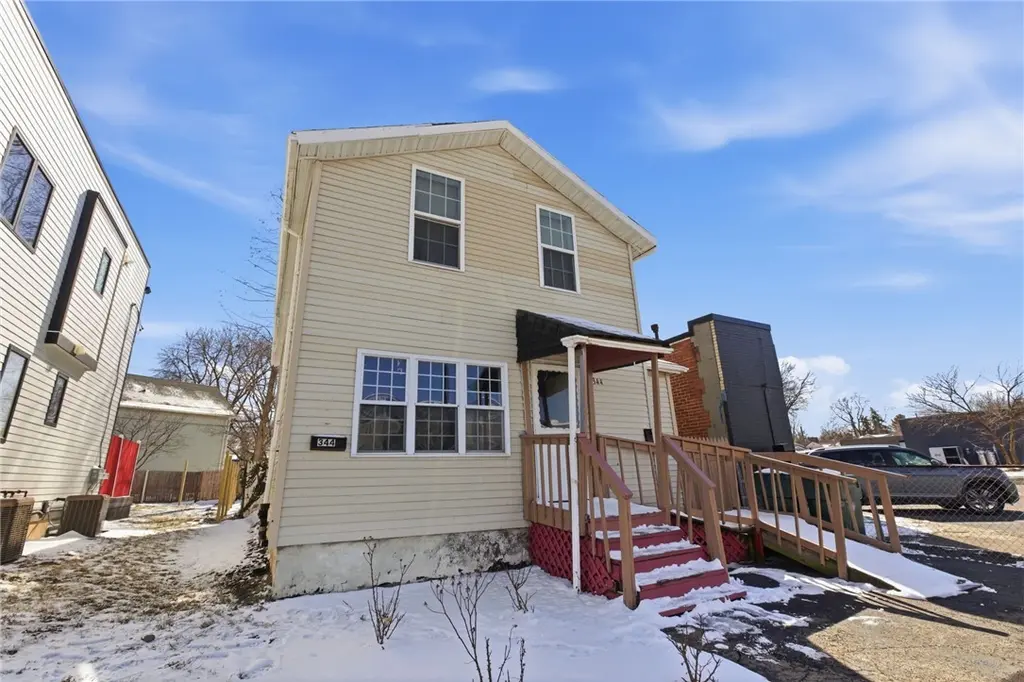
344 Mount Hope Ave · Rochester, NY
Flood risk 6/10 · Moderate
- FEMA flood zone
- X (unshaded)
- Chance of flooding over 30 yrs
- 0.72%
- Est. flood insurance / yr
- $473 – $860
Fire risk 1/10 · Minimal
- Est. fire insurance / yr
- $691 – $1,283
Heat risk 2/10 · Minimal
- Hot days now (above 96°F)
- 7 days/yr
- Hot days in 30 yrs
- 15 days/yr
Wind risk 1/10 · Minimal
- Chance of severe wind over 30 yrs
- —
Air-quality risk 2/10 · Minimal
- Unhealthy air days now
- 1 days/yr
- Unhealthy air days in 30 yrs
- 1 days/yr
Risk factors via First Street. Map © Google.
Why this score? — see what drove the B grade
The composite is a weighted blend of 9 inputs, each scored 0–100. Each bar is that input's sub-score; the figure is the points it added to the 100-point composite (weight × sub-score).
- Cash flow +28.4/30.0
- ARV discount +15.0/15.0
- DSCR +10.0/10.0
- 1% rule +6.9/10.0
- Livability +3.8/5.0
- Rent growth +2.8/5.0
- Condition / age +2.5/5.0
- Schools +1.9/10.0
- Appreciation +0.0/10.0
$199,900
🖨 Deal sheet (PDF) 📄 Offer letter ✓ Due diligence
Listing remarks MLS
Great investment opportunity in the South Wedge neighborhood! This 6-bedroom, 3-bath home already brings in $2,460/month in rental income with potential to be $3,260/month. Prime location near universities, major employers, dining, public transportation, and Highland Hospital. Sold in as-is condition.
Key facts
- Near major employers
- Near dining
- Near universities
Tags
Neighborhood map
What this means for you Summary
Snapshot
- This is a 6-bed/3.0-bath single-family listed at $200k.
Deal economics
- At list price, monthly cash flow is $645 ($8k/yr) — positive.
- The deal already cash-flows at list — no discount required.
- Meets the 1% rule at list price ($2k rent vs $200k).
- Recommended offer: $188k (6.0% below list) — sets the bar for market timing.
Location & tenants
- Location reads 76/100 on livability (#222 in NY, #3,482 nationally) — a middle-class / working-renter tenant base. Strengths: commute A+, cost of living A+, housing A+; Watch: crime F, employment F.
- Rochester City School District (urban): math 21% / reading 26% proficiency, ranked #589 of 590 in NY (top 100%) — low school quality limits family demand, transient renter base, plan for 1-2y turnover; 82% free/reduced lunch — lower-income household profile, screen leases tightly.
- Zoned schools: Anna Murray-Douglass Academy (math 8% / reading 12%, grade F, #2,075 of 2,108 statewide, top 99%, 757 students, 86% FRL); East Lower School (math 2% / reading 22%, grade F, #715 of 729 statewide, top 98%, 304 students, 86% FRL); Edison Career And Technology High School (math 44% / reading 50%, grade D-, #1,007 of 1,100 statewide, top 93%, 1,233 students, 91% FRL).
- Market conditions: Rents rising (+1.2%/yr); 76 active listings in the ZIP; 1,169 units permitted in Monroe County in 2024 (591 in 5+ unit buildings).
- At $2,382/mo this rent would consume 46% of the median local household income ($62k/yr) (locally 2013% of renters already pay >50% of income on rent) — very limited rent-growth headroom before tenants either downsize or default.
Forward outlook
- Local home prices are declining (-3.0%/yr); year-one equity from $1k of loan paydown is wiped out by about $6k of value loss. Plan a longer hold.
- Monroe County population projected to shrink 6% by 2050 — rents likely to lag national; underwrite the cash flow, not the appreciation.
Negotiation context
- It's been on market 74 days — a 6% lower offer ($188k) is reasonable based on typical stale-listing flexibility.
- 5 sale attempts since 8y ago with the ask held roughly flat each time — persistent listings suggest the price (not the market) is what's stuck; bring a comps-based counter.
- Current owner paid $30k; list at $200k implies a 566% gain — meaningful room to come down on a strong offer.
Risks & watch-outs
- Watch-outs: built in 1908 — expect roof / HVAC / electrical / plumbing capex.
- Climate carrying-cost: major flood risk — expect insurance premiums to compound above CPI over the hold.
Questions for the listing agent
- It's been on market 74 days. Have you received any prior offers? Is the seller open to a 6% concession, seller financing, or rate buy-down credit?
- Built in 1908 — when were the roof, HVAC, electrical panel, plumbing, and water heater last replaced?
- Why hasn't it sold? Are there any deal-killer items the seller is aware of (foundation, flood, title, zoning, code violations)?
- Is there a deadline driving the sale (1031 exchange, divorce, estate, relocation)? That informs how much negotiation room exists.
- Schools are D-rated, which usually means shorter tenancies and higher turnover. Who's the typical renter profile here, and what's been the actual vacancy rate?
- Crime grade is F in this area — have there been break-ins, vandalism, or insurance claims at this property in the last 3 years? What carrier currently insures it and at what premium?
- What's the average days-on-market for RENTAL listings here right now (not sales)? A rising rental-DOM trend means longer vacancies and softer asking-rent achievability than the comps imply.
- What's the recent tenant-quality profile in this submarket — average credit score on applications, eviction rate, late-payment / NSF rate, and stable-employment percentage? A property-management company in the area should have these aggregated.
- How much new for-sale + rental construction is in the pipeline within 1–3 miles? Heavy new supply typically softens prices + rents 12–24 months out; constrained supply supports both.
Investment metrics
- 1% rule
- 1.19% ✓
- Cap rate
- 10.17%
- Cash-on-cash
- 13.84%
- DSCR
- 1.62
- GRM
- 7.0
CMA / ARV
- ARV (median comp)
- $283,240
- List price
- $199,900
- Delta
- -29.42%
- Verdict
- UNDERPRICED
- Comps
- 2 within 1.0 mi
Projected returns pro-forma
-3.0% appreciation · 1.2% rent growth · sell at horizon
- IRR
- 2.1%
- Equity multiple
- 1.08×
- Total profit
- $4,426
- Equity at exit
- $29,806
- IRR
- 10.0%
- Equity multiple
- 1.71×
- Total profit
- $39,801
- Equity at exit
- $17,284
Cash invested: $55,972 (down + closing). Projections, not guarantees.
Landlord ↔ Tenant lean methodology
- Overall (STATE)
- 15 Strongly Tenant-Friendly
- State New York
- 15 Strongly Tenant-Friendly · D+10
- County
- — inherits STATE
- City
- — inherits STATE
ZIP-level market 14620
- Home prices YoY
- -20.1%
- Rents YoY
- 1.2%
- Active inventory
- 76
- Price-to-rent
- 7.0×
Monthly cashflow live
- Estimated rent
- $2,382 medium interval (Pro) →
- Mortgage (P&I)
- −$1,048
- Tax from tax record
- −$104 /mo · $1,252/yr
- Insurance
- −$83
- HOA
- −$0
- Vacancy / Maint / Mgmt
- −$500
- Net cashflow
- $645
Break-even live
Sensitivity live
| Price | -10% $759 | -5% $702 | +0% $645 | +5% $589 | +10% $532 |
|---|---|---|---|---|---|
| Rent | -10% $457 | -5% $551 | +0% $645 | +5% $740 | +10% $834 |
| Rate | -1.0pp $746 | -0.5pp $696 | base $645 | +0.5pp $594 | +1.0pp $541 |
UW: 25.0% down · 7.5% · 30yr · 1.5% tax · 5.0% vac · 8.0% maint · 8.0% mgmt
Financing live
Cash to close
- Down payment
- $49,975
- Closing costs
- $5,997
- Reserves months
- —
- Total cash needed
- —
Loan-product check · same deal, 3 products live
Conventional
25% down · 7.5% · 30yr
- Down + closing
- —
- Monthly P&I
- —
- Monthly cashflow
- —
- DSCR
- —
- Eligible?
- —
Personal DTI + credit; lowest rate.
DSCR
20% down · 8.5% · 30yr
- Down + closing
- —
- Monthly P&I
- —
- Monthly cashflow
- —
- DSCR
- —
- Eligible?
- —
No personal income docs; deal must DSCR.
Hard money
10% down · 12.0% · 12mo
- Down + closing
- —
- Monthly P&I
- —
- Monthly cashflow
- —
- DSCR
- —
- Eligible?
- —
Short-term bridge; refi at stabilization.
Listing history 30 events
-
2026-06-21days on market $199,900 Active 74 DOM
-
2026-06-18days on market $199,900 Active 71 DOM
-
2026-06-17days on market $199,900 Active 70 DOM
-
2026-06-16days on market $199,900 Active 69 DOM
-
2026-06-15days on market $199,900 Active 68 DOM
-
2026-06-13days on market $199,900 Active 66 DOM
-
2026-06-13days on market $199,900 Active 65 DOM
-
2026-06-10days on market $199,900 Active 63 DOM
-
2026-06-09days on market $199,900 Active 62 DOM
-
2026-06-09days on market $199,900 Active 61 DOM
-
2026-06-07days on market $199,900 Active 60 DOM
-
2026-06-05days on market $199,900 Active 57 DOM
-
2026-06-03days on market $199,900 Active 56 DOM
-
2026-06-03days on market $199,900 Active 55 DOM
-
2026-06-01days on market $199,900 Active 54 DOM
-
2026-05-31days on market $199,900 Active 53 DOM
-
2026-04-08$199,900 Active 302-char remark
Show marketing remark (302 chars)
Great investment opportunity in the South Wedge neighborhood! This 6-bedroom, 3-bath home already brings in $2,460/month in rental income with potential to be $3,260/month. Prime location near universities, major employers, dining, public transportation, and Highland Hospital. Sold in as-is condition.
-
2026-04-08historical
Show marketing remark (302 chars)
Great investment opportunity in the South Wedge neighborhood! This 6-bedroom, 3-bath home already brings in $2,460/month in rental income with potential to be $3,260/month. Prime location near universities, major employers, dining, public transportation, and Highland Hospital. Sold in as-is condition.
-
2026-03-21$215,000 Active
-
2021-08-19status Pending Sale
-
2021-08-13historical
-
2021-08-09$109,900 Active
-
2020-12-29historical
-
2020-12-07historical Continue to Show- Under Contract
-
2020-11-16price $114,900
-
2020-10-27$119,900 Active
-
2019-01-15price $99,900
-
2019-01-15historical
-
2018-10-16$109,900 Active
-
2006-10-12soldstatus $30,000
ⓘ Source: listings_history table (triggers on properties + properties_extension) + one-shot
backfill from property_details.listing_events for pre-trigger history.
Tax reassessment forecast NY · Partial reset (capped growth)
- Current annual tax
- $1,252 · $104/mo
- Projected year-2 tax
- $2,315 · $193/mo
- Expected delta
- +$1,063/yr (+$89/mo · 84.9%)
ⓘ Screening estimate from a state-policy table — verify with the county assessor before closing.
Climate risk First Street
- Flood 6/10 Major FEMA zone X (unshaded) · 72% chance over 30 yrs
- Wildfire 1/10 Low
- Heat 2/10 Low 7 d/yr ≥96°F today · 15 d/yr by 30 yrs out
- Wind 1/10 Low
- Air quality 2/10 Low 1 unhealthy d/yr today · 1 by 30 yrs out
Nearby sold comps map
Loading sold comps map…
Walkable amenities ~0.75 mi
Loading nearby amenities…
Taxation est. · year 1
- Rental income
- $28,578
- − Mortgage interest
- −$11,198
- − Property taxes
- −$1,252
- − Insurance
- −$1,000
- − Repairs & maintenance
- −$2,286
- − Management
- −$2,286
- − Depreciation
- −$5,815
- Taxable income
- $4,741
- Est. tax owed @ 24.0%
- −$1,138
- After-tax cash flow
- $6,608/yr
For passive investors: Depreciation is non-cash, so a rental often shows a tax loss while cash-flowing — sheltering income. Rental losses are passive: they offset passive income freely, and up to $25,000/yr can offset ordinary (W-2) income if you actively participate and your MAGI is under $100k (phasing out to $0 by $150k); unused losses carry forward. On sale, claimed depreciation is recaptured at up to 25%, and gains may owe capital-gains tax (a 1031 exchange can defer both). Figures are a year-1 estimate at your 24.0% rate — not tax advice; consult a CPA.
Schools (NCES district)
- District
- Rochester City School District
- NCES district ID
- 3624750
- Math proficiency
- 21% ▬ 0.00%
- Reading proficiency
- 26% ▲ 4.00%
- Median HH income
- $30,923
- Composite
- 18.98/100
- National rank
- #8850
- State rank
- #589 of 590 in NY
Livability — Rochester
- Score
- 76/100
- State rank
- #222
- US rank
- #3482
Category grades
Schools grade is shown separately in the Schools card above.
Census & demographics
- Census place
- Rochester, NY
- County
- Monroe County · 674,131 people
- City population
- 432,803
- Metro
- Rochester, NY
- Population (ZIP)
- 23,769
- Household income
- $61,783
- Rent vs Own
- Severe rent burden
- 2013.0
Population outlook (Monroe County) Hauer SSP2
- Today (2025)
- 759,460 people
- By 2030
- 757,154 · -0.3%
- By 2040
- 740,644 · -2.5%
- By 2050
- 714,443 · -5.9%
- By 2075
- 645,883 · -15.0%
- By 2100
- 547,084 · -28.0%
Race, ethnicity, and origin ACS 2023
- Neighborhood character
- Predominantly White (68%)
- Race & ethnicity
- White 68% Black 12% Asian 9% Hispanic / Latino 6% Two or more races 6%
- Hispanic origin (detail)
- Puerto Rican 3%
- Common ancestry
- Romanian 5% Iranian 3% Lithuanian 2%
- Foreign-born
- 13% · China, Canada, South Korea
- Languages at home
- 85% English-only · Chinese 4% Spanish 4% Other Indo-European 3%
Political lean MEDSL · Monroe
- 2024 margin
- D (+19.1) · D 59.5% · R 40.5%
- 2008→2024 swing
- +1.4pp toward D · 2008: 17.7pp · 2024: 19.1pp
- All cycles
- 2024: D+19.1 2020: D+21.0 2016: D+14.1 2012: D+17.4 2008: D+17.7
Not yet ingested
- Civics
- —
Market trends
- HPI YoY
- ▼ -84.77%
- Current HPI
- 337.6917
- Rent YoY
- ▲ 1.20%
- Metro
- Rochester, NY
- State GDP YoY
- ▲ 2.60%
- F500 in state
- 92
Industry mix (Fortune 500 HQ in NY)
| Industry | F500 HQs | Revenue |
|---|---|---|
| Financial Services | 10 | $950B |
|
||
| Consumer Goods | 9 | $162B |
|
||
| Insurance | 4 | $225B |
|
||
| Telecommunications | 2 | $144B |
|
||
| Pharmaceuticals | 2 | $112B |
|
||
| Media / Entertainment | 2 | $69B |
|
||
Price history
+566.3% since first listed14 events — show timeline
- 2026-04-08 Listing Removed — UNYREIS
- 2026-04-08 Listed $199,900 UNYREIS
- 2026-03-21 Listed $215,000 UNYREIS
- 2021-08-19 Pending — UNYREIS
- 2021-08-13 Listing Removed — UNYREIS
- 2021-08-09 Listed $109,900 UNYREIS
- 2020-12-29 Listing Removed — UNYREIS
- 2020-12-07 Contingent — UNYREIS
- 2020-11-16 Price Changed $114,900 UNYREIS
- 2020-10-27 Listed $119,900 UNYREIS
- 2019-01-15 Price Changed $99,900 UNYREIS
- 2019-01-15 Listing Removed — UNYREIS
- 2018-10-16 Listed $109,900 UNYREIS
- 2006-10-12 Sold (Public Records) $30,000 Public Records
Property tax history
+2.5%/yrLatest (2025): $1,252 · +0.0% YoY. Source: county tax records.
Cash-flow waterfall
monthlySold comps — $/sqft
last 12 mo · ≤1 miLoading sold comps…