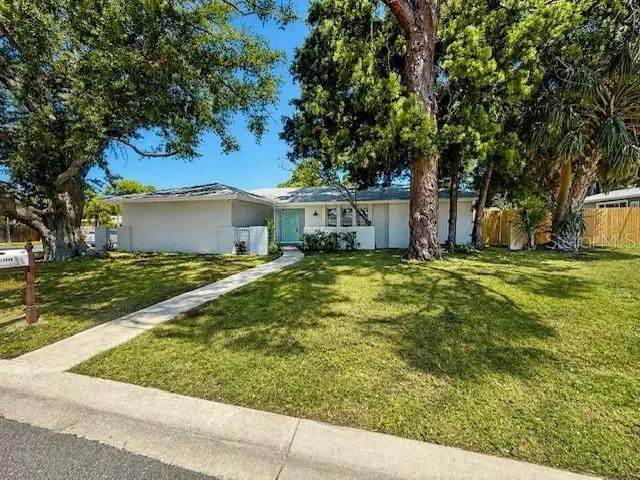
13999 80th Ave · Seminole, FL
Flood risk 3/10 · Minor
- FEMA flood zone
- X (unshaded)
- Chance of flooding over 30 yrs
- 0.1%
- Est. flood insurance / yr
- $507 – $1,088
Fire risk 1/10 · Minimal
- Est. fire insurance / yr
- $947 – $1,759
Heat risk 10/10 · Severe
- Hot days now (above 107°F)
- 8 days/yr
- Hot days in 30 yrs
- 30 days/yr
Wind risk 10/10 · Severe
- Chance of severe wind over 30 yrs
- 99.0%
Air-quality risk 3/10 · Minor
- Unhealthy air days now
- 2 days/yr
- Unhealthy air days in 30 yrs
- 2 days/yr
Risk factors via First Street. Map © Google.
Why this score? — see what drove the D grade
The composite is a weighted blend of 9 inputs, each scored 0–100. Each bar is that input's sub-score; the figure is the points it added to the 100-point composite (weight × sub-score).
- Cash flow +12.5/30.0
- ARV discount +10.1/15.0
- Livability +4.4/5.0
- Schools +4.3/10.0
- DSCR +3.7/10.0
- 1% rule +3.6/10.0
- Rent growth +2.5/5.0
- Condition / age +2.5/5.0
- Appreciation +0.0/10.0
$479,900
🖨 Deal sheet 📄 Offer letter ✓ Due diligence
Listing remarks
Under contract-accepting backup offers. WOW! Just a short walk to the beach! This updated 2-bedroom home with a bonus room (possible 3rd bedroom) sits on an oversized corner lot and features a split bedroom plan for added privacy. The primary suite includes an en suite bath and walk-in closet. The home offers a spacious layout with separate living and dining areas, plus a large family/bonus room. The renovated kitchen includes quartz countertops, stainless steel appliances, new cabinetry, and a breakfast bar. Recent updates include new tile flooring throughout, fresh paint inside and out, new HVAC, and a new water heater. Indoor laundry with new washer and dryer and utility sink. Large scre
Key facts
- Oversized corner lot
- Quartz countertops
- Walk-in closet
Tags
Property features AI
Finance
- HOA & community: Has HOA (no association fee requirement); Pets allowed: cats and dogs permitted
Exterior
- Parking: Attached garage; 2-car garage; Garage door opener; Garage faces side
- Utilities: Public water connected; Public sewer; Electricity connected; Sewer connected; Water connected
- Home design: Single family residence; Residential property; One story; Faces south
- Construction: Block and stucco construction; Shingle roof; Slab foundation; Built on one level
- Exterior features: Covered patio; Porch; Screened porch; Exterior lighting; Wood fencing; Patio; Sliding doors
Interior
- Kitchen: Dishwasher; Disposal; Microwave; Range; Refrigerator; Stone counters
- Bedrooms: 2 bedrooms
- Flooring: Ceramic tile
- Bathrooms: 2 full bathrooms
- Heating & cooling: Central heating (electric); Central air; Attic fan
- Interior features: Ceiling fans; Split bedroom floor plan; Stone counters; Window treatments; Aluminum window frames; Blinds; Curtain rods; Sliding doors; Attic; Bonus room; Family room; Inside utility
- Laundry & utility: Washer; Dryer; Inside laundry room; Electric water heater
Neighborhood map
What this means for you Summary
Snapshot
- This is a 2-bed/2.0-bath single-family listed at $480k.
Deal economics
- At list price, monthly cash flow is $-72 ($-870/yr) — negative.
- To cash-flow at today's rent, offer at most $467k (2.7% below list).
- To meet the 1% rule (rent ≥ 1% of price), the offer needs to be $413k (14.0% below list).
- Recommended offer: $413k (14.0% below list) — sets the bar for 1% rule.
- Cap rate 6.1% vs local median 3.8% in Seminole — top-decile yield for the area; either an underpriced asset or a hidden risk that comps aren't pricing in. Stress-test before assuming the spread holds.
Location & tenants
- Location reads 88/100 on livability (#5 in FL, #174 nationally) — a professional / high-income tenant draw. Strengths: commute A+, housing A+, health & safety A+.
- Pinellas (suburban): math 51% / reading 51% proficiency, ranked #31 of 73 in FL (top 42%) — acceptable for families but not a draw, mixed tenant base, ~2y average lease.
- Zoned schools: Bauder Elementary School (math 80% / reading 73%, grade A, #185 of 2,144 statewide, top 9%, 644 students, 28% FRL); Seminole High School (math 26% / reading 47%, grade F, #351 of 667 statewide, top 54%, 1,546 students, 39% FRL).
- Market conditions: 146 active listings in the ZIP; 36 comparable units currently listed for rent nearby; rentals at typical pace (median 20d on market — plan ~3-4 weeks tenant-placement turnaround); 2,676 units permitted in Pinellas County in 2024 (1,422 in 5+ unit buildings).
Forward outlook
- Local home prices are declining (-3.0%/yr); year-one equity from $3k of loan paydown is wiped out by about $14k of value loss. Plan a longer hold.
- Pinellas County population projected at +14% by 2050 — modest demand growth; plan on rents tracking national, not racing it.
Negotiation context
- It's been on market 27 days — a 2% lower offer ($473k) is reasonable based on typical stale-listing flexibility.
- Current owner paid $285k; list at $480k implies a 68% gain — meaningful room to come down on a strong offer.
Risks & watch-outs
- Climate carrying-cost: severe wind risk, 99% chance of damaging wind over 30y; extreme-heat days projected 8→30/yr by 2055 (HVAC capex compounding) — expect insurance premiums to compound above CPI over the hold.
Questions for the listing agent
- What do current leases actually rent for vs. the listed asking? Can we see a recent rent roll and the last 12 months of T-12 income?
- Built in 1973 — when were the roof, HVAC, electrical panel, plumbing, and water heater last replaced?
- Is there a deadline driving the sale (1031 exchange, divorce, estate, relocation)? That informs how much negotiation room exists.
- Schools are B-rated — typically a magnet for longer-tenancy family renters. What's the average tenant stay here, and is there a school-zone premium baked into asking?
- The area grade is low — what's the realistic commute time and amenity access for the typical tenant pool here? Any planned neighborhood developments (good or bad) we should know about?
- What's the average days-on-market for RENTAL listings here right now (not sales)? A rising rental-DOM trend means longer vacancies and softer asking-rent achievability than the comps imply.
- What's the recent tenant-quality profile in this submarket — average credit score on applications, eviction rate, late-payment / NSF rate, and stable-employment percentage? A property-management company in the area should have these aggregated.
- How much new for-sale + rental construction is in the pipeline within 1–3 miles? Heavy new supply typically softens prices + rents 12–24 months out; constrained supply supports both.
Investment metrics
- 1% rule
- 0.86% ✗
- Cap rate
- 6.11%
- Cash-on-cash
- -0.65%
- DSCR
- 0.97
- GRM
- 9.7
CMA / ARV
- ARV (on-the-fly)
- $509,078
- Comps found
- 12
Show comp detail 12 sales within ~0.75 mi
| Address | Dist | Beds/Ba | Sqft | Sold | Price | $/sf | Match |
|---|---|---|---|---|---|---|---|
| 14128 87th Ave | 0.48mi | 2/2.0 | 1,576 (+2%) | 3mo | $424,000 | $269 | 71 |
| 13878 Oak Forest Blvd N | 0.14mi | 3/2.0 (+1) | 1,614 (+5%) | 12mo | $610,000 | $378 | 70 |
| 8253 137th Ln | 0.28mi | 3/2.0 (+1) | 1,536 (-0%) | 15mo | $580,000 | $378 | 69 |
| 14157 87th Ave N | 0.52mi | 2/2.0 | 1,587 (+3%) | 7mo | $370,000 | $233 | 64 |
| 8667 139th St | 0.45mi | 3/2.0 (+1) | 1,606 (+4%) | 8mo | $570,000 | $355 | 60 |
| 7587 132nd Way | 0.66mi | 3/2.0 (+1) | 1,584 (+3%) | 0mo | $727,000 | $459 | 59 |
| 13807 83rd Pl | 0.30mi | 3/2.0 (+1) | 1,648 (+7%) | 13mo | $510,000 | $309 | 58 |
| 14250 86th Ter | 0.49mi | 2/2.0 | 1,444 (-6%) | 16mo | $450,000 | $312 | 54 |
| 13511 87th Pl | 0.66mi | 3/2.0 (+1) | 1,509 (-2%) | 16mo | $500,000 | $331 | 48 |
| 14052 89th Ave | 0.53mi | 2/2.0 | 1,767 (+15%) | 5mo | $410,000 | $232 | 46 |
| 13612 87th Ave | 0.55mi | 2/2.0 | 1,334 (-13%) | 13mo | $500,000 | $375 | 41 |
| 13313 86th Ave | 0.71mi | 3/2.0 (+1) | 1,698 (+10%) | 9mo | $395,000 | $233 | 37 |
Match score weights: distance 35% · size 25% · config 20% · recency 20%. Top-matched comps best support the ARV.
Projected returns pro-forma
-3.0% appreciation · 3.0% rent growth · sell at horizon
- IRR
- -17.3%
- Equity multiple
- 0.39×
- Total profit
- $-82,310
- Equity at exit
- $71,555
- IRR
- -9.3%
- Equity multiple
- 0.42×
- Total profit
- $-77,329
- Equity at exit
- $41,493
Cash invested: $134,372 (down + closing). Projections, not guarantees.
Landlord ↔ Tenant lean methodology
- Overall (STATE)
- 87 Strongly Landlord-Friendly
- State Florida
- 87 Strongly Landlord-Friendly · R+3
- County
- — inherits STATE
- City
- — inherits STATE
ZIP-level market 33776
- Active inventory
- 146
- Price-to-rent
- 9.7×
Monthly cashflow live
- Estimated rent
- $4,125 high interval (Pro) →
- Mortgage (P&I)
- −$2,517
- Tax from tax record
- −$615 /mo · $7,376/yr
- Insurance
- −$200
- HOA
- −$0
- Vacancy / Maint / Mgmt
- −$866
- Net cashflow
- $-72
Break-even live
UW: 25.0% down · 7.5% · 30yr · 1.5% tax · 5.0% vac · 8.0% maint · 8.0% mgmt
Financing live
Cash to close
- Down payment
- $119,975
- Closing costs
- $14,397
- Reserves months
- —
- Total cash needed
- —
Loan-product check · same deal, 3 products live
Conventional
25% down · 7.5% · 30yr
- Down + closing
- —
- Monthly P&I
- —
- Monthly cashflow
- —
- DSCR
- —
- Eligible?
- —
Personal DTI + credit; lowest rate.
DSCR
20% down · 8.5% · 30yr
- Down + closing
- —
- Monthly P&I
- —
- Monthly cashflow
- —
- DSCR
- —
- Eligible?
- —
No personal income docs; deal must DSCR.
Hard money
10% down · 12.0% · 12mo
- Down + closing
- —
- Monthly P&I
- —
- Monthly cashflow
- —
- DSCR
- —
- Eligible?
- —
Short-term bridge; refi at stabilization.
Rent comps 36 comps
| Address | Beds | Baths | Sqft | Rent | $/sqft | DOM | Units | Dist |
|---|---|---|---|---|---|---|---|---|
| 13788 84th Ter Seminole, FL | 3.0 | 2.0 | 1330 | $2,850 | $2.14 | 24d | 1 | 0.28mi |
| 19111 Vista Bay Dr Indian Shores, FL | 2.0 | 2.0 | 1265 | $4,550 | $3.60 | 3d | 2 | 0.53mi |
| 19111 Vista Bay Dr Indian Shores, FL | 2.0 | 2.0 | 1310 | $4,200 | $3.21 | 24d | 3 | 0.53mi |
| 19111 Vista Bay Dr #612 Indian Shores, FL | 2.0 | 2.0 | 1265 | $6,000 | $4.74 | 2d | 1 | 0.53mi |
| 13610 87th Pl Seminole, FL | 3.0 | 2.0 | 1216 | $2,195 | $1.81 | 16d | 1 | 0.54mi |
| 14414 91st Ave Seminole, FL | 3.0 | 2.5 | 2083 | $8,000 | $3.84 | 24d | 1 | 0.73mi |
| 9262 140th Ln Seminole, FL | 2.0 | 2.0 | 1402 | $4,500 | $3.21 | 4d | 1 | 0.80mi |
| 18111 1st St E Redington Shores, FL | 3.0 | 3.0 | 1556 | $2,800 | $1.80 | 4d | 1 | 0.88mi |
| 12932 81st Ave Seminole, FL | 3.0 | 2.0 | 1207 | $2,600 | $2.15 | 24d | 1 | 0.90mi |
| 9433 Harbor Greens Way #504 Seminole, FL | 2.0 | 2.0 | 1200 | $2,500 | $2.08 | 4d | 1 | 0.91mi |
| 17980 Gulf Blvd Unit 1546267P Redington Shores, FL | 2.0 | 2.0 | 1399 | $7,517 | $5.37 | 20d | 1 | 0.98mi |
| 17980 Gulf Blvd #402 Redington Shores, FL | 2.0 | 2.0 | 1220 | $8,500 | $6.97 | 24d | 1 | 0.98mi |
| 19610 Gulf Blvd #101 Indian Shores, FL | 2.0 | 2.0 | 1100 | $3,000 | $2.73 | 24d | 1 | 1.07mi |
| 9652 Commodore Dr Seminole, FL | 3.0 | 2.0 | 1680 | $2,800 | $1.67 | 10d | 1 | 1.07mi |
| 17920 Gulf Blvd #502 Redington Shores, FL | 1.0 | 1.5 | 1060 | $3,500 | $3.30 | 2d | 1 | 1.08mi |
| 17920 Gulf Blvd #205 Redington Shores, FL | 2.0 | 2.0 | 1330 | $3,300 | $2.48 | 20d | 1 | 1.08mi |
| 17920 Gulf Blvd #1401 Redington Shores, FL | 2.0 | 2.0 | 1345 | $3,495 | $2.60 | 24d | 1 | 1.08mi |
| 17920 Gulf Blvd #1205 Redington Shores, FL | 2.0 | 2.0 | 1330 | $6,000 | $4.51 | 14d | 1 | 1.08mi |
| 17920 Gulf Blvd #1203 Redington Shores, FL | 2.0 | 2.0 | 1330 | $4,000 | $3.01 | 24d | 1 | 1.08mi |
| 17900 Gulf Blvd Unit 1545821P Redington Shores, FL | 2.0 | 2.0 | 1162 | $3,873 | $3.33 | 16d | 1 | 1.09mi |
| 17900 Gulf Blvd Unit 9C Redington Shores, FL | 2.0 | 2.0 | 1165 | $5,500 | $4.72 | 24d | 1 | 1.11mi |
| 17900 Gulf Blvd Unit 2E Redington Shores, FL | 2.0 | 2.0 | 1165 | $4,000 | $3.43 | 20d | 1 | 1.11mi |
| 17900 Gulf Blvd Unit 11C Redington Shores, FL | 2.0 | 2.0 | 1165 | $4,500 | $3.86 | 4d | 1 | 1.11mi |
| 17900 Gulf Blvd Unit 1B Redington Shores, FL | 2.0 | 2.0 | 1165 | $3,500 | $3.00 | 24d | 1 | 1.11mi |
| 17900 Gulf Blvd Unit 16C Redington Shores, FL | 3.0 | 3.0 | 1789 | $3,450 | $1.93 | 7d | 1 | 1.11mi |
| 17900 Gulf Blvd Unit 12C Redington Shores, FL | 2.0 | 2.0 | 1165 | $3,600 | $3.09 | 20d | 1 | 1.11mi |
| 17900 Gulf Blvd Redington Shores, FL | 2.0 | 2.0 | 1165 | $4,000 | $3.43 | 4d | 1 | 1.12mi |
| 17900 Gulf Blvd Unit 18-C Redington Shores, FL | 3.0 | 2.5 | 1935 | $4,200 | $2.17 | 24d | 1 | 1.12mi |
| 12644 81st Ter Seminole, FL | 3.0 | 2.0 | 1426 | $2,590 | $1.82 | 24d | 1 | 1.13mi |
| 17735 Gulf Blvd #204 Redington Shores, FL | 3.0 | 3.0 | 1995 | $5,500 | $2.76 | 24d | 1 | 1.32mi |
| 17735 Gulf Blvd #501 Redington Shores, FL | 3.0 | 3.0 | 1995 | $4,995 | $2.50 | 24d | 1 | 1.32mi |
| 326 176th Avenue Cir Redington Shores, FL | 3.0 | 2.0 | 1980 | $6,500 | $3.28 | 24d | 1 | 1.37mi |
| 13607 101st Ter Seminole, FL | 2.0 | 2.0 | 1503 | $3,850 | $2.56 | 4d | 1 | 1.37mi |
| 19829 Gulf Blvd Indian Shores, FL | 2.0 | 2.0 | 1400 | $3,350 | $2.39 | 7d | 1 | 1.46mi |
| 17580 Gulf Blvd Redington Shores, FL | 2.0 | 2.0 | 1116 | $5,150 | $4.61 | 24d | 4 | 1.47mi |
| 17580 Gulf Blvd Redington Shores, FL | 2.0 | 2.0 | 1116 | $6,125 | $5.49 | 19d | 3 | 1.47mi |
Listing history 4 events
-
2026-05-22status Pending
-
2026-04-25$479,900 Active
-
2025-10-06soldstatus $285,000
-
1983-08-01soldstatus $76,500
ⓘ Source: listings_history table (triggers on properties + properties_extension) + one-shot
backfill from property_details.listing_events for pre-trigger history.
Tax reassessment forecast FL · Resets to sale price
- Current annual tax
- $7,376 · $615/mo
- Projected year-2 tax
- $7,376 · $615/mo
- Expected delta
- $0/yr ($0/mo · 0.0%)
ⓘ Screening estimate from a state-policy table — verify with the county assessor before closing.
Climate risk First Street
- Flood 3/10 Moderate FEMA zone X (unshaded) · 10% chance over 30 yrs
- Wildfire 1/10 Low
- Heat 10/10 Extreme 8 d/yr ≥107°F today · 30 d/yr by 30 yrs out
- Wind 10/10 Extreme 99% chance of damaging wind over 30 yrs
- Air quality 3/10 Moderate 2 unhealthy d/yr today · 2 by 30 yrs out
Nearby sold comps map
Loading sold comps map…
Walkable amenities ~0.75 mi
Loading nearby amenities…
Taxation est. · year 1
- Rental income
- $49,500
- − Mortgage interest
- −$26,882
- − Property taxes
- −$7,376
- − Insurance
- −$2,400
- − Repairs & maintenance
- −$3,960
- − Management
- −$3,960
- − Depreciation
- −$13,961
- Taxable loss
- −$9,038
- Est. tax savings @ 24.0%
- +$2,169
- After-tax cash flow
- $1,299/yr
For passive investors: Depreciation is non-cash, so a rental often shows a tax loss while cash-flowing — sheltering income. Rental losses are passive: they offset passive income freely, and up to $25,000/yr can offset ordinary (W-2) income if you actively participate and your MAGI is under $100k (phasing out to $0 by $150k); unused losses carry forward. On sale, claimed depreciation is recaptured at up to 25%, and gains may owe capital-gains tax (a 1031 exchange can defer both). Figures are a year-1 estimate at your 24.0% rate — not tax advice; consult a CPA.
Schools (NCES district)
- District
- Pinellas
- NCES district ID
- 1201560
- Math proficiency
- 51% ▼ -5.00%
- Reading proficiency
- 51% ▼ -3.00%
- Median HH income
- $46,270
- Composite
- 43.27/100
- National rank
- #3046
- State rank
- #31 of 73 in FL
Livability — Seminole
- Score
- 88/100
- State rank
- #5
- US rank
- #174
Category grades
Schools grade is shown separately in the Schools card above.
Census & demographics
- City population
- 42,315
- Population (ZIP)
- 12,711
Population outlook (Pinellas County) Hauer SSP2
- Today (2025)
- 1,027,532 people
- By 2030
- 1,063,586 · +3.5%
- By 2040
- 1,125,020 · +9.5%
- By 2050
- 1,168,637 · +13.7%
- By 2075
- 1,265,188 · +23.1%
- By 2100
- 1,260,357 · +22.7%
Race, ethnicity, and origin ACS 2023
- Neighborhood character
- Predominantly White (84%)
- Race & ethnicity
- White 84% Hispanic / Latino 7% Two or more races 7% Asian 2% Black 2%
- Hispanic origin (detail)
- Mexican 3%
- Common ancestry
- Romanian 7% Lithuanian 3% Slovak 1%
- Foreign-born
- 9% · Canada, Jamaica
- Languages at home
- 89% English-only · Other Indo-European 4% Russian/Polish/Slavic 3% Spanish 2%
Political lean MEDSL · Pinellas
- 2024 margin
- Lean R (+5.2) · D 46.9% · R 52.1%
- 2008→2024 swing
- -13.5pp toward R · 2008: 8.3pp · 2024: -5.2pp
- All cycles
- 2024: R+5.2 2020: D+0.2 2016: R+1.1 2012: D+5.6 2008: D+8.3
Not yet ingested
- Civics
- —
Market trends
- HPI YoY
- ▼ -455.42%
- Current HPI
- 337.3149
- Rent YoY
- —
- Metro
- —
- State GDP YoY
- ▲ 3.28%
- F500 in state
- 36
Industry mix (Fortune 500 HQ in FL)
| Industry | F500 HQs | Revenue |
|---|---|---|
| Industrial Technology | 2 | $29B |
|
||
| Insurance | 2 | $17B |
|
||
| Retail | 1 | $60B |
|
||
| Technology Distribution | 1 | $58B |
|
||
| Homebuilding | 1 | $35B |
|
||
| Technology Manufacturing | 1 | $35B |
|
||
Price history
+527.3% since first listed4 events — show timeline
- 2026-05-22 Pending — Stellar MLS as Distributed by MLS Grid
- 2026-04-25 Listed $479,900 Stellar MLS as Distributed by MLS Grid
- 2025-10-06 Sold (Public Records) $285,000 Public Records
- 1983-08-01 Sold (Public Records) $76,500 Public Records
Property tax history
+9.0%/yrLatest (2025): $7,376 · +9.5% YoY. Source: county tax records.
Cash-flow waterfall
monthlySold comps — $/sqft
last 12 mo · ≤1 miLoading sold comps…