 Multi-family
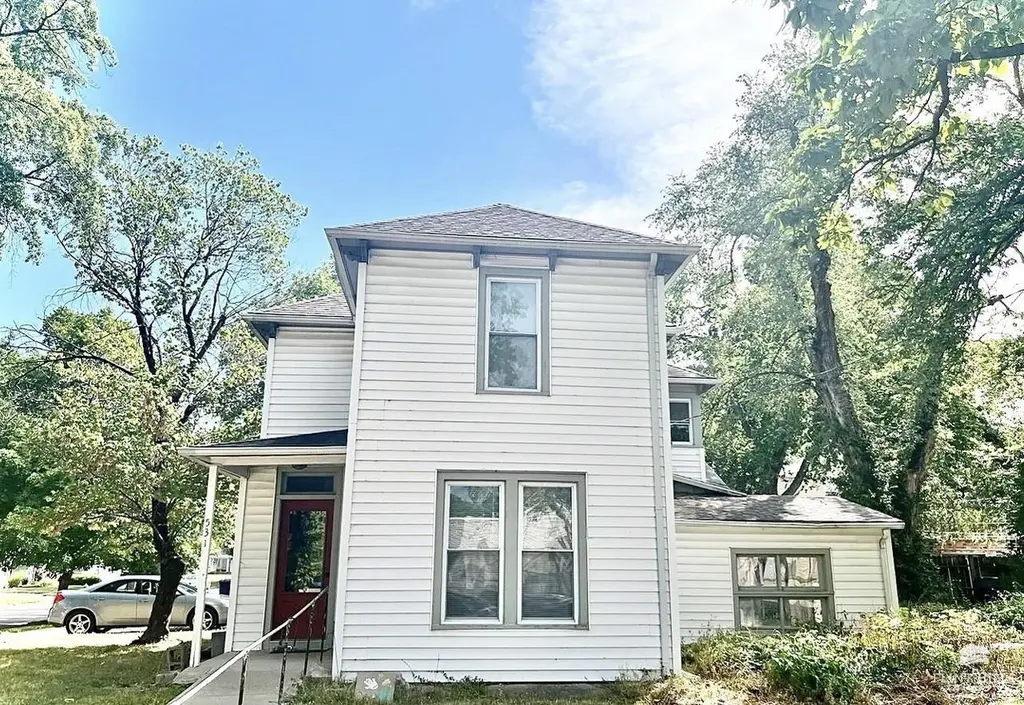
531 Osage St · Manhattan, KS
Flood risk 4/10 · Minor
- FEMA flood zone
- X (shaded)
- Chance of flooding over 30 yrs
- 0.2%
- Est. flood insurance / yr
- $473 – $860
Fire risk 4/10 · Minor
- Est. fire insurance / yr
- $1,154 – $2,142
Heat risk 5/10 · Moderate
- Hot days now (above 107°F)
- 7 days/yr
- Hot days in 30 yrs
- 16 days/yr
Wind risk 2/10 · Minimal
- Chance of severe wind over 30 yrs
- —
Air-quality risk 2/10 · Minimal
- Unhealthy air days now
- 2 days/yr
- Unhealthy air days in 30 yrs
- 2 days/yr
Risk factors via First Street. Map © Google.
Why this score? — see what drove the B grade
The composite is a weighted blend of 9 inputs, each scored 0–100. Each bar is that input's sub-score; the figure is the points it added to the 100-point composite (weight × sub-score).
- Cash flow +30.0/30.0
- 1% rule +10.0/10.0
- DSCR +10.0/10.0
- ARV discount +7.5/15.0
- Livability +4.2/5.0
- Rent growth +4.0/5.0
- Schools +3.6/10.0
- Condition / age +2.5/5.0
- Appreciation +0.0/10.0
$150,000
🖨 Deal sheet (PDF) 📄 Offer letter ✓ Due diligence
Multi-family units
County records classify this as Multi-Family (5+ Unit). Listing-text estimate: 1 unit. estimate disagrees with records
5+ unit building — per-unit beds/baths from public records are typically unavailable; the breakdown below (if shown) is an estimate from the listing text.
Key facts
- 6,500 sq ft lot
- Built 1890
- Listed 3 days
Property features AI
Exterior
- Home design: Single-family residence; Two levels
- Construction: Built with unknown construction materials
- Exterior features: Other exterior features; No fencing; No pool
Interior
- Kitchen: Oven, Range, Refrigerator
- Bedrooms: 2 main-level bedrooms
- Bathrooms: 3 full bathrooms
- Heating & cooling: Central air conditioning; Natural gas forced-air heating
- Interior features: Other interior features; Oven, Range, Refrigerator; Basement
Neighborhood map
What this means for you Summary
Snapshot
- This is a 4-bed/3.0-bath multifamily listed at $150k.
Deal economics
- At list price, monthly cash flow is $1k ($14k/yr) — positive.
- The deal already cash-flows at list — no discount required.
- Meets the 1% rule at list price ($3k rent vs $150k).
Location & tenants
- Location reads 83/100 on livability (#6 in KS, #979 nationally) — a professional / high-income tenant draw. Strengths: amenities A+, commute A+, cost of living A+; Watch: crime C-, employment C-.
- Manhattan-Ogden (urban): math 39% / reading 46% proficiency, ranked #26 of 169 in KS (top 15%) — families likely to look elsewhere, expect single-tenant / working-renter base with shorter leases.
- Zoned schools: Woodrow Wilson Elem (math 37% / reading 52%, grade F, #228 of 684 statewide, top 38%, 219 students, 52% FRL); Dwight D Eisenhower Middle School (math 27% / reading 33%, grade F, #64 of 219 statewide, top 32%, 740 students, 46% FRL); Manhattan High School West/East Campus (math 30% / reading 38%, grade F, #45 of 327 statewide, top 14%, 1,954 students, 35% FRL) — zoned schools average 45% FRL vs 29% district-wide (15 pts higher); higher-poverty schools than district average — tighter screening recommended.
- Market conditions: Rents rising fast (+6.0%/yr); 341 active listings in the ZIP; 132 units permitted in Riley County in 2024 (35 in 5+ unit buildings).
- At $2,912/mo this rent would consume 64% of the median local household income ($55k/yr) (locally 3089% of renters already pay >50% of income on rent) — very limited rent-growth headroom before tenants either downsize or default.
Forward outlook
- Local home prices are declining (-3.0%/yr); year-one equity from $1k of loan paydown is wiped out by about $4k of value loss. Plan a longer hold.
- Riley County population projected at +30% by 2050 — long-run rental-demand tailwind backs the buy-and-hold thesis.
- At projected returns (-3.0% appreciation + 6.0% rent growth), your $42k cash investment doubles in ~4 years — after that, you're playing with house money.
Negotiation context
- Only 3 days on market — expect competitive offers; lowballing is unlikely to land.
- 2 sale attempts since 3y ago with the ask held roughly flat each time — persistent listings suggest the price (not the market) is what's stuck; bring a comps-based counter.
- Current owner paid $90k; list at $150k implies a 67% gain — meaningful room to come down on a strong offer.
Risks & watch-outs
- Watch-outs: built in 1890 — expect roof / HVAC / electrical / plumbing capex.
- Climate carrying-cost: extreme-heat days projected 7→16/yr by 2055 (HVAC capex compounding) — expect insurance premiums to compound above CPI over the hold.
Questions for the listing agent
- Built in 1890 — when were the roof, HVAC, electrical panel, plumbing, and water heater last replaced?
- Is there a deadline driving the sale (1031 exchange, divorce, estate, relocation)? That informs how much negotiation room exists.
- What's the average days-on-market for RENTAL listings here right now (not sales)? A rising rental-DOM trend means longer vacancies and softer asking-rent achievability than the comps imply.
- What's the recent tenant-quality profile in this submarket — average credit score on applications, eviction rate, late-payment / NSF rate, and stable-employment percentage? A property-management company in the area should have these aggregated.
- How much new apartment / multifamily construction is in the pipeline within 1–3 miles? Heavy new supply (>2% of stock underway) typically softens rents 12–24 months out; light construction supports rent growth.
Investment metrics
- 1% rule
- 1.94% ✓
- Cap rate
- 15.93%
- Cash-on-cash
- 34.43%
- DSCR
- 2.53
- GRM
- 4.3
CMA / ARV
No comps found within radius.
Projected returns pro-forma
-3.0% appreciation · 6.02% rent growth · sell at horizon
- IRR
- 33.4%
- Equity multiple
- 2.47×
- Total profit
- $61,645
- Equity at exit
- $22,365
- IRR
- 42.0%
- Equity multiple
- 5.59×
- Total profit
- $192,640
- Equity at exit
- $12,969
Cash invested: $42,000 (down + closing). Projections, not guarantees.
Landlord ↔ Tenant lean methodology
- Overall (STATE)
- 83 Strongly Landlord-Friendly
- State Kansas
- 83 Strongly Landlord-Friendly · R+10
- County
- — inherits STATE
- City
- — inherits STATE
ZIP-level market 66502
- Rents YoY
- 6.0%
- Active inventory
- 341
- Price-to-rent
- 12.9×
Monthly cashflow live
- Estimated rent
- $2,912 medium interval (Pro) →
- Mortgage (P&I)
- −$787
- Tax from tax record
- −$246 /mo · $2,955/yr
- Insurance
- −$62
- HOA
- −$0
- Vacancy / Maint / Mgmt
- −$612
- Net cashflow
- $1,205
Break-even live
Sensitivity live
| Price | -10% $1,290 | -5% $1,248 | +0% $1,205 | +5% $1,163 | +10% $1,120 |
|---|---|---|---|---|---|
| Rent | -10% $975 | -5% $1,090 | +0% $1,205 | +5% $1,320 | +10% $1,435 |
| Rate | -1.0pp $1,281 | -0.5pp $1,243 | base $1,205 | +0.5pp $1,166 | +1.0pp $1,127 |
3-unit breakdown (identical units grouped — click to expand)
| Units | Beds | Baths | Est. rent |
|---|---|---|---|
| 3× units | 2 | 1 | $2,913 |
| #1 | 2 | 1 | $971 |
| #2 | 2 | 1 | $971 |
| #3 | 2 | 1 | $971 |
| Total (3 units) | $2,912 | ||
UW: 25.0% down · 7.5% · 30yr · 1.5% tax · 5.0% vac · 8.0% maint · 8.0% mgmt
Financing live
Cash to close
- Down payment
- $37,500
- Closing costs
- $4,500
- Reserves months
- —
- Total cash needed
- —
Loan-product check · same deal, 3 products live
Conventional
25% down · 7.5% · 30yr
- Down + closing
- —
- Monthly P&I
- —
- Monthly cashflow
- —
- DSCR
- —
- Eligible?
- —
Personal DTI + credit; lowest rate.
DSCR
20% down · 8.5% · 30yr
- Down + closing
- —
- Monthly P&I
- —
- Monthly cashflow
- —
- DSCR
- —
- Eligible?
- —
No personal income docs; deal must DSCR.
Hard money
10% down · 12.0% · 12mo
- Down + closing
- —
- Monthly P&I
- —
- Monthly cashflow
- —
- DSCR
- —
- Eligible?
- —
Short-term bridge; refi at stabilization.
Listing history 7 events
-
2026-05-13status Pending
-
2026-05-10$150,000 Active
-
2023-10-06historical $660
-
2023-08-31$660
-
2004-02-01soldstatus $90,000
-
2002-05-01soldstatus $66,000
-
1997-03-01soldstatus $65,000
ⓘ Source: listings_history table (triggers on properties + properties_extension) + one-shot
backfill from property_details.listing_events for pre-trigger history.
Tax reassessment forecast KS · Resets to sale price
- Current annual tax
- $2,955 · $246/mo
- Projected year-2 tax
- $2,955 · $246/mo
- Expected delta
- $0/yr ($0/mo · 0.0%)
ⓘ Screening estimate from a state-policy table — verify with the county assessor before closing.
Climate risk First Street
- Flood 4/10 Moderate FEMA zone X (shaded) · 20% chance over 30 yrs
- Wildfire 4/10 Moderate
- Heat 5/10 Major 7 d/yr ≥107°F today · 16 d/yr by 30 yrs out
- Wind 2/10 Low
- Air quality 2/10 Low 2 unhealthy d/yr today · 2 by 30 yrs out
Nearby sold comps map
Loading sold comps map…
Walkable amenities ~0.75 mi
Loading nearby amenities…
Taxation est. · year 1
- Rental income
- $34,944
- − Mortgage interest
- −$8,402
- − Property taxes
- −$2,955
- − Insurance
- −$750
- − Repairs & maintenance
- −$2,796
- − Management
- −$2,796
- − Depreciation
- −$4,364
- Taxable income
- $12,882
- Est. tax owed @ 24.0%
- −$3,092
- After-tax cash flow
- $11,370/yr
For passive investors: Depreciation is non-cash, so a rental often shows a tax loss while cash-flowing — sheltering income. Rental losses are passive: they offset passive income freely, and up to $25,000/yr can offset ordinary (W-2) income if you actively participate and your MAGI is under $100k (phasing out to $0 by $150k); unused losses carry forward. On sale, claimed depreciation is recaptured at up to 25%, and gains may owe capital-gains tax (a 1031 exchange can defer both). Figures are a year-1 estimate at your 24.0% rate — not tax advice; consult a CPA.
Schools (NCES district)
- District
- Manhattan-Ogden
- NCES district ID
- 2009180
- Math proficiency
- 39% ▼ -1.00%
- Reading proficiency
- 46% ▲ 1.00%
- Median HH income
- $44,001
- Composite
- 35.97/100
- National rank
- #4795
- State rank
- #26 of 169 in KS
Livability — Manhattan
- Score
- 83/100
- State rank
- #6
- US rank
- #979
Category grades
Schools grade is shown separately in the Schools card above.
Census & demographics
- Census place
- Manhattan, KS
- County
- Riley County · 62,662 people
- City population
- 60,966
- Metro
- Manhattan, KS
- Population (ZIP)
- 43,693
- Household income
- $54,833
- Rent vs Own
- Severe rent burden
- 3089.0
Population outlook (Riley County) Hauer SSP2
- Today (2025)
- 83,656 people
- By 2030
- 89,075 · +6.5%
- By 2040
- 99,100 · +18.5%
- By 2050
- 109,146 · +30.5%
- By 2075
- 134,178 · +60.4%
- By 2100
- 153,653 · +83.7%
Race, ethnicity, and origin ACS 2023
- Neighborhood character
- Predominantly White (78%)
- Race & ethnicity
- White 78% Hispanic / Latino 9% Two or more races 8% Black 4% Asian 3% Native American 1%
- Hispanic origin (detail)
- Mexican 6%
- Common ancestry
- Slovak 3% Italian 3% Lithuanian 2%
- Foreign-born
- 8% · Canada, China
- Languages at home
- 91% English-only · Spanish 5% Other Indo-European 2% Chinese 1%
Political lean MEDSL · Riley
- 2024 margin
- Toss-up / Even · D 49.6% · R 47.8% · Other 2.5%
- 2008→2024 swing
- +8.8pp toward D · 2008: -7.0pp · 2024: 1.8pp
- All cycles
- 2024: D+1.8 2020: D+3.2 2016: R+4.5 2012: R+12.7 2008: R+7.0
Not yet ingested
- Civics
- —
Market trends
- HPI YoY
- ▼ -283.54%
- Current HPI
- 172.7795
- Rent YoY
- ▲ 6.02%
- Metro
- Manhattan, KS
- State GDP YoY
- —
- F500 in state
- 0
Price history
+130.8% since first listed7 events — show timeline
- 2026-05-13 Pending — FHAOR as distributed by MLS GRID
- 2026-05-10 Listed $150,000 FHAOR as distributed by MLS GRID
- 2023-10-06 Rental Removed $660 APPFOLIO
- 2023-08-31 Listed for Rent $660 APPFOLIO
- 2004-02-01 Sold (Public Records) $90,000 Public Records
- 2002-05-01 Sold (Public Records) $66,000 Public Records
- 1997-03-01 Sold (Public Records) $65,000 Public Records
Property tax history
+4.4%/yrLatest (2025): $2,955 · +11.9% YoY. Source: county tax records.
Cash-flow waterfall
monthlySold comps — $/sqft
last 12 mo · ≤1 miLoading sold comps…