 Multi-family
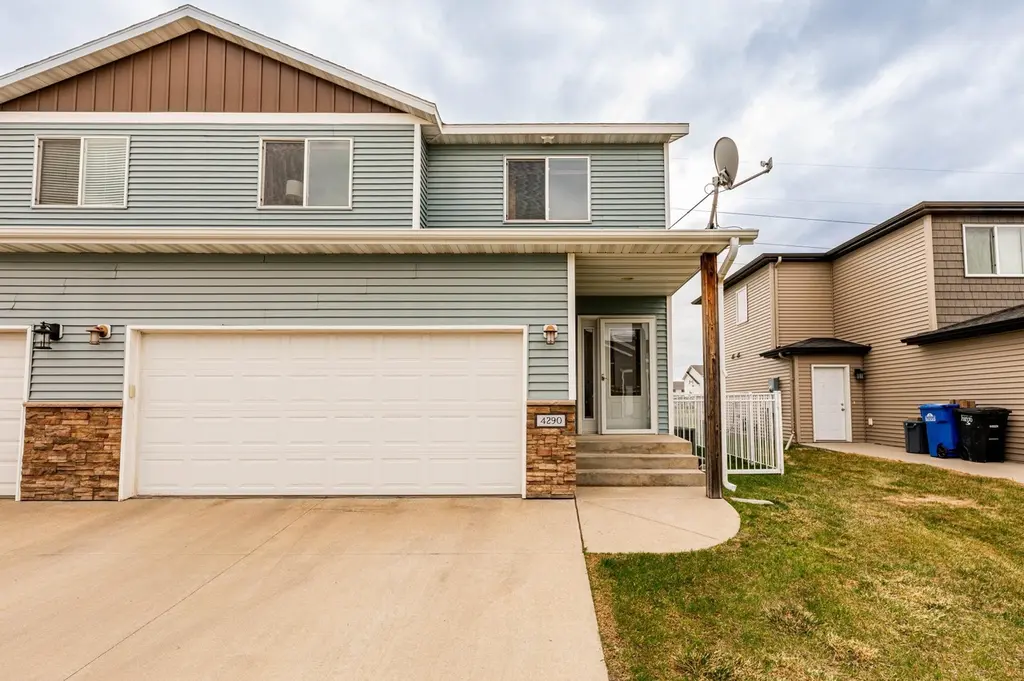
4290 Estate Dr S · Fargo, ND
Flood risk 4/10 · Minor
- FEMA flood zone
- X (shaded)
- Chance of flooding over 30 yrs
- 0.24%
- Est. flood insurance / yr
- $473 – $860
Fire risk 1/10 · Minimal
- Est. fire insurance / yr
- $1,289 – $2,393
Heat risk 2/10 · Minimal
- Hot days now (above 98°F)
- 7 days/yr
- Hot days in 30 yrs
- 12 days/yr
Wind risk 2/10 · Minimal
- Chance of severe wind over 30 yrs
- —
Air-quality risk 3/10 · Minor
- Unhealthy air days now
- 3 days/yr
- Unhealthy air days in 30 yrs
- 3 days/yr
Risk factors via First Street. Map © Google.
Why this score? — see what drove the D+ grade
The composite is a weighted blend of 9 inputs, each scored 0–100. Each bar is that input's sub-score; the figure is the points it added to the 100-point composite (weight × sub-score).
- Cash flow +17.5/30.0
- ARV discount +7.5/15.0
- DSCR +5.5/10.0
- Livability +4.2/5.0
- 1% rule +4.1/10.0
- Rent growth +3.8/5.0
- Schools +3.7/10.0
- Condition / age +2.5/5.0
- Appreciation +0.0/10.0
$270,000
🖨 Deal sheet 📄 Offer letter ✓ Due diligence
Multi-family units
County records classify this as Multi-Family (2-4 Unit). Listing-text estimate: 1 unit. estimate disagrees with records
Listing remarks MLS
Awesome 2 story twin home, 3 bedroom 4 bath with maple flooring, maple cabinets with soft-close drawers, granite countertops throughout, stainless steel appliances, kitchen island, family room with wet bar, surround sound, solid doors, tile floors, LOW specials, double vanity in master bath, walk in closet, and NO Backyard neighbors
Key facts
- 3,746 sq ft lot
- 2 garage spots
- Built 2010
Property features AI
Finance
- HOA & community: Osgood 1st Addition HOA; Annual HOA fee of $200 (includes snow removal)
Exterior
- Parking: Attached 2-car garage
- Utilities: City water connected; City sewer connected; Natural gas
- Home design: Residential attached property; Two levels; Main entry on the main level
- Construction: Poured concrete foundation; Foundation area approximately 566; Built with vinyl siding
- Exterior features: Vinyl exterior; Full yard fencing; Lot dimensions approximately 33 x 114
Interior
- Kitchen: Kitchen on the main level
- Bedrooms: 3 bedrooms (all on the upper level)
- Bathrooms: 2 full baths; 1 three-quarter bath; 1 half bath
- Heating & cooling: Forced air heating; Central air conditioning
- Interior features: Full basement; Dining room; Living room; Family room; Utility room
- Laundry & utility: Laundry on the upper level
Neighborhood map
What this means for you Summary
Snapshot
- This is a 3-bed/4.0-bath multifamily listed at $270k.
Deal economics
- At list price, monthly cash flow is $207 ($2k/yr) — positive.
- The deal already cash-flows at list — no discount required.
- To meet the 1% rule (rent ≥ 1% of price), the offer needs to be $245k (9.1% below list).
- Recommended offer: $245k (9.1% below list) — sets the bar for 1% rule.
- Cap rate 7.2% vs local median 2.5% in Fargo — top-decile yield for the area; either an underpriced asset or a hidden risk that comps aren't pricing in. Stress-test before assuming the spread holds.
Location & tenants
- Location reads 85/100 on livability (#1 in ND, #605 nationally) — a professional / high-income tenant draw. Strengths: amenities A+, commute A+, cost of living A+; Watch: crime F.
- West Fargo 6 (suburban): math 41% / reading 42% proficiency, ranked #26 of 53 in ND (top 49%) — families likely to look elsewhere, expect single-tenant / working-renter base with shorter leases.
- Market conditions: Rents rising fast (+5.1%/yr); 358 active listings in the ZIP; 24 comparable units currently listed for rent nearby; rentals leasing fast (median 13d on market — plan ~1-2 weeks tenant-placement turnaround); solid renter incomes; 1,218 units permitted in Cass County in 2024 (410 in 5+ unit buildings).
- This rent runs 34% of the median local income ($86k/yr) — at the standard rent-burdened threshold; future hikes will face affordability resistance.
Forward outlook
- Local home prices are declining (-3.0%/yr); year-one equity from $2k of loan paydown is wiped out by about $8k of value loss. Plan a longer hold.
- Cass County population projected at +69% by 2050 — long-run rental-demand tailwind backs the buy-and-hold thesis.
Negotiation context
- Only 13 days on market — expect competitive offers; lowballing is unlikely to land.
- 2 sale attempts since 10y ago with the ask held roughly flat each time — persistent listings suggest the price (not the market) is what's stuck; bring a comps-based counter.
- Current owner paid $216k; 25% above their basis — modest negotiation headroom, anchor on the comps not their cost.
Questions for the listing agent
- What does the HOA fee cover, when was the last increase, and are there any pending special assessments or reserve-fund shortfalls?
- Is there a deadline driving the sale (1031 exchange, divorce, estate, relocation)? That informs how much negotiation room exists.
- Crime grade is F in this area — have there been break-ins, vandalism, or insurance claims at this property in the last 3 years? What carrier currently insures it and at what premium?
- The area grade is low — what's the realistic commute time and amenity access for the typical tenant pool here? Any planned neighborhood developments (good or bad) we should know about?
- What's the average days-on-market for RENTAL listings here right now (not sales)? A rising rental-DOM trend means longer vacancies and softer asking-rent achievability than the comps imply.
- What's the recent tenant-quality profile in this submarket — average credit score on applications, eviction rate, late-payment / NSF rate, and stable-employment percentage? A property-management company in the area should have these aggregated.
- How much new apartment / multifamily construction is in the pipeline within 1–3 miles? Heavy new supply (>2% of stock underway) typically softens rents 12–24 months out; light construction supports rent growth.
Investment metrics
- 1% rule
- 0.91% ✗
- Cap rate
- 7.21%
- Cash-on-cash
- 3.28%
- DSCR
- 1.15
- GRM
- 9.2
CMA / ARV
No comps found within radius.
Projected returns pro-forma
-3.0% appreciation · 5.13% rent growth · sell at horizon
- IRR
- -8.9%
- Equity multiple
- 0.67×
- Total profit
- $-25,257
- Equity at exit
- $40,258
- IRR
- 3.0%
- Equity multiple
- 1.24×
- Total profit
- $17,793
- Equity at exit
- $23,345
Cash invested: $75,600 (down + closing). Projections, not guarantees.
Landlord ↔ Tenant lean methodology
- Overall (STATE)
- 82 Strongly Landlord-Friendly
- State North Dakota
- 82 Strongly Landlord-Friendly · R+20
- County
- — inherits STATE
- City
- — inherits STATE
ZIP-level market 58104
- Home prices YoY
- -29.6%
- Rents YoY
- 5.1%
- Active inventory
- 358
- Price-to-rent
- 18.3×
Monthly cashflow live
- Estimated rent
- $2,453 high interval (Pro) →
- Mortgage (P&I)
- −$1,416
- Tax from tax record
- −$186 /mo · $2,228/yr
- Insurance
- −$112
- HOA
- −$17
- Vacancy / Maint / Mgmt
- −$515
- Net cashflow
- $207
Break-even live
2-unit breakdown (identical units grouped — click to expand)
| Units | Beds | Baths | Est. rent |
|---|---|---|---|
| 2× units | 2 | 2 | $2,454 |
| #1 | 2 | 2 | $1,227 |
| #2 | 2 | 2 | $1,227 |
| Total (2 units) | $2,453 | ||
UW: 25.0% down · 7.5% · 30yr · 1.5% tax · 5.0% vac · 8.0% maint · 8.0% mgmt
Financing live
Cash to close
- Down payment
- $67,500
- Closing costs
- $8,100
- Reserves months
- —
- Total cash needed
- —
Loan-product check · same deal, 3 products live
Conventional
25% down · 7.5% · 30yr
- Down + closing
- —
- Monthly P&I
- —
- Monthly cashflow
- —
- DSCR
- —
- Eligible?
- —
Personal DTI + credit; lowest rate.
DSCR
20% down · 8.5% · 30yr
- Down + closing
- —
- Monthly P&I
- —
- Monthly cashflow
- —
- DSCR
- —
- Eligible?
- —
No personal income docs; deal must DSCR.
Hard money
10% down · 12.0% · 12mo
- Down + closing
- —
- Monthly P&I
- —
- Monthly cashflow
- —
- DSCR
- —
- Eligible?
- —
Short-term bridge; refi at stabilization.
Rent comps 24 comps
| Address | Beds | Baths | Sqft | Rent | $/sqft | DOM | Units | Dist |
|---|---|---|---|---|---|---|---|---|
| 5100 44th Ave S Fargo, ND | 1.0–3.0 | 1.0–2.0 | 979 | $1,380 | $1.41 | 13d | 15 | 0.15mi |
| 4901 44th Ave S Fargo, ND | 1.0–3.0 | 1.0–2.0 | 948 | $1,325 | $1.40 | 13d | 22 | 0.17mi |
| 4452 47th St S Fargo, ND | 1.0–3.0 | 1.0–2.0 | 956 | $1,313 | $1.37 | 13d | 10 | 0.35mi |
| 4551 47th Ave S Fargo, ND | 2.0 | 1.0–2.0 | 987 | $1,475 | $1.49 | 13d | 21 | 0.53mi |
| 5263 50th Ave S Fargo, ND | 3.0 | 2.0 | 1672 | $1,895 | $1.13 | 13d | 1 | 0.57mi |
| 4742 50th Ave S Fargo, ND | 3.0 | 2.0 | 2000 | $2,100 | $1.05 | 20d | 1 | 0.73mi |
| 3609 56th St S Unit 1 Fargo, ND | 3.0 | 2.0 | 1641 | $2,300 | $1.40 | 20d | 1 | 0.79mi |
| 4550 49th Ave S Fargo, ND | 3.0 | 1.0–2.0 | 996 | $1,945 | $1.95 | 13d | 25 | 0.81mi |
| 5599 36th Ave S Fargo, ND | 1.0–3.0 | 1.0–2.0 | 1351 | $2,400 | $1.78 | 13d | 9 | 0.83mi |
| 5601 34th Ave S Fargo, ND | 2.0 | 1.0–2.0 | 918 | $1,830 | $1.99 | 13d | 11 | 0.97mi |
| 5671 34th Ave S Fargo, ND | 3.0 | 1.0–2.0 | 1008 | $2,795 | $2.77 | 13d | 33 | 1.00mi |
| 5207 33rd Ave S Fargo, ND | 1.0–3.0 | 1.0–2.0 | 1090 | $1,350 | $1.24 | 20d | 1 | 1.03mi |
| 5601 33rd Ave S Fargo, ND | 3.0 | 1.0–3.0 | 1009 | $2,695 | $2.67 | 13d | 50 | 1.11mi |
| 3720 42nd St S Fargo, ND | 2.0–4.0 | 1.0–2.0 | 1105 | $1,118 | $1.01 | 20d | 1 | 1.17mi |
| 3230 Seter Pkwy S Fargo, ND | 1.0–3.0 | 1.0–2.0 | 1227 | $1,825 | $1.49 | 13d | 7 | 1.20mi |
| 3368 6th Way E Unit C West Fargo, ND | 3.0 | 2.5 | 1649 | $1,950 | $1.18 | 20d | 1 | 1.29mi |
| 3994 50th Ave S Fargo, ND | 2.0–3.0 | 2.5–3.0 | 1740 | $2,145 | $1.23 | 13d | 3 | 1.30mi |
| 3309 6th Way E Unit D West Fargo, ND | 3.0 | 2.5 | 1572 | $1,950 | $1.24 | 20d | 1 | 1.31mi |
| 4281 33rd Ave S Fargo, ND | 1.0–3.0 | 1.0–2.0 | 975 | $1,165 | $1.19 | 13d | 2 | 1.32mi |
| 4251 33rd Ave S Fargo, ND | 1.0–3.0 | 1.0–2.0 | 975 | $1,115 | $1.14 | 20d | 2 | 1.36mi |
| 5855 57th Ave S Fargo, ND | 3.0 | 3.0 | 1965 | $2,195 | $1.12 | 20d | 1 | 1.40mi |
| 4920 30th Ave S Fargo, ND | 3.0 | 1.0–2.0 | 999 | $1,765 | $1.77 | 13d | 41 | 1.41mi |
| 4835 38th St S Fargo, ND | 3.0 | 1.0–2.0 | 956 | $1,765 | $1.85 | 13d | 36 | 1.44mi |
| 3330 42nd St SW Fargo, ND | 1.0–3.0 | 1.0–2.0 | 1051 | $1,095 | $1.04 | 20d | 1 | 1.48mi |
HOA detail
- Monthly dues
- $17 · $204/yr
Listing history 8 events
-
2026-05-20status Pending
-
2026-05-10historical Contingent - Inspection
-
2026-05-08$270,000 Active
-
2016-06-22soldstatus $215,650
-
2016-06-21soldstatus $215,650 334-char remark
Show marketing remark (334 chars)
Awesome 2 story twin home, 3 bedroom 4 bath with maple flooring, maple cabinets with soft-close drawers, granite countertops throughout, stainless steel appliances, kitchen island, family room with wet bar, surround sound, solid doors, tile floors, LOW specials, double vanity in master bath, walk in closet, and NO Backyard neighbors
-
2016-04-25$214,800 334-char remark
Show marketing remark (334 chars)
Awesome 2 story twin home, 3 bedroom 4 bath with maple flooring, maple cabinets with soft-close drawers, granite countertops throughout, stainless steel appliances, kitchen island, family room with wet bar, surround sound, solid doors, tile floors, LOW specials, double vanity in master bath, walk in closet, and NO Backyard neighbors
-
2012-04-23soldstatus $155,000
-
2011-08-15soldstatus $155,525
ⓘ Source: listings_history table (triggers on properties + properties_extension) + one-shot
backfill from property_details.listing_events for pre-trigger history.
Tax reassessment forecast ND · Resets to sale price
- Current annual tax
- $2,228 · $186/mo
- Projected year-2 tax
- $2,646 · $220/mo
- Expected delta
- +$418/yr (+$35/mo · 18.8%)
ⓘ Screening estimate from a state-policy table — verify with the county assessor before closing.
Climate risk First Street
- Flood 4/10 Moderate FEMA zone X (shaded) · 24% chance over 30 yrs
- Wildfire 1/10 Low
- Heat 2/10 Low 7 d/yr ≥98°F today · 12 d/yr by 30 yrs out
- Wind 2/10 Low
- Air quality 3/10 Moderate 3 unhealthy d/yr today · 3 by 30 yrs out
Nearby sold comps map
Loading sold comps map…
Walkable amenities ~0.75 mi
Loading nearby amenities…
Taxation est. · year 1
- Rental income
- $29,436
- − Mortgage interest
- −$15,124
- − Property taxes
- −$2,228
- − Insurance
- −$1,350
- − Repairs & maintenance
- −$2,355
- − Management
- −$2,355
- − HOA
- −$204
- − Depreciation
- −$7,855
- Taxable loss
- −$2,034
- Est. tax savings @ 24.0%
- +$488
- After-tax cash flow
- $2,970/yr
For passive investors: Depreciation is non-cash, so a rental often shows a tax loss while cash-flowing — sheltering income. Rental losses are passive: they offset passive income freely, and up to $25,000/yr can offset ordinary (W-2) income if you actively participate and your MAGI is under $100k (phasing out to $0 by $150k); unused losses carry forward. On sale, claimed depreciation is recaptured at up to 25%, and gains may owe capital-gains tax (a 1031 exchange can defer both). Figures are a year-1 estimate at your 24.0% rate — not tax advice; consult a CPA.
Schools (NCES district)
- District
- West Fargo 6
- NCES district ID
- 3819410
- Math proficiency
- 41% ▼ -10.00%
- Reading proficiency
- 42% ▼ -10.00%
- Median HH income
- $58,914
- Composite
- 36.6/100
- National rank
- #4628
- State rank
- #26 of 53 in ND
Livability — Fargo
- Score
- 85/100
- State rank
- #1
- US rank
- #605
Category grades
Schools grade is shown separately in the Schools card above.
Census & demographics
- Census place
- Fargo, ND
- County
- Cass County · 177,143 people
- City population
- 130,876
- Metro
- Fargo, ND-MN
- Population (ZIP)
- 49,168
- Household income
- $85,747
- Rent vs Own
- Severe rent burden
- 2039.0
Population outlook (Cass County) Hauer SSP2
- Today (2025)
- 223,771 people
- By 2030
- 251,835 · +12.5%
- By 2040
- 311,816 · +39.3%
- By 2050
- 378,694 · +69.2%
- By 2075
- 571,386 · +155.3%
- By 2100
- 769,727 · +244.0%
Race, ethnicity, and origin ACS 2023
- Neighborhood character
- Predominantly White (83%)
- Race & ethnicity
- White 83% Black 7% Two or more races 5% Asian 4% Hispanic / Latino 2%
- Common ancestry
- Portuguese 27% Lithuanian 4% Romanian 2%
- Foreign-born
- 9% · Canada, China
- Languages at home
- 92% English-only · Korean 1% Spanish 1% Russian/Polish/Slavic 1%
Political lean MEDSL · Cass
- 2024 margin
- Lean R (+8.4) · D 44.9% · R 53.3% · Other 1.9%
- 2008→2024 swing
- -15.5pp toward R · 2008: 7.1pp · 2024: -8.4pp
- All cycles
- 2024: R+8.4 2020: R+2.7 2016: R+10.7 2012: R+3.0 2008: D+7.1
Not yet ingested
- Civics
- —
Market trends
- HPI YoY
- ▼ -78.58%
- Current HPI
- 187.1707
- Rent YoY
- ▲ 5.13%
- Metro
- Fargo, ND-MN
- State GDP YoY
- ▲ 2.09%
- F500 in state
- 2
Industry mix (Fortune 500 HQ in ND)
| Industry | F500 HQs | Revenue |
|---|---|---|
| Utilities / Construction | 1 | $6B |
|
||
Price history
+73.6% since first listed8 events — show timeline
- 2026-05-20 Pending — NORTHSTARMLS as Distributed by MLS Grid
- 2026-05-10 Contingent — NORTHSTARMLS as Distributed by MLS Grid
- 2026-05-08 Listed $270,000 NORTHSTARMLS as Distributed by MLS Grid
- 2016-06-22 Sold (Public Records) $215,650 Public Records
- 2016-06-21 Sold (MLS) $215,650 NORTHSTARMLS as Distributed by MLS Grid
- 2016-04-25 Listed $214,800 NORTHSTARMLS as Distributed by MLS Grid
- 2012-04-23 Sold (Public Records) $155,000 Public Records
- 2011-08-15 Sold (Public Records) $155,525 Public Records
Property tax history
-0.7%/yrLatest (2025): $2,228 · -20.8% YoY. Source: county tax records.
Cash-flow waterfall
monthlySold comps — $/sqft
last 12 mo · ≤1 miLoading sold comps…