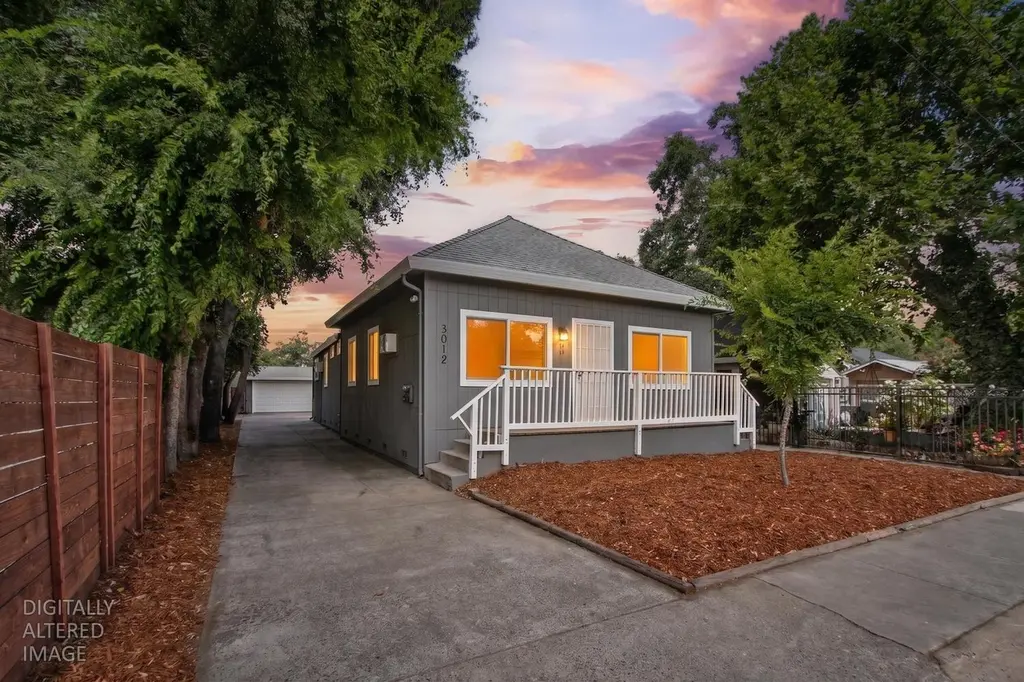
 Duplex
3312 38th St · Sacramento, CA
Flood risk 4/10 · Minor
- FEMA flood zone
- X
- Chance of flooding over 30 yrs
- 0.2%
- Est. flood insurance / yr
- $507 – $1,088
Fire risk 1/10 · Minimal
- Est. fire insurance / yr
- $659 – $1,223
Heat risk 7/10 · Major
- Hot days now (above 102°F)
- 7 days/yr
- Hot days in 30 yrs
- 15 days/yr
Wind risk 1/10 · Minimal
- Chance of severe wind over 30 yrs
- —
Air-quality risk 10/10 · Severe
- Unhealthy air days now
- 25 days/yr
- Unhealthy air days in 30 yrs
- 26 days/yr
Risk factors via First Street. Map © Google.
Why this score? — see what drove the D+ grade
The composite is a weighted blend of 9 inputs, each scored 0–100. Each bar is that input's sub-score; the figure is the points it added to the 100-point composite (weight × sub-score).
- Cash flow +15.4/30.0
- ARV discount +14.3/15.0
- DSCR +4.7/10.0
- Livability +3.6/5.0
- Schools +3.5/10.0
- 1% rule +3.0/10.0
- Rent growth +2.8/5.0
- Condition / age +2.5/5.0
- Appreciation +0.0/10.0
$475,000
🖨 Deal sheet (PDF) 📄 Offer letter ✓ Due diligence
Multi-family units
County records classify this as Multi-Family (2-4 Unit). Listing-text estimate: 2 units. confirmed
Listing remarks
Perfect Duplex for owner-occupied - w/ a 4 Car Garage * * * Seller recently invested over 80k remodeling the back Apt and replacing all exterior siding * * * Both units feature 2 Bdrms, 1 Ba with inside laundry * * * Front apt has a long standing tenant and back apt has been completely remodeled and is ready for move in. Dual Pane windows throughout w/ brand new exterior siding and freshly painted * * New Roof in 2012 & new sewer line in 2023 * * * 2 separate 2-Car Garages in the back * * * Close proximity to Aggie Square, UCD Med Center, Shriner's hospital & the Rancho Mirage grocery store
Key facts
- Remodeled back apt
- New exterior siding
- Dual pane windows
Tags
Property features AI
Finance
- HOA & community: No homeowners association
Exterior
- Parking: Off-street parking; Attached garage with 4 garage spaces (total parking for 4)
- Utilities: City utilities; Public water; Public sewer; Natural gas connected; No irrigation
- Home design: Residential income property (duplex); Apartments/subtype: duplex; Built in 1928
- Construction: Composition roofing; Original construction 1928
- Exterior features: Composition roof; Regular-shaped lot
Interior
- Kitchen: Free standing gas range; Dishwasher
- Bedrooms: Unit 1: 2 bedrooms; Unit 2: 2 bedrooms
- Flooring: Vinyl, linoleum and wood flooring; varies by unit
- Bathrooms: Unit 2: 1 full bathroom
- Heating & cooling: Wall furnace heating; Ceiling fans; Wall-mounted cooling units; varies by unit
- Interior features: Updated/remodeled units; condition varies by unit; Dual pane full windows; One-story building
- Laundry & utility: Laundry in each unit
Neighborhood map
What this means for you Summary
Snapshot
- This is a 2 × 2-bed/1.0-bath units multifamily listed at $475k.
Deal economics
- At list price, monthly cash flow is $186 ($2k/yr) — positive. Per door: $93/mo.
- The deal already cash-flows at list — no discount required.
- To meet the 1% rule (rent ≥ 1% of price), the offer needs to be $381k (19.7% below list).
- Recommended offer: $381k (19.7% below list) — sets the bar for 1% rule.
- Cap rate 6.8% vs local median 3.0% in Sacramento — top-decile yield for the area; either an underpriced asset or a hidden risk that comps aren't pricing in. Stress-test before assuming the spread holds.
Location & tenants
- Location reads 71/100 on livability (#218 in CA) — a middle-class / working-renter tenant base. Strengths: amenities A+, commute A+, housing A; Watch: crime F, cost of living F.
- Sacramento City Unified (urban): math 32% / reading 43% proficiency, ranked #804 of 1,400 in CA (top 57%) — families likely to look elsewhere, expect single-tenant / working-renter base with shorter leases; 63% free/reduced lunch — lower-income household profile, screen leases tightly.
- Zoned schools: Leonardo Da Vinci (797 students, 35% FRL); Hiram W. Johnson High (1,733 students, 77% FRL).
- Market conditions: Rents rising (+1.3%/yr); 70 active listings in the ZIP; 27 comparable units currently listed for rent nearby; rentals at typical pace (median 24d on market — plan ~3-4 weeks tenant-placement turnaround); 6,825 units permitted in Sacramento County in 2024 (1,752 in 5+ unit buildings).
- At $3,814/mo this rent would consume 71% of the median local household income ($64k/yr) (locally 1529% of renters already pay >50% of income on rent) — very limited rent-growth headroom before tenants either downsize or default.
Forward outlook
- Local home prices are declining (-3.0%/yr); year-one equity from $3k of loan paydown is wiped out by about $14k of value loss. Plan a longer hold.
- Sacramento County population projected at +17% by 2050 — long-run rental-demand tailwind backs the buy-and-hold thesis.
Negotiation context
- Only 9 days on market — expect competitive offers; lowballing is unlikely to land.
- Current owner paid $90k; list at $475k implies a 428% gain — meaningful room to come down on a strong offer.
Risks & watch-outs
- Watch-outs: built in 1928 — expect roof / HVAC / electrical / plumbing capex.
- Climate carrying-cost: extreme-heat days projected 7→15/yr by 2055 (HVAC capex compounding) — expect insurance premiums to compound above CPI over the hold.
Questions for the listing agent
- Can we see the unit-by-unit rent roll, current vacancy, and any below-market leases? What's the average tenancy length?
- What capital expenditures (roof, boiler, parking lot, exteriors) have been made in the last 5 years, and what's planned in the next 2?
- Built in 1928 — when were the roof, HVAC, electrical panel, plumbing, and water heater last replaced?
- Is there a deadline driving the sale (1031 exchange, divorce, estate, relocation)? That informs how much negotiation room exists.
- Schools are D-rated, which usually means shorter tenancies and higher turnover. Who's the typical renter profile here, and what's been the actual vacancy rate?
- Crime grade is F in this area — have there been break-ins, vandalism, or insurance claims at this property in the last 3 years? What carrier currently insures it and at what premium?
- The area grade is low — what's the realistic commute time and amenity access for the typical tenant pool here? Any planned neighborhood developments (good or bad) we should know about?
- What's the average days-on-market for RENTAL listings here right now (not sales)? A rising rental-DOM trend means longer vacancies and softer asking-rent achievability than the comps imply.
- What's the recent tenant-quality profile in this submarket — average credit score on applications, eviction rate, late-payment / NSF rate, and stable-employment percentage? A property-management company in the area should have these aggregated.
- How much new apartment / multifamily construction is in the pipeline within 1–3 miles? Heavy new supply (>2% of stock underway) typically softens rents 12–24 months out; light construction supports rent growth.
Investment metrics
- 1% rule
- 0.80% ✗
- Cap rate
- 6.76%
- Cash-on-cash
- 1.68%
- DSCR
- 1.07
- GRM
- 10.4
CMA / ARV
- ARV (on-the-fly)
- $560,000
- Comps found
- 5
Show comp detail 5 sales within ~0.75 mi
| Address | Dist | Beds/Ba | Sqft | Sold | Price | $/sf | Match |
|---|---|---|---|---|---|---|---|
| 3265 9th Ave | 0.34mi | 4/2.0 | 1,409 (+1%) | 9mo | $563,000 | $400 | 76 |
| 3811 15th Ave | 0.41mi | 4/3.0 | 1,450 (+4%) | 5mo | $565,000 | $390 | 67 |
| 3509 38th St | 0.15mi | 3/3.0 (-1) | 1,224 (-13%) | 20mo | $570,000 | $466 | 47 |
| 3556 43rd St | 0.52mi | 4/2.0 | 1,538 (+10%) | 19mo | $507,500 | $330 | 44 |
| 3900 - 3902 7th Ave | 0.15mi | 3/1.0 (-1) | 1,208 (-14%) | 21mo | $577,000 | $478 | 43 |
Match score weights: distance 35% · size 25% · config 20% · recency 20%. Top-matched comps best support the ARV.
Projected returns pro-forma
-3.0% appreciation · 1.27% rent growth · sell at horizon
- IRR
- -15.4%
- Equity multiple
- 0.46×
- Total profit
- $-71,888
- Equity at exit
- $70,824
- IRR
- -9.8%
- Equity multiple
- 0.44×
- Total profit
- $-74,132
- Equity at exit
- $41,069
Cash invested: $133,000 (down + closing). Projections, not guarantees.
Landlord ↔ Tenant lean methodology
- Overall (STATE)
- 18 Strongly Tenant-Friendly
- State California
- 18 Strongly Tenant-Friendly · D+13
- County
- — inherits STATE
- City
- — inherits STATE
ZIP-level market 95817
- Rents YoY
- 1.3%
- Active inventory
- 70
- Price-to-rent
- 20.8×
Monthly cashflow live
- Estimated rent
- $3,814 high interval (Pro) →
- Mortgage (P&I)
- −$2,491
- Tax from tax record
- −$138 /mo · $1,661/yr
- Insurance
- −$198
- HOA
- −$0
- Vacancy / Maint / Mgmt
- −$801
- Net cashflow
- $186
Break-even live
Sensitivity live
| Price | -10% $455 | -5% $320 | +0% $186 | +5% $51 | +10% $-83 |
|---|---|---|---|---|---|
| Rent | -10% $-116 | -5% $35 | +0% $186 | +5% $336 | +10% $487 |
| Rate | -1.0pp $425 | -0.5pp $307 | base $186 | +0.5pp $63 | +1.0pp $-63 |
2-unit breakdown (identical units grouped — click to expand)
| Units | Beds | Baths | Est. rent |
|---|---|---|---|
| 2× units | 2 | 1 | $3,814 |
| #1 | 2 | 1 | $1,907 |
| #2 | 2 | 1 | $1,907 |
| Total (2 units) | $3,814 | ||
UW: 25.0% down · 7.5% · 30yr · 1.5% tax · 5.0% vac · 8.0% maint · 8.0% mgmt
Financing live
Cash to close
- Down payment
- $118,750
- Closing costs
- $14,250
- Reserves months
- —
- Total cash needed
- —
Loan-product check · same deal, 3 products live
Conventional
25% down · 7.5% · 30yr
- Down + closing
- —
- Monthly P&I
- —
- Monthly cashflow
- —
- DSCR
- —
- Eligible?
- —
Personal DTI + credit; lowest rate.
DSCR
20% down · 8.5% · 30yr
- Down + closing
- —
- Monthly P&I
- —
- Monthly cashflow
- —
- DSCR
- —
- Eligible?
- —
No personal income docs; deal must DSCR.
Hard money
10% down · 12.0% · 12mo
- Down + closing
- —
- Monthly P&I
- —
- Monthly cashflow
- —
- DSCR
- —
- Eligible?
- —
Short-term bridge; refi at stabilization.
Rent comps 27 comps
| Address | Beds | Baths | Sqft | Rent | $/sqft | DOM | Units | Dist |
|---|---|---|---|---|---|---|---|---|
| 3407 37th St Sacramento, CA | 4.0 | 1.0 | 1371 | $1,845 | $1.35 | 45d | 1 | 0.10mi |
| 3402 7th Ave Sacramento, CA | 3.0 | 1.0 | 1139 | $1,950 | $1.71 | 4d | 1 | 0.23mi |
| 3210 40th St Unit 1/2 Sacramento, CA | 3.0 | 1.0 | 1280 | $1,990 | $1.55 | 16d | 1 | 0.28mi |
| 3116 40th St Unit B Sacramento, CA | 3.0 | 1.0 | 1029 | $2,200 | $2.14 | 45d | 1 | 0.29mi |
| 3900 3rd Ave Sacramento, CA | 3.0 | 1.0 | 882 | $2,565 | $2.91 | 25d | 1 | 0.38mi |
| 3900 38th St Sacramento, CA | 3.0 | 2.0 | 1119 | $2,540 | $2.27 | 25d | 1 | 0.39mi |
| 3400 44th St Sacramento, CA | 3.0 | 2.5 | 1578 | $2,495 | $1.58 | 45d | 1 | 0.57mi |
| 4200 35th St Sacramento, CA | 3.0 | 1.0 | 1100 | $2,200 | $2.00 | 18d | 1 | 0.59mi |
| 3153 2nd Ave Sacramento, CA | 3.0 | 1.0 | 900 | $2,195 | $2.44 | 9d | 1 | 0.71mi |
| 3962 44th St Sacramento, CA | 3.0 | 3.0 | 1081 | $2,550 | $2.36 | 9d | 1 | 0.71mi |
| 3962 44th St Sacramento, CA | 3.0 | 3.0 | 1081 | $2,495 | $2.31 | 23d | 1 | 0.71mi |
| 4225 Y St Sacramento, CA | 3.0 | 2.0 | 1780 | $4,450 | $2.50 | 45d | 1 | 0.74mi |
| 4624 11th Ave Sacramento, CA | 4.0 | 2.0 | 1643 | $3,200 | $1.95 | 45d | 1 | 0.77mi |
| 3401 21st Ave Sacramento, CA | 3.0 | 1.0 | 1100 | $2,100 | $1.91 | 9d | 1 | 0.81mi |
| 3480 22nd Ave Sacramento, CA | 3.0 | 2.0 | 1549 | $2,500 | $1.61 | 19d | 1 | 0.88mi |
| 5017 10th Ave Sacramento, CA | 3.0 | 2.0 | 1400 | $2,600 | $1.86 | 18d | 1 | 1.01mi |
| 3675 T St Sacramento, CA | 1.0–3.0 | 1.0–2.0 | 1032 | $4,040 | $3.91 | 0d | 9 | 1.03mi |
| 4701 V St Sacramento, CA | 3.0 | 2.0 | 1008 | $2,395 | $2.38 | 19d | 1 | 1.07mi |
| 4311 48th St Sacramento, CA | 3.0 | 1.0 | 1313 | $2,150 | $1.64 | 45d | 1 | 1.09mi |
| 5221 9th Ave Sacramento, CA | 3.0 | 1.5 | 1626 | $3,000 | $1.85 | 18d | 1 | 1.15mi |
| 3042 53rd St Sacramento, CA | 3.0 | 2.0 | 1115 | $2,225 | $2.00 | 46d | 1 | 1.18mi |
| 4204 51st St Sacramento, CA | 3.0 | 1.0 | 1050 | $2,450 | $2.33 | 4d | 1 | 1.19mi |
| 4204 51st St Unit A Sacramento, CA | 3.0 | 1.0 | 1050 | $2,450 | $2.33 | 25d | 1 | 1.19mi |
| 2548 52nd St Sacramento, CA | 3.0 | 2.0 | 1013 | $3,150 | $3.11 | 9d | 1 | 1.23mi |
| 4930 Bonniemae Way Sacramento, CA | 3.0 | 2.0 | 1289 | $2,500 | $1.94 | 45d | 1 | 1.24mi |
| 2212 20th Ave Sacramento, CA | 3.0 | 2.0 | 1150 | $2,850 | $2.48 | 45d | 1 | 1.37mi |
| 5301 20th Ave Sacramento, CA | 3.0 | 1.0 | 1053 | $2,650 | $2.52 | 45d | 1 | 1.43mi |
Listing history 7 events
-
2026-06-21days on market $475,000 Active 9 DOM
-
2026-06-18days on market $475,000 Active 6 DOM
-
2026-06-17days on market $475,000 Active 5 DOM
-
2026-06-16days on market $475,000 Active 4 DOM
-
2026-06-15days on market $475,000 Active 3 DOM
-
2026-06-13remarks 640-char remark
-
2026-06-13$475,000 Active 1 DOM
ⓘ Source: listings_history table (triggers on properties + properties_extension) + one-shot
backfill from property_details.listing_events for pre-trigger history.
Tax reassessment forecast CA · Resets to sale price
- Current annual tax
- $1,661 · $138/mo
- Projected year-2 tax
- $3,610 · $301/mo
- Expected delta
- +$1,949/yr (+$162/mo · 117.3%)
ⓘ Screening estimate from a state-policy table — verify with the county assessor before closing.
Climate risk First Street
- Flood 4/10 Moderate FEMA zone X · 20% chance over 30 yrs
- Wildfire 1/10 Low
- Heat 7/10 Severe 7 d/yr ≥102°F today · 15 d/yr by 30 yrs out
- Wind 1/10 Low
- Air quality 10/10 Extreme 25 unhealthy d/yr today · 26 by 30 yrs out
Nearby sold comps map
Loading sold comps map…
Walkable amenities ~0.75 mi
Loading nearby amenities…
Taxation est. · year 1
- Rental income
- $45,768
- − Mortgage interest
- −$26,607
- − Property taxes
- −$1,661
- − Insurance
- −$2,375
- − Repairs & maintenance
- −$3,661
- − Management
- −$3,661
- − Depreciation
- −$13,818
- Taxable loss
- −$6,016
- Est. tax savings @ 24.0%
- +$1,444
- After-tax cash flow
- $3,673/yr
For passive investors: Depreciation is non-cash, so a rental often shows a tax loss while cash-flowing — sheltering income. Rental losses are passive: they offset passive income freely, and up to $25,000/yr can offset ordinary (W-2) income if you actively participate and your MAGI is under $100k (phasing out to $0 by $150k); unused losses carry forward. On sale, claimed depreciation is recaptured at up to 25%, and gains may owe capital-gains tax (a 1031 exchange can defer both). Figures are a year-1 estimate at your 24.0% rate — not tax advice; consult a CPA.
Schools (NCES district)
- District
- Sacramento City Unified
- NCES district ID
- 0633840
- Math proficiency
- 32% ▬ 0.00%
- Reading proficiency
- 43% ▲ 3.00%
- Median HH income
- $49,280
- Composite
- 34.86/100
- National rank
- #10000
- State rank
- #804 of 1400 in CA
Livability — Sacramento
- Score
- 71/100
- State rank
- #218
- US rank
- #6957
Category grades
Schools grade is shown separately in the Schools card above.
Census & demographics
- Census place
- Sacramento, CA
- County
- Sacramento County · 1,539,646 people
- City population
- 761,410
- Metro
- Sacramento-Roseville-Folsom, CA
- Population (ZIP)
- 14,219
- Household income
- $64,212
- Rent vs Own
- Severe rent burden
- 1529.0
Population outlook (Sacramento County) Hauer SSP2
- Today (2025)
- 1,660,763 people
- By 2030
- 1,732,990 · +4.3%
- By 2040
- 1,855,755 · +11.7%
- By 2050
- 1,941,335 · +16.9%
- By 2075
- 2,046,162 · +23.2%
- By 2100
- 1,961,444 · +18.1%
Race, ethnicity, and origin ACS 2023
- Neighborhood character
- Highly diverse neighborhood (Simpson 0.73)
- Race & ethnicity
- White 43% Hispanic / Latino 24% Two or more races 13% Black 12% Asian 11% Native American 2% Pacific Islander 1%
- Hispanic origin (detail)
- Mexican 19% Dominican 1%
- Common ancestry
- Italian 4% Slovak 2% Portuguese 2%
- Foreign-born
- 11% · Canada, China, South Korea
- Languages at home
- 80% English-only · Spanish 9% Other Asian/Pacific 3% Russian/Polish/Slavic 2%
Political lean MEDSL · Sacramento
- 2024 margin
- D (+19.7) · D 58.1% · R 38.4% · Other 3.5%
- 2008→2024 swing
- +0.7pp no change · 2008: 19.0pp · 2024: 19.7pp
- All cycles
- 2024: D+19.7 2020: D+25.3 2016: D+23.7 2012: D+16.3 2008: D+19.0
Not yet ingested
- Civics
- —
Market trends
- HPI YoY
- ▼ -402.45%
- Current HPI
- 617.5913
- Rent YoY
- ▲ 1.27%
- Metro
- Sacramento-Roseville-Folsom, CA
- State GDP YoY
- ▲ 3.21%
- F500 in state
- 116
Industry mix (Fortune 500 HQ in CA)
| Industry | F500 HQs | Revenue |
|---|---|---|
| Technology | 27 | $1,492B |
|
||
| Financial Services | 3 | $174B |
|
||
| Retail | 3 | $44B |
|
||
| Insurance | 3 | $26B |
|
||
| Media / Entertainment | 2 | $115B |
|
||
| Pharmaceuticals / Biotech | 2 | $62B |
|
||
Price history
+181.2% since first listed7 events — show timeline
- 2012-06-29 Sold (Public Records) $90,000 Public Records
- 2004-09-17 Sold (Public Records) $276,000 Public Records
- 2003-11-12 Sold (Public Records) $140,000 Public Records
- 1986-10-31 Sold (Public Records) $40,000 Public Records
- 1984-11-28 Sold (Public Records) $35,000 Public Records
- 1982-10-08 Sold (Public Records) $33,000 Public Records
- 1978-11-14 Sold (Public Records) $32,000 Public Records
Property tax history
-4.3%/yrLatest (2025): $1,661 · +1.3% YoY. Source: county tax records.
Cash-flow waterfall
monthlySold comps — $/sqft
last 12 mo · ≤1 miLoading sold comps…