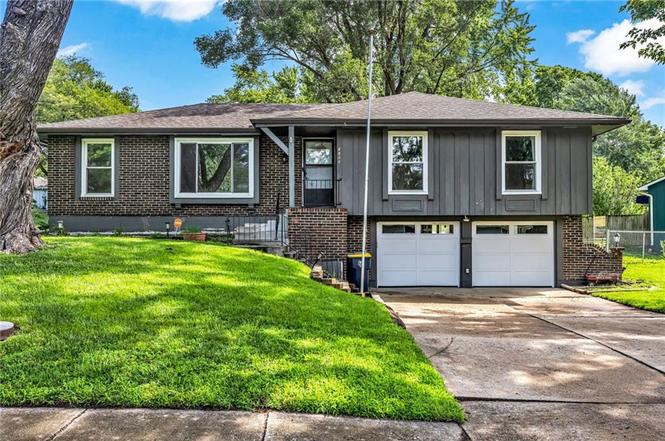
8800 Mcelroy Rd · Kansas City, MO
Flood risk No data
- FEMA flood zone
- —
- Chance of flooding over 30 yrs
- —
- Est. flood insurance / yr
- —
Fire risk No data
- Est. fire insurance / yr
- —
Heat risk No data
- Hot days now (above threshold)
- —
- Hot days in 30 yrs
- —
Wind risk No data
- Chance of severe wind over 30 yrs
- —
Air-quality risk No data
- Unhealthy air days now
- —
- Unhealthy air days in 30 yrs
- —
Risk factors via First Street. Map © Google.
Why this score? — see what drove the B- grade
The composite is a weighted blend of 9 inputs, each scored 0–100. Each bar is that input's sub-score; the figure is the points it added to the 100-point composite (weight × sub-score).
- Cash flow +28.8/30.0
- DSCR +10.0/10.0
- 1% rule +7.6/10.0
- ARV discount +7.5/15.0
- Rent growth +4.2/5.0
- Livability +3.9/5.0
- Condition / age +2.5/5.0
- Schools +1.5/10.0
- Appreciation +0.0/10.0
$199,950
🖨 Deal sheet 📄 Offer letter ✓ Due diligence
Listing remarks MLS
Many updates- Carpet & paint inside and out, ceramic tile floor in bath- wood floors under some of carpet. New floor in kitchen- corner lot- vacant and ready to move in. Fenced with large trees.
Key facts
- Installed piers
- Large corner lot
- Newer windows
Tags
Property features AI
Finance
- Other: Living area approximately 1,352 (public records); Property age: 51-75 years
- HOA & community: Ruskin Hills HOA; Annual HOA fee of $36
Exterior
- Parking: Attached built-in garage that faces the front; 2-car garage
- Security: Security system; Smoke detectors
- Utilities: Public water; Public sewer; Metro Free telecom
- Home design: Single family residence; Residential property; Raised ranch; Facing unknown
- Construction: Board & batten siding with brick trim; Composition roof; Partial concrete basement (has basement)
- Exterior features: Patio; Metal fencing; City lot; Corner lot
Interior
- Kitchen: Dishwasher; Disposal; Exhaust fan; Built-in oven; Gas range; Eat-in kitchen and formal dining area
- Bedrooms: 3 bedrooms (all on the first level)
- Flooring: Carpet; Laminate
- Bathrooms: 2 full bathrooms
- Heating & cooling: Forced air heating; Electric cooling
- Interior features: Ceiling fans; Storm doors; Window coverings; Storm windows; Security system; Smoke detectors; Raised ranch floor plan
- Laundry & utility: Laundry in the basement
Neighborhood map
What this means for you Summary
Snapshot
- This is a 3-bed/1.5-bath single-family listed at $200k.
Deal economics
- At list price, monthly cash flow is $673 ($8k/yr) — positive.
- The deal already cash-flows at list — no discount required.
- Meets the 1% rule at list price ($3k rent vs $200k).
- Cap rate 10.3% vs local median 3.9% in Kansas City — top-decile yield for the area; either an underpriced asset or a hidden risk that comps aren't pricing in. Stress-test before assuming the spread holds.
Location & tenants
- Location reads 78/100 on livability (#28 in MO, #2,671 nationally) — a middle-class / working-renter tenant base. Strengths: amenities A+, commute A+, cost of living A+; Watch: schools C-, crime F.
- Kansas City 33 (urban): math 12% / reading 24% proficiency, ranked #308 of 324 in MO (top 95%) — low school quality limits family demand, transient renter base, plan for 1-2y turnover; 75% free/reduced lunch — lower-income household profile, screen leases tightly.
- Market conditions: Rents rising fast (+6.7%/yr); 143 active listings in the ZIP; 40 comparable units currently listed for rent nearby; rentals leasing fast (median 3d on market — plan ~1-2 weeks tenant-placement turnaround); 4,002 units permitted in Jackson County in 2024 (2,271 in 5+ unit buildings).
- At $2,529/mo this rent would consume 52% of the median local household income ($58k/yr) (locally 718% of renters already pay >50% of income on rent) — very limited rent-growth headroom before tenants either downsize or default.
Forward outlook
- Local home prices are declining (-3.0%/yr); year-one equity from $1k of loan paydown is wiped out by about $6k of value loss. Plan a longer hold.
- Jackson County population projected at +4% by 2050 — modest demand growth; plan on rents tracking national, not racing it.
- At projected returns (-3.0% appreciation + 6.7% rent growth), your $56k cash investment doubles in ~7 years — after that, you're playing with house money.
Negotiation context
- Only 7 days on market — expect competitive offers; lowballing is unlikely to land.
- 2 sale attempts since 23y ago with the ask held roughly flat each time — persistent listings suggest the price (not the market) is what's stuck; bring a comps-based counter.
Questions for the listing agent
- Built in 1967 — when were the roof, HVAC, electrical panel, plumbing, and water heater last replaced?
- What does the HOA fee cover, when was the last increase, and are there any pending special assessments or reserve-fund shortfalls?
- Is there a deadline driving the sale (1031 exchange, divorce, estate, relocation)? That informs how much negotiation room exists.
- Crime grade is F in this area — have there been break-ins, vandalism, or insurance claims at this property in the last 3 years? What carrier currently insures it and at what premium?
- What's the average days-on-market for RENTAL listings here right now (not sales)? A rising rental-DOM trend means longer vacancies and softer asking-rent achievability than the comps imply.
- What's the recent tenant-quality profile in this submarket — average credit score on applications, eviction rate, late-payment / NSF rate, and stable-employment percentage? A property-management company in the area should have these aggregated.
- How much new for-sale + rental construction is in the pipeline within 1–3 miles? Heavy new supply typically softens prices + rents 12–24 months out; constrained supply supports both.
Investment metrics
- 1% rule
- 1.26% ✓
- Cap rate
- 10.33%
- Cash-on-cash
- 14.43%
- DSCR
- 1.64
- GRM
- 6.6
CMA / ARV
No comps found within radius.
Projected returns pro-forma
-3.0% appreciation · 6.73% rent growth · sell at horizon
- IRR
- 8.9%
- Equity multiple
- 1.36×
- Total profit
- $20,317
- Equity at exit
- $29,813
- IRR
- 20.9%
- Equity multiple
- 3.08×
- Total profit
- $116,539
- Equity at exit
- $17,288
Cash invested: $55,986 (down + closing). Projections, not guarantees.
Landlord ↔ Tenant lean methodology
- Overall (STATE)
- 81 Strongly Landlord-Friendly
- State Missouri
- 81 Strongly Landlord-Friendly · R+10
- County
- — inherits STATE
- City
- — inherits STATE
ZIP-level market 64134
- Rents YoY
- 6.7%
- Active inventory
- 143
- Price-to-rent
- 6.6×
Monthly cashflow live
- Estimated rent
- $2,529 high interval (Pro) →
- Mortgage (P&I)
- −$1,049
- Tax from tax record
- −$190 /mo · $2,282/yr
- Insurance
- −$83
- HOA
- −$3
- Vacancy / Maint / Mgmt
- −$531
- Net cashflow
- $673
Break-even live
UW: 25.0% down · 7.5% · 30yr · 1.5% tax · 5.0% vac · 8.0% maint · 8.0% mgmt
Financing live
Cash to close
- Down payment
- $49,988
- Closing costs
- $5,998
- Reserves months
- —
- Total cash needed
- —
Loan-product check · same deal, 3 products live
Conventional
25% down · 7.5% · 30yr
- Down + closing
- —
- Monthly P&I
- —
- Monthly cashflow
- —
- DSCR
- —
- Eligible?
- —
Personal DTI + credit; lowest rate.
DSCR
20% down · 8.5% · 30yr
- Down + closing
- —
- Monthly P&I
- —
- Monthly cashflow
- —
- DSCR
- —
- Eligible?
- —
No personal income docs; deal must DSCR.
Hard money
10% down · 12.0% · 12mo
- Down + closing
- —
- Monthly P&I
- —
- Monthly cashflow
- —
- DSCR
- —
- Eligible?
- —
Short-term bridge; refi at stabilization.
Rent comps 40 comps
| Address | Beds | Baths | Sqft | Rent | $/sqft | DOM | Units | Dist |
|---|---|---|---|---|---|---|---|---|
| 1125 Grand Blvd Kansas City, MO | 2.0 | 1.0–2.5 | 1315 | $4,283 | $3.26 | 1d | 36 | 0.29mi |
| 1444 Grand Blvd Kansas City, MO | 1.0–2.0 | 1.0–2.0 | 901 | $4,175 | $4.63 | 1d | 25 | 0.30mi |
| 1103 Grand Blvd Kansas City, MO | 1.0–2.0 | 1.0–2.0 | 1061 | $1,650 | $1.56 | 23d | 6 | 0.31mi |
| 50 E 13th St Kansas City, MO | 2.0 | 1.0–2.0 | 872 | $3,330 | $3.82 | 1d | 23 | 0.34mi |
| 933 McGee St Kansas City, MO | 2.0 | 1.0 | 704 | $1,899 | $2.70 | 14d | 1 | 0.35mi |
| 1600 Grand Blvd Kansas City, MO | 2.0 | 2.0 | 1100 | $1,800 | $1.64 | 23d | 1 | 0.39mi |
| 1477 Main St Kansas City, MO | 2.0 | 1.0–2.5 | 1177 | $7,180 | $6.10 | 1d | 15 | 0.40mi |
| 1003 Walnut St Kansas City, MO | 1.0–2.0 | 1.0 | 750 | $2,050 | $2.73 | 23d | 12 | 0.42mi |
| 500 E 8th St Kansas City, MO | 2.0 | 1.0–2.0 | 770 | $2,084 | $2.71 | 1d | 70 | 0.45mi |
| 106 W 14th St Kansas City, MO | 1.0–2.0 | 1.0–2.0 | 1046 | $3,792 | $3.63 | 1d | 27 | 0.47mi |
| 911 Main St Kansas City, MO | 2.0 | 1.0–2.0 | 1018 | $3,675 | $3.61 | 1d | 18 | 0.51mi |
| 920 Main St Kansas City, MO | 1.0–2.0 | 1.0–2.0 | 897 | $2,465 | $2.75 | 17d | 1 | 0.51mi |
| 920 Main St Kansas City, MO | 1.0–2.0 | 1.0–2.0 | 897 | $2,750 | $3.07 | 21d | 5 | 0.51mi |
| 106 W 11th St Kansas City, MO | 2.0 | 1.0–2.0 | 838 | $2,528 | $3.01 | 2d | 28 | 0.52mi |
| 1004 Baltimore Ave Kansas City, MO | 1.0–2.0 | 1.0–2.0 | 1015 | $1,750 | $1.72 | 1d | 8 | 0.54mi |
| 127 W 10th St Kansas City, MO | 2.0 | 1.0–2.0 | 766 | $1,690 | $2.20 | 23d | 12 | 0.56mi |
| 1918 Locust St Kansas City, MO | 2.0 | 1.0–2.0 | 734 | $1,957 | $2.67 | 1d | 32 | 0.59mi |
| 110 W 9th St Kansas City, MO | 2.0 | 1.0 | 867 | $2,265 | $2.61 | 43d | 1 | 0.62mi |
| 720 Main St Kansas City, MO | 2.0 | 1.0–2.0 | 723 | $1,678 | $2.32 | 1d | 22 | 0.63mi |
| 531 Grand Blvd Kansas City, MO | 2.0 | 2.0 | 881 | $2,599 | $2.95 | 1d | 6 | 0.69mi |
| 1989 Main St Kansas City, MO | 2.0 | 1.0–2.0 | 770 | $2,465 | $3.20 | 1d | 15 | 0.71mi |
| 323 W 8th St Kansas City, MO | 1.0–2.0 | 1.0–2.0 | 816 | $1,759 | $2.16 | 2d | 14 | 0.75mi |
| 1200 Washington St Kansas City, MO | 1.0–2.0 | 1.0–2.0 | 1011 | $2,257 | $2.23 | 43d | 17 | 0.78mi |
| 1200 Washington St Kansas City, MO | 1.0–2.0 | 1.0–2.0 | 1093 | $2,324 | $2.13 | 2d | 16 | 0.78mi |
| 701 Broadway Blvd Kansas City, MO | 2.0 | 1.0–2.0 | 1059 | $2,522 | $2.38 | 1d | 12 | 0.79mi |
| 117 W 20th St Kansas City, MO | 1.0–2.0 | 1.0–2.0 | 1130 | $5,416 | $4.79 | 10d | 1 | 0.82mi |
| 401 Delaware St Kansas City, MO | 1.0–2.0 | 1.0–2.0 | 880 | $1,858 | $2.11 | 1d | 12 | 0.87mi |
| 2100 Wyandotte St Kansas City, MO | 2.0 | 1.0–2.0 | 820 | $2,515 | $3.07 | 1d | 12 | 0.89mi |
| 237 W 4th St Kansas City, MO | 1.0–2.0 | 1.0–2.5 | 988 | $2,365 | $2.39 | 1d | 12 | 0.91mi |
| 201 Grand Blvd Kansas City, MO | 3.0 | 1.0–2.5 | 1000 | $4,526 | $4.53 | 1d | 135 | 0.92mi |
| 200 Walnut St Kansas City, MO | 2.0 | 1.0–2.0 | 1065 | $2,134 | $2.00 | 7d | 1 | 0.94mi |
| 1050 Jefferson St Kansas City, MO | 1.0–2.0 | 1.0–2.0 | 1166 | $2,683 | $2.30 | 2d | 17 | 0.94mi |
| 1050 Jefferson St Kansas City, MO | 1.0–2.0 | 1.0–2.0 | 1166 | $2,558 | $2.19 | 43d | 17 | 0.94mi |
| 2121 Central St Kansas City, MO | 1.0–2.0 | 1.0–2.0 | 1815 | $3,095 | $1.71 | 1d | 3 | 0.97mi |
| 311 W 22nd St Kansas City, MO | 3.0 | 1.0–2.0 | 1009 | $4,340 | $4.30 | 1d | 60 | 0.99mi |
| 425 Washington St Kansas City, MO | 2.0 | 2.0 | 1803 | $1,895 | $1.05 | 10d | 1 | 0.99mi |
| 2101 Vine St Kansas City, MO | 1.0–2.0 | 1.0 | 942 | $1,499 | $1.59 | 16d | 1 | 1.05mi |
| 612 Garfield Ave Kansas City, MO | 1.0–2.0 | 1.0–2.0 | 900 | $1,875 | $2.08 | 1d | 44 | 1.06mi |
| 382 W 22nd St Kansas City, MO | 2.0 | 2.0 | 1350 | $1,869 | $1.38 | 16d | 1 | 1.07mi |
| 382 W 22nd St Kansas City, MO | 2.0 | 2.0 | 1501 | $2,019 | $1.35 | 43d | 1 | 1.07mi |
HOA detail
- Monthly dues
- $3 · $36/yr
Listing history 6 events
-
2026-06-18days on market $199,950 Active 7 DOM
-
2026-06-17days on market $199,950 Active 6 DOM
-
2026-06-16days on market $199,950 Active 5 DOM
-
2026-06-15days on market $199,950 Active 4 DOM
-
2026-06-13remarks 693-char remark
-
2026-06-13$199,950 Active 2 DOM
ⓘ Source: listings_history table (triggers on properties + properties_extension) + one-shot
backfill from property_details.listing_events for pre-trigger history.
Tax reassessment forecast MO · Resets to sale price
- Current annual tax
- $2,282 · $190/mo
- Projected year-2 tax
- $2,282 · $190/mo
- Expected delta
- $0/yr ($0/mo · 0.0%)
ⓘ Screening estimate from a state-policy table — verify with the county assessor before closing.
Nearby sold comps map
Loading sold comps map…
Walkable amenities ~0.75 mi
Loading nearby amenities…
Taxation est. · year 1
- Rental income
- $30,350
- − Mortgage interest
- −$11,200
- − Property taxes
- −$2,282
- − Insurance
- −$1,000
- − Repairs & maintenance
- −$2,428
- − Management
- −$2,428
- − HOA
- −$36
- − Depreciation
- −$5,817
- Taxable income
- $5,160
- Est. tax owed @ 24.0%
- −$1,238
- After-tax cash flow
- $6,838/yr
For passive investors: Depreciation is non-cash, so a rental often shows a tax loss while cash-flowing — sheltering income. Rental losses are passive: they offset passive income freely, and up to $25,000/yr can offset ordinary (W-2) income if you actively participate and your MAGI is under $100k (phasing out to $0 by $150k); unused losses carry forward. On sale, claimed depreciation is recaptured at up to 25%, and gains may owe capital-gains tax (a 1031 exchange can defer both). Figures are a year-1 estimate at your 24.0% rate — not tax advice; consult a CPA.
Schools (NCES district)
- District
- Kansas City 33
- NCES district ID
- 2916400
- Math proficiency
- 12% ▼ -8.00%
- Reading proficiency
- 24% ▬ 0.00%
- Median HH income
- $35,227
- Composite
- 14.8/100
- National rank
- #9387
- State rank
- #308 of 324 in MO
Livability — Kansas City
- Score
- 78/100
- State rank
- #28
- US rank
- #2671
Category grades
Schools grade is shown separately in the Schools card above.
Census & demographics
- Census place
- Kansas City, MO
- County
- Jackson County · 687,798 people
- City population
- 439,467
- Metro
- Kansas City, MO-KS
- Population (ZIP)
- 22,964
- Household income
- $58,170
- Rent vs Own
- Severe rent burden
- 718.0
Population outlook (Jackson County) Hauer SSP2
- Today (2025)
- 719,589 people
- By 2030
- 731,456 · +1.6%
- By 2040
- 746,689 · +3.8%
- By 2050
- 749,289 · +4.1%
- By 2075
- 736,227 · +2.3%
- By 2100
- 668,210 · -7.1%
Race, ethnicity, and origin ACS 2023
- Neighborhood character
- Diverse neighborhood (Simpson 0.58)
- Race & ethnicity
- Black 58% White 28% Hispanic / Latino 10% Two or more races 6%
- Hispanic origin (detail)
- Mexican 6%
- Common ancestry
- Italian 2% Lithuanian 1% Romanian 1%
- Foreign-born
- 4% · Canada
- Languages at home
- 93% English-only · Spanish 5% Arabic 1%
Political lean MEDSL · Jackson
- 2024 margin
- D (+19.3) · D 58.9% · R 39.5% · Other 1.6%
- 2008→2024 swing
- -6.1pp toward R · 2008: 25.4pp · 2024: 19.3pp
- All cycles
- 2024: D+19.3 2020: D+22.0 2016: D+16.6 2012: D+19.0 2008: D+25.4
Not yet ingested
- Civics
- —
Market trends
- HPI YoY
- ▼ -157.94%
- Current HPI
- 277.895
- Rent YoY
- ▲ 6.73%
- Metro
- Kansas City, MO-KS
- State GDP YoY
- ▲ 1.84%
- F500 in state
- 20
Industry mix (Fortune 500 HQ in MO)
| Industry | F500 HQs | Revenue |
|---|---|---|
| Healthcare | 1 | $163B |
|
||
| Insurance | 1 | $21B |
|
||
| Industrial Technology | 1 | $17B |
|
||
| Retail | 1 | $16B |
|
||
| Industrial Distribution | 1 | $10B |
|
||
| Utilities | 1 | $9B |
|
||
Price history
+138.0% since first listed6 events — show timeline
- 2026-06-12 Listed $199,950 Heartland MLS as Distributed by MLS Grid
- 2026-06-10 Coming Soon $199,950 Heartland MLS as Distributed by MLS Grid
- 2003-07-03 Sold (Public Records) — Public Records
- 2003-07-01 Sold (MLS) — Heartland MLS as Distributed by MLS Grid
- 2003-05-02 Listed $84,000 Heartland MLS as Distributed by MLS Grid
- 1992-09-02 Sold (Public Records) — Public Records
Property tax history
+10.9%/yrLatest (2025): $2,282 · +2.2% YoY. Source: county tax records.
Cash-flow waterfall
monthlySold comps — $/sqft
last 12 mo · ≤1 miLoading sold comps…