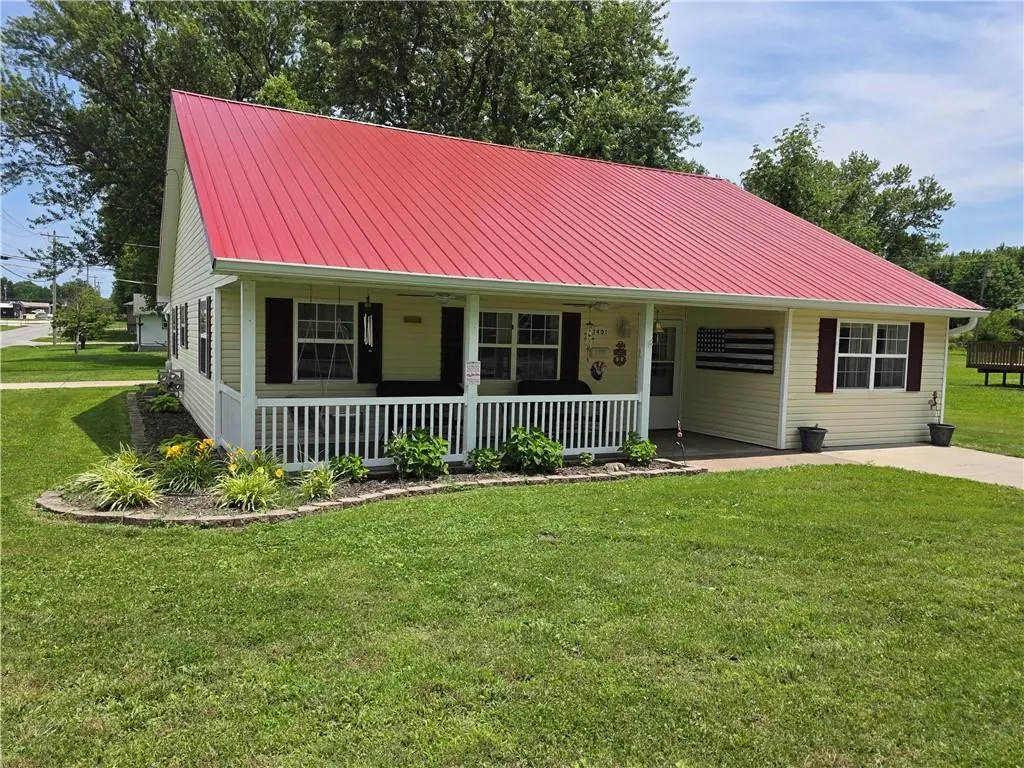
1401 S Main St · El Dorado Springs, MO
Flood risk 1/10 · Minimal
- FEMA flood zone
- X (unshaded)
- Chance of flooding over 30 yrs
- 0.0%
- Est. flood insurance / yr
- $507 – $1,088
Fire risk 4/10 · Minor
- Est. fire insurance / yr
- $1,054 – $1,958
Heat risk 5/10 · Moderate
- Hot days now (above 108°F)
- 7 days/yr
- Hot days in 30 yrs
- 18 days/yr
Wind risk 2/10 · Minimal
- Chance of severe wind over 30 yrs
- 1.0%
Air-quality risk 2/10 · Minimal
- Unhealthy air days now
- 0 days/yr
- Unhealthy air days in 30 yrs
- 1 days/yr
Risk factors via First Street. Map © Google.
Why this score? — see what drove the D+ grade
The composite is a weighted blend of 9 inputs, each scored 0–100. Each bar is that input's sub-score; the figure is the points it added to the 100-point composite (weight × sub-score).
- Cash flow +14.4/30.0
- Appreciation +10.0/10.0
- ARV discount +6.1/15.0
- DSCR +4.4/10.0
- Livability +3.1/5.0
- 1% rule +2.9/10.0
- Rent growth +2.5/5.0
- Condition / age +2.5/5.0
- Schools +2.4/10.0
$182,500
🖨 Deal sheet 📄 Offer letter ✓ Due diligence
Listing remarks MLS
Lovely 3 bedroom, 2 bath home built in 2004 has open kitchen/living/dining room, covered 8 X 27 porch. Amazing, mature landscaping with lots of flowering shrubs, on a corner lot in a nice area in town!
Key facts
- 0.28 acre lot
- Built 2004
- Listed 10 days
Property features AI
Finance
- HOA & community: No association fees
Exterior
- Parking: Off-street parking
- Utilities: Public water; Public sewer; High-speed internet available
- Home design: Single-family residence (residential); One-story living (main-level living orientation)
- Construction: Vinyl siding; Metal roof; Built approximately 21–30 years ago; Slab foundation
- Exterior features: Covered patio; Front porch; Corner lot in city limits; Yard shed(s); Paved public road access
Interior
- Kitchen: Kitchen with island; Dishwasher; Disposal; Microwave; Refrigerator; Electric range
- Bedrooms: 3 bedrooms (all on main level); Bedroom 2 approx. 21.5 x 12; Bedroom 3 approx. 10.8 x 12; Additional main-level room approx. 13 x 13 (could be used as bedroom/office)
- Flooring: Laminate; Luxury vinyl; Tile
- Bathrooms: 2 full bathrooms (both on main level); Bath dimensions approx. 5.7 x 10.8 and 6.8 x 7.6
- Heating & cooling: Forced air heating; Electric cooling (has cooling)
- Interior features: Ceiling fans; Kitchen island; Walk-in closets; Accessible bathroom; Open concept dining/living and kitchen/dining combos
- Laundry & utility: Main-level laundry room (approx. 7.5 x 7.6)
Neighborhood map
What this means for you Summary
Snapshot
- This is a 3-bed/2.0-bath single-family listed at $182k.
Deal economics
- At list price, monthly cash flow is $38 ($456/yr) — positive.
- The deal already cash-flows at list — no discount required.
- To meet the 1% rule (rent ≥ 1% of price), the offer needs to be $145k (20.5% below list).
- Recommended offer: $145k (20.5% below list) — sets the bar for 1% rule.
- Cap rate 6.5% vs local median 4.9% in El Dorado Springs — top-decile yield for the area; either an underpriced asset or a hidden risk that comps aren't pricing in. Stress-test before assuming the spread holds.
Location & tenants
- Location reads 62/100 on livability (#370 in MO) — a middle-class / working-renter tenant base. Strengths: cost of living A+, housing A+, health & safety A+; Watch: amenities F, commute F, employment F.
- El Dorado Springs R-II (town): math 25% / reading 34% proficiency, ranked #279 of 324 in MO (top 86%) — low school quality limits family demand, transient renter base, plan for 1-2y turnover.
- Zoned schools: El Dorado Springs Elem. (math 26% / reading 34%, grade F, #808 of 1,115 statewide, top 73%, 580 students, 100% FRL); El Dorado Springs High (math 12% / reading 47%, grade F, #382 of 521 statewide, top 78%, 348 students, 40% FRL) — zoned schools average 70% FRL vs 49% district-wide (20 pts higher); higher-poverty schools than district average — tighter screening recommended.
- Market conditions: 81 active listings in the ZIP; 1 comparable units currently listed for rent nearby; 4 units permitted in Cedar County in 2024 (0 in 5+ unit buildings).
Forward outlook
- In year one you build about $20k of equity ($1k loan paydown + $18k appreciation (10.0% local appreciation)).
- Cedar County population projected at -12% by 2050 — secular population decline; favor cash flow + early exit over multi-decade hold.
- At projected returns (10.0% appreciation + 3.0% rent growth), your $51k cash investment doubles in ~3 years — after that, you're playing with house money.
- By year 2, paydown + projected appreciation supports a ~$31k cash-out refi (75% LTV) — recoverable capital for the next deal without selling this one.
Negotiation context
- Only 11 days on market — expect competitive offers; lowballing is unlikely to land.
- 2 sale attempts since 10y ago; this cycle's ask is 103% above the opening price — seller raised mid-cycle; expect resistance to lowballs.
Risks & watch-outs
- Climate carrying-cost: extreme-heat days projected 7→18/yr by 2055 (HVAC capex compounding) — expect insurance premiums to compound above CPI over the hold.
Questions for the listing agent
- Is there a deadline driving the sale (1031 exchange, divorce, estate, relocation)? That informs how much negotiation room exists.
- Schools are D-rated, which usually means shorter tenancies and higher turnover. Who's the typical renter profile here, and what's been the actual vacancy rate?
- The area grade is low — what's the realistic commute time and amenity access for the typical tenant pool here? Any planned neighborhood developments (good or bad) we should know about?
- What's the average days-on-market for RENTAL listings here right now (not sales)? A rising rental-DOM trend means longer vacancies and softer asking-rent achievability than the comps imply.
- What's the recent tenant-quality profile in this submarket — average credit score on applications, eviction rate, late-payment / NSF rate, and stable-employment percentage? A property-management company in the area should have these aggregated.
- How much new for-sale + rental construction is in the pipeline within 1–3 miles? Heavy new supply typically softens prices + rents 12–24 months out; constrained supply supports both.
Investment metrics
- 1% rule
- 0.79% ✗
- Cap rate
- 6.54%
- Cash-on-cash
- 0.89%
- DSCR
- 1.04
- GRM
- 10.5
CMA / ARV
- ARV (on-the-fly)
- $177,144
- Comps found
- 12
Show comp detail 12 sales within ~0.75 mi
| Address | Dist | Beds/Ba | Sqft | Sold | Price | $/sf | Match |
|---|---|---|---|---|---|---|---|
| 201 W Hospital Rd | 0.17mi | 3/2.0 | 1,414 (-3%) | 2mo | $189,900 | $134 | 85 |
| 205 E Golden St | 0.25mi | 3/2.0 | 1,627 (+11%) | 1mo | $234,900 | $144 | 69 |
| 201 S Belisle St | 0.07mi | 4/1.5 (+1) | 1,600 (+9%) | 9mo | $175,000 | $109 | 67 |
| 1406 S Summer St | 0.36mi | 3/2.0 | 1,368 (-7%) | 10mo | $157,500 | $115 | 64 |
| 403 E Twyman Ave | 0.35mi | 4/2.0 (+1) | 1,512 (+3%) | 12mo | $70,000 | $46 | 63 |
| 705 Sunset Dr | 0.56mi | 3/2.0 | 1,560 (+7%) | 7mo | $169,500 | $109 | 58 |
| 1714 S Jackson St | 0.36mi | 3/2.5 | 1,661 (+14%) | 3mo | $239,900 | $144 | 56 |
| 1704 Witt Dr | 0.67mi | 3/1.0 | 1,482 (+1%) | 10mo | $150,000 | $101 | 54 |
| 1601 Ely Dr | 0.65mi | 3/2.0 | 1,300 (-11%) | 1mo | $179,900 | $138 | 50 |
| 300 W Pine St | 0.54mi | 3/2.0 | 1,250 (-15%) | 4mo | $75,000 | $60 | 47 |
| 1405 S Schrock St | 0.65mi | 3/2.0 | 1,266 (-14%) | 1mo | $159,500 | $126 | 47 |
| 1707 S Witt Dr | 0.71mi | 4/2.5 (+1) | 1,272 (-13%) | 10mo | $153,900 | $121 | 30 |
Match score weights: distance 35% · size 25% · config 20% · recency 20%. Top-matched comps best support the ARV.
Projected returns pro-forma
10.0% appreciation · 3.0% rent growth · sell at horizon
- IRR
- 24.9%
- Equity multiple
- 2.99×
- Total profit
- $101,740
- Equity at exit
- $164,410
- IRR
- 22.0%
- Equity multiple
- 6.82×
- Total profit
- $297,562
- Equity at exit
- $354,557
Cash invested: $51,100 (down + closing). Projections, not guarantees.
Landlord ↔ Tenant lean methodology
- Overall (STATE)
- 81 Strongly Landlord-Friendly
- State Missouri
- 81 Strongly Landlord-Friendly · R+10
- County
- — inherits STATE
- City
- — inherits STATE
ZIP-level market 64744
- Home prices YoY
- 5.2%
- Active inventory
- 81
- Price-to-rent
- 10.5×
Monthly cashflow live
- Estimated rent
- $1,450 medium interval (Pro) →
- Mortgage (P&I)
- −$957
- Tax from tax record
- −$74 /mo · $893/yr
- Insurance
- −$76
- HOA
- −$0
- Vacancy / Maint / Mgmt
- −$304
- Net cashflow
- $38
Break-even live
UW: 25.0% down · 7.5% · 30yr · 1.5% tax · 5.0% vac · 8.0% maint · 8.0% mgmt
Financing live
Cash to close
- Down payment
- $45,625
- Closing costs
- $5,475
- Reserves months
- —
- Total cash needed
- —
Loan-product check · same deal, 3 products live
Conventional
25% down · 7.5% · 30yr
- Down + closing
- —
- Monthly P&I
- —
- Monthly cashflow
- —
- DSCR
- —
- Eligible?
- —
Personal DTI + credit; lowest rate.
DSCR
20% down · 8.5% · 30yr
- Down + closing
- —
- Monthly P&I
- —
- Monthly cashflow
- —
- DSCR
- —
- Eligible?
- —
No personal income docs; deal must DSCR.
Hard money
10% down · 12.0% · 12mo
- Down + closing
- —
- Monthly P&I
- —
- Monthly cashflow
- —
- DSCR
- —
- Eligible?
- —
Short-term bridge; refi at stabilization.
Rent comps 1 comps
| Address | Beds | Baths | Sqft | Rent | $/sqft | DOM | Units | Dist |
|---|---|---|---|---|---|---|---|---|
| 410 S Ohio St El Dorado Springs, MO | 3.0 | 2.0 | 1020 | $1,450 | $1.42 | 43d | 1 | 0.80mi |
Listing history 12 events
-
2026-06-18days on market $182,500 Active 11 DOM
-
2026-06-17days on market $182,500 Active 10 DOM
-
2026-06-16days on market $182,500 Active 9 DOM
-
2026-06-15days on market $182,500 Active 8 DOM
-
2026-06-13days on market $182,500 Active 6 DOM
-
2026-06-12days on market $182,500 Active 5 DOM
-
2026-06-09days on market $182,500 Active 2 DOM
-
2026-06-08statusdays on market $182,500 Active 1 DOM
-
2026-06-07days on market $182,500 Coming Soon 4 DOM
-
2026-06-07days on market $182,500 Coming Soon 3 DOM
-
2026-06-04remarks 699-char remark
-
2026-06-04$182,500 Coming Soon 1 DOM
ⓘ Source: listings_history table (triggers on properties + properties_extension) + one-shot
backfill from property_details.listing_events for pre-trigger history.
Tax reassessment forecast MO · Resets to sale price
- Current annual tax
- $893 · $74/mo
- Projected year-2 tax
- $1,770 · $148/mo
- Expected delta
- +$877/yr (+$73/mo · 98.2%)
ⓘ Screening estimate from a state-policy table — verify with the county assessor before closing.
Climate risk First Street
- Flood 1/10 Low FEMA zone X (unshaded) · 0% chance over 30 yrs
- Wildfire 4/10 Moderate
- Heat 5/10 Major 7 d/yr ≥108°F today · 18 d/yr by 30 yrs out
- Wind 2/10 Low 100% chance of damaging wind over 30 yrs
- Air quality 2/10 Low 0 unhealthy d/yr today · 1 by 30 yrs out
Nearby sold comps map
Loading sold comps map…
Walkable amenities ~0.75 mi
Loading nearby amenities…
Taxation est. · year 1
- Rental income
- $17,400
- − Mortgage interest
- −$10,223
- − Property taxes
- −$893
- − Insurance
- −$912
- − Repairs & maintenance
- −$1,392
- − Management
- −$1,392
- − Depreciation
- −$5,309
- Taxable loss
- −$2,722
- Est. tax savings @ 24.0%
- +$653
- After-tax cash flow
- $1,109/yr
For passive investors: Depreciation is non-cash, so a rental often shows a tax loss while cash-flowing — sheltering income. Rental losses are passive: they offset passive income freely, and up to $25,000/yr can offset ordinary (W-2) income if you actively participate and your MAGI is under $100k (phasing out to $0 by $150k); unused losses carry forward. On sale, claimed depreciation is recaptured at up to 25%, and gains may owe capital-gains tax (a 1031 exchange can defer both). Figures are a year-1 estimate at your 24.0% rate — not tax advice; consult a CPA.
Schools (NCES district)
- District
- El Dorado Springs R-II
- NCES district ID
- 2911310
- Math proficiency
- 25% ▼ -5.00%
- Reading proficiency
- 34% ▼ -5.00%
- Median HH income
- $31,880
- Composite
- 24.02/100
- National rank
- #7772
- State rank
- #279 of 324 in MO
Livability — El Dorado Springs
- Score
- 62/100
- State rank
- #370
- US rank
- #16324
Category grades
Schools grade is shown separately in the Schools card above.
Census & demographics
- Census place
- El Dorado Springs, MO
- Population (ZIP)
- 8,547
Population outlook (Cedar County) Hauer SSP2
- Today (2025)
- 13,424 people
- By 2030
- 13,080 · -2.6%
- By 2040
- 12,434 · -7.4%
- By 2050
- 11,841 · -11.8%
- By 2075
- 10,171 · -24.2%
- By 2100
- 7,744 · -42.3%
Race, ethnicity, and origin ACS 2023
- Neighborhood character
- Predominantly White (95%)
- Race & ethnicity
- White 95% Two or more races 4%
- Common ancestry
- Italian 6% Iranian 3% Romanian 3%
- Foreign-born
- 1% · Canada
- Languages at home
- 94% English-only · German/W. Germanic 5% Spanish 1%
Political lean MEDSL · Cedar
- 2024 margin
- Solid R (+69.6) · D 14.8% · R 84.4%
- 2008→2024 swing
- -36.0pp toward R · 2008: -33.6pp · 2024: -69.6pp
- All cycles
- 2024: R+69.6 2020: R+65.9 2016: R+63.9 2012: R+47.0 2008: R+33.6
Not yet ingested
- Civics
- —
Market trends
- HPI YoY
- ▲ 11.88%
- Current HPI
- 242.0421
- Rent YoY
- —
- Metro
- —
- State GDP YoY
- ▲ 1.84%
- F500 in state
- 20
Industry mix (Fortune 500 HQ in MO)
| Industry | F500 HQs | Revenue |
|---|---|---|
| Healthcare | 1 | $163B |
|
||
| Insurance | 1 | $21B |
|
||
| Industrial Technology | 1 | $17B |
|
||
| Retail | 1 | $16B |
|
||
| Industrial Distribution | 1 | $10B |
|
||
| Utilities | 1 | $9B |
|
||
Price history
+103.0% since first listed6 events — show timeline
- 2026-06-04 Coming Soon $182,500 Heartland MLS as Distributed by MLS Grid
- 2016-12-12 Sold (Public Records) — Public Records
- 2016-12-09 Sold (MLS) — SOMO
- 2016-12-09 Sold (MLS) — Heartland MLS as Distributed by MLS Grid
- 2016-09-06 Listed $89,900 SOMO
- 2016-06-29 Listed $89,900 Heartland MLS as Distributed by MLS Grid
Property tax history
+2.3%/yrLatest (2025): $893 · -2.4% YoY. Source: county tax records.
Cash-flow waterfall
monthlySold comps — $/sqft
last 12 mo · ≤1 miLoading sold comps…