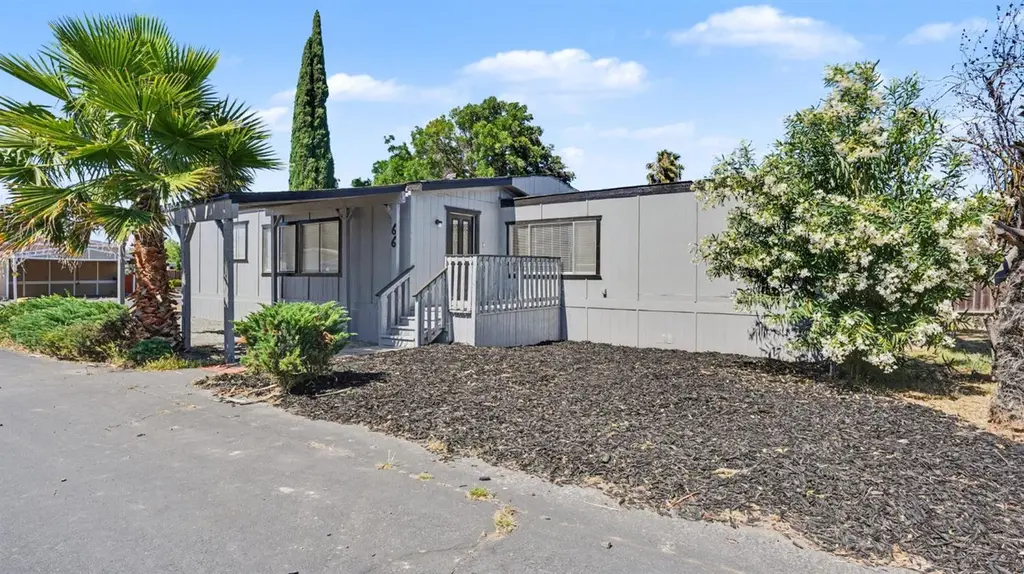
4399 Aplicella Ct #66 · Manteca, CA
Flood risk 5/10 · Moderate
- FEMA flood zone
- X
- Chance of flooding over 30 yrs
- 0.27%
- Est. flood insurance / yr
- $507 – $1,088
Fire risk 5/10 · Moderate
- Est. fire insurance / yr
- $659 – $1,223
Heat risk 6/10 · Moderate
- Hot days now (above 103°F)
- 7 days/yr
- Hot days in 30 yrs
- 15 days/yr
Wind risk 1/10 · Minimal
- Chance of severe wind over 30 yrs
- —
Air-quality risk 10/10 · Severe
- Unhealthy air days now
- 25 days/yr
- Unhealthy air days in 30 yrs
- 25 days/yr
Risk factors via First Street. Map © Google.
Why this score? — see what drove the B+ grade
The composite is a weighted blend of 9 inputs, each scored 0–100. Each bar is that input's sub-score; the figure is the points it added to the 100-point composite (weight × sub-score).
- Cash flow +30.0/30.0
- ARV discount +15.0/15.0
- 1% rule +10.0/10.0
- DSCR +10.0/10.0
- Condition / age +3.8/5.0
- Livability +3.1/5.0
- Schools +2.9/10.0
- Rent growth +2.7/5.0
- Appreciation +0.0/10.0
$179,950
🖨 Deal sheet 📄 Offer letter ✓ Due diligence
Listing remarks
Rare opportunity to own a spacious 1977 Royal Monarch triple wide located in the desirable Oakwood Lake MHP! This 3 bedroom, 2 bathroom home offers an expansive layout with formal living and dining areas, a cozy fireplace, and a built-in bar area perfect for entertaining. The kitchen features modern white cabinetry, ample counter space, and plenty of storage. The spacious primary suite includes an ensuite bathroom with double sinks and a relaxing sunken tub. Additional highlights include a large laundry room area and generously sized living spaces throughout. Enjoy comfortable living in a well-established community with an affordable space rent of just $1,195 per month. This unique triple w
Key facts
- Double sinks
- Ample counter space
- Built-in bar area
Tags
Property features AI
Finance
- Other: Located in Oakwood Lake Mobile Home Community (space #66)
- Financial info: Land lease: No
- HOA & community: No homeowners association
Exterior
- Parking: Assigned parking
- Utilities: Electric service: Other; Public sewer; Public water
- Home design: Manufactured home in park; Triple-wide; Built in 1977; Manufacturer: LAKEWOOD (Royal Monarch)
- Construction: Wood skirting; Composition roof
- Exterior features: Composition roof; Wood skirting
Interior
- Kitchen: Free standing gas range; Free standing refrigerator; Range hood; Synthetic countertops
- Bedrooms: 3 bedrooms
- Flooring: Carpet
- Bathrooms: 2 full bathrooms; Sunken tub
- Heating & cooling: Wood-burning fireplace in living room
- Interior features: Wet bar; Great room; Formal dining area; Synthetic kitchen counters; Unfurnished
- Laundry & utility: Washer/dryer hookups only
Neighborhood map
What this means for you Summary
Snapshot
- This is a 3-bed/2.0-bath manufactured listed at $180k. Condition is rated good.
Deal economics
- At list price, monthly cash flow is $1k ($15k/yr) — positive.
- The deal already cash-flows at list — no discount required.
- Meets the 1% rule at list price ($3k rent vs $180k).
- Recommended offer: $177k (1.5% below list) — sets the bar for market timing.
- Cap rate 14.8% vs local median 2.7% in Manteca — top-decile yield for the area; either an underpriced asset or a hidden risk that comps aren't pricing in. Stress-test before assuming the spread holds.
Location & tenants
- Location reads 61/100 on livability (#535 in CA) — a middle-class / working-renter tenant base. Strengths: housing A+, employment A; Watch: schools D+, amenities D, commute F.
- Manteca Unified (suburban): math 15% / reading 48% proficiency, ranked #297 of 517 in CA (top 57%) — families likely to look elsewhere, expect single-tenant / working-renter base with shorter leases.
- Market conditions: Rents flat; 387 active listings in the ZIP; 8 comparable units currently listed for rent nearby; rentals at typical pace (median 21d on market — plan ~3-4 weeks tenant-placement turnaround); high-income renter base; 3,779 units permitted in San Joaquin County in 2024 (0 in 5+ unit buildings).
- This rent runs 33% of the median local income ($117k/yr) — at the standard rent-burdened threshold; future hikes will face affordability resistance.
Forward outlook
- Local home prices are declining (-3.0%/yr); year-one equity from $1k of loan paydown is wiped out by about $5k of value loss. Plan a longer hold.
- San Joaquin County population projected at +17% by 2050 — long-run rental-demand tailwind backs the buy-and-hold thesis.
- At projected returns (-3.0% appreciation + 0.8% rent growth), your $50k cash investment doubles in ~5 years — after that, you're playing with house money.
Negotiation context
- It's been on market 27 days — a 2% lower offer ($177k) is reasonable based on typical stale-listing flexibility.
Risks & watch-outs
- Climate carrying-cost: moderate flood risk; moderate wildfire risk; extreme-heat days projected 7→15/yr by 2055 (HVAC capex compounding) — expect insurance premiums to compound above CPI over the hold.
Questions for the listing agent
- Built in 1977 — when were the roof, HVAC, electrical panel, plumbing, and water heater last replaced?
- Is there a deadline driving the sale (1031 exchange, divorce, estate, relocation)? That informs how much negotiation room exists.
- Schools are D-rated, which usually means shorter tenancies and higher turnover. Who's the typical renter profile here, and what's been the actual vacancy rate?
- What's the average days-on-market for RENTAL listings here right now (not sales)? A rising rental-DOM trend means longer vacancies and softer asking-rent achievability than the comps imply.
- What's the recent tenant-quality profile in this submarket — average credit score on applications, eviction rate, late-payment / NSF rate, and stable-employment percentage? A property-management company in the area should have these aggregated.
- How much new for-sale + rental construction is in the pipeline within 1–3 miles? Heavy new supply typically softens prices + rents 12–24 months out; constrained supply supports both.
Investment metrics
- 1% rule
- 1.77% ✓
- Cap rate
- 14.82%
- Cash-on-cash
- 30.46%
- DSCR
- 2.36
- GRM
- 4.7
CMA / ARV
- ARV (on-the-fly)
- $220,320
- Comps found
- 6
Show comp detail 6 sales within ~0.75 mi
| Address | Dist | Beds/Ba | Sqft | Sold | Price | $/sf | Match |
|---|---|---|---|---|---|---|---|
| 4399 Aplicella Ct #64 | 0.06mi | 2/2.0 (-1) | 2,040 (0%) | 17mo | $114,800 | $56 | 78 |
| 4399 Aplicella Ct #62 | 0.00mi | 3/2.0 | 2,304 (+13%) | 8mo | $190,000 | $82 | 72 |
| 4399 Aplicella Ct #57 | 0.06mi | 3/2.0 | 1,946 (-5%) | 24mo | $211,000 | $108 | 70 |
| 4399 Aplicella Ct #20 | 0.00mi | 3/2.0 | 1,772 (-13%) | 17mo | $140,000 | $79 | 64 |
| 4399 Aplicella Ct #52 | 0.06mi | 3/2.0 | 1,740 (-15%) | 17mo | $240,000 | $138 | 58 |
| 788 E Willow Ave | 0.29mi | 3/3.0 | 1,782 (-13%) | 5mo | $550,000 | $309 | 58 |
Match score weights: distance 35% · size 25% · config 20% · recency 20%. Top-matched comps best support the ARV.
Projected returns pro-forma
-3.0% appreciation · 0.82% rent growth · sell at horizon
- IRR
- 22.6%
- Equity multiple
- 1.90×
- Total profit
- $45,484
- Equity at exit
- $26,831
- IRR
- 29.2%
- Equity multiple
- 3.34×
- Total profit
- $117,757
- Equity at exit
- $15,559
Cash invested: $50,386 (down + closing). Projections, not guarantees.
Landlord ↔ Tenant lean methodology
- Overall (STATE)
- 18 Strongly Tenant-Friendly
- State California
- 18 Strongly Tenant-Friendly · D+13
- County
- — inherits STATE
- City
- — inherits STATE
ZIP-level market 95337
- Rents YoY
- 0.8%
- Active inventory
- 387
- Price-to-rent
- 4.7×
Monthly cashflow live
- Estimated rent
- $3,193 high interval (Pro) →
- Mortgage (P&I)
- −$944
- Tax est. 1.5%
- −$225 /mo · $2,699/yr
- Insurance
- −$75
- HOA
- −$0
- Vacancy / Maint / Mgmt
- −$671
- Net cashflow
- $1,279
Break-even live
UW: 25.0% down · 7.5% · 30yr · 1.5% tax · 5.0% vac · 8.0% maint · 8.0% mgmt
Financing live
Cash to close
- Down payment
- $44,988
- Closing costs
- $5,398
- Reserves months
- —
- Total cash needed
- —
Loan-product check · same deal, 3 products live
Conventional
25% down · 7.5% · 30yr
- Down + closing
- —
- Monthly P&I
- —
- Monthly cashflow
- —
- DSCR
- —
- Eligible?
- —
Personal DTI + credit; lowest rate.
DSCR
20% down · 8.5% · 30yr
- Down + closing
- —
- Monthly P&I
- —
- Monthly cashflow
- —
- DSCR
- —
- Eligible?
- —
No personal income docs; deal must DSCR.
Hard money
10% down · 12.0% · 12mo
- Down + closing
- —
- Monthly P&I
- —
- Monthly cashflow
- —
- DSCR
- —
- Eligible?
- —
Short-term bridge; refi at stabilization.
Rent comps 8 comps
| Address | Beds | Baths | Sqft | Rent | $/sqft | DOM | Units | Dist |
|---|---|---|---|---|---|---|---|---|
| 1440 Riva Trigoso Dr Manteca, CA | 4.0 | 2.5 | 2292 | $3,200 | $1.40 | 43d | 1 | 0.32mi |
| 3311 W Woodward Ave Manteca, CA | 4.0 | 3.5 | 2711 | $3,385 | $1.25 | 19d | 1 | 1.10mi |
| 3284 Oak Trail Dr Manteca, CA | 4.0 | 3.0 | 2996 | $3,195 | $1.07 | 43d | 1 | 1.14mi |
| 3247 Mesa Oak St Manteca, CA | 4.0 | 2.0 | 2000 | $3,000 | $1.50 | 43d | 1 | 1.16mi |
| 3275 Hayduke St Manteca, CA | 3.0 | 2.5 | 1625 | $2,950 | $1.82 | 3d | 1 | 1.19mi |
| 1912 Medford Ave Manteca, CA | 4.0 | 2.0 | 2102 | $2,945 | $1.40 | 21d | 1 | 1.35mi |
| 3137 Barnowl Way Manteca, CA | 4.0 | 3.0 | 2463 | $2,999 | $1.22 | 14d | 1 | 1.35mi |
| 3129 Ballena St Manteca, CA | 4.0 | 3.0 | 2100 | $2,950 | $1.40 | 3d | 1 | 1.37mi |
Listing history 16 events
-
2026-06-19price $179,950 Active 27 DOM
-
2026-06-18days on market $189,950 Active 27 DOM
-
2026-06-17days on market $189,950 Active 26 DOM
-
2026-06-16days on market $189,950 Active 25 DOM
-
2026-06-15days on market $189,950 Active 24 DOM
-
2026-06-14days on market $189,950 Active 22 DOM
-
2026-06-13days on market $189,950 Active 21 DOM
-
2026-06-10days on market $189,950 Active 19 DOM
-
2026-06-09days on market $189,950 Active 18 DOM
-
2026-06-08days on market $189,950 Active 17 DOM
-
2026-06-07days on market $189,950 Active 16 DOM
-
2026-06-05days on market $189,950 Active 13 DOM
-
2026-06-03days on market $189,950 Active 12 DOM
-
2026-06-03days on market $189,950 Active 11 DOM
-
2026-06-01days on market $189,950 Active 10 DOM
-
2026-05-31days on market $189,950 Active 9 DOM
ⓘ Source: listings_history table (triggers on properties + properties_extension) + one-shot
backfill from property_details.listing_events for pre-trigger history.
Climate risk First Street
- Flood 5/10 Major FEMA zone X · 27% chance over 30 yrs
- Wildfire 5/10 Major
- Heat 6/10 Major 7 d/yr ≥103°F today · 15 d/yr by 30 yrs out
- Wind 1/10 Low
- Air quality 10/10 Extreme 25 unhealthy d/yr today · 25 by 30 yrs out
Nearby sold comps map
Loading sold comps map…
Walkable amenities ~0.75 mi
Loading nearby amenities…
Taxation est. · year 1
- Rental income
- $38,315
- − Mortgage interest
- −$10,080
- − Property taxes
- −$2,699
- − Insurance
- −$900
- − Repairs & maintenance
- −$3,065
- − Management
- −$3,065
- − Depreciation
- −$5,235
- Taxable income
- $13,271
- Est. tax owed @ 24.0%
- −$3,185
- After-tax cash flow
- $12,161/yr
For passive investors: Depreciation is non-cash, so a rental often shows a tax loss while cash-flowing — sheltering income. Rental losses are passive: they offset passive income freely, and up to $25,000/yr can offset ordinary (W-2) income if you actively participate and your MAGI is under $100k (phasing out to $0 by $150k); unused losses carry forward. On sale, claimed depreciation is recaptured at up to 25%, and gains may owe capital-gains tax (a 1031 exchange can defer both). Figures are a year-1 estimate at your 24.0% rate — not tax advice; consult a CPA.
Condition & rehab AI · 30 photos
This 1977 Royal Monarch triple wide is in good condition with a good condition score of 75. It offers a spacious layout with modern amenities and is located in a desirable community. The home is move-in ready with minor cosmetic updates needed to enhance its curb appeal and resale value.
Value-add opportunities
- Both paint exterior — enhances curb appeal and resale value
- Both replace carpet — improves comfort and aesthetics
Renovation cost estimate screening
Value-add ROI direction
- Both paint exterior — enhances curb appeal and resale value ↑
- Both replace carpet — improves comfort and aesthetics ↑
ⓘ Cost ranges are severity-bucket heuristics (US national rule-of-thumb). Get contractor quotes + a written scope before underwriting a rehab budget.
Schools (NCES district)
- District
- Manteca Unified
- NCES district ID
- 0623610
- Math proficiency
- 15% ▼ -14.00%
- Reading proficiency
- 48% ▬ 0.00%
- Median HH income
- $62,426
- Composite
- 28.5/100
- National rank
- #6737
- State rank
- #297 of 517 in CA
Livability — Manteca
- Score
- 61/100
- State rank
- #535
- US rank
- #17877
Category grades
Schools grade is shown separately in the Schools card above.
Census & demographics
- County
- San Joaquin County · 729,570 people
- City population
- 98,916
- Metro
- Stockton, CA
- Population (ZIP)
- 48,731
- Household income
- $117,137
- Rent vs Own
- Severe rent burden
- 880.0
Population outlook (San Joaquin County) Hauer SSP2
- Today (2025)
- 796,965 people
- By 2030
- 828,849 · +4.0%
- By 2040
- 885,611 · +11.1%
- By 2050
- 929,798 · +16.7%
- By 2075
- 994,578 · +24.8%
- By 2100
- 971,291 · +21.9%
Race, ethnicity, and origin ACS 2023
- Neighborhood character
- Highly diverse neighborhood (Simpson 0.73)
- Race & ethnicity
- Hispanic / Latino 38% White 29% Two or more races 23% Asian 21% Black 4% Pacific Islander 2%
- Hispanic origin (detail)
- Mexican 32%
- Common ancestry
- Russian 4% Italian 2% Lithuanian 1%
- Foreign-born
- 25% · Canada, China
- Languages at home
- 61% English-only · Spanish 18% Other Indo-European 11% Tagalog/Filipino 4%
Political lean MEDSL · San Joaquin
- 2024 margin
- Toss-up / Even · D 48.0% · R 48.9% · Other 3.0%
- 2008→2024 swing
- -11.6pp toward R · 2008: 10.7pp · 2024: -0.9pp
- All cycles
- 2024: R+0.9 2020: D+13.9 2016: D+12.9 2012: D+8.9 2008: D+10.7
Not yet ingested
- Civics
- —
Market trends
- HPI YoY
- ▼ -481.88%
- Current HPI
- 273.9008
- Rent YoY
- ▲ 0.82%
- Metro
- Stockton, CA
- State GDP YoY
- ▲ 3.21%
- F500 in state
- 116
Industry mix (Fortune 500 HQ in CA)
| Industry | F500 HQs | Revenue |
|---|---|---|
| Technology | 27 | $1,492B |
|
||
| Financial Services | 3 | $174B |
|
||
| Retail | 3 | $44B |
|
||
| Insurance | 3 | $26B |
|
||
| Media / Entertainment | 2 | $115B |
|
||
| Pharmaceuticals / Biotech | 2 | $62B |
|
||
Cash-flow waterfall
monthlySold comps — $/sqft
last 12 mo · ≤1 miLoading sold comps…