 🏷️ Likely Rental
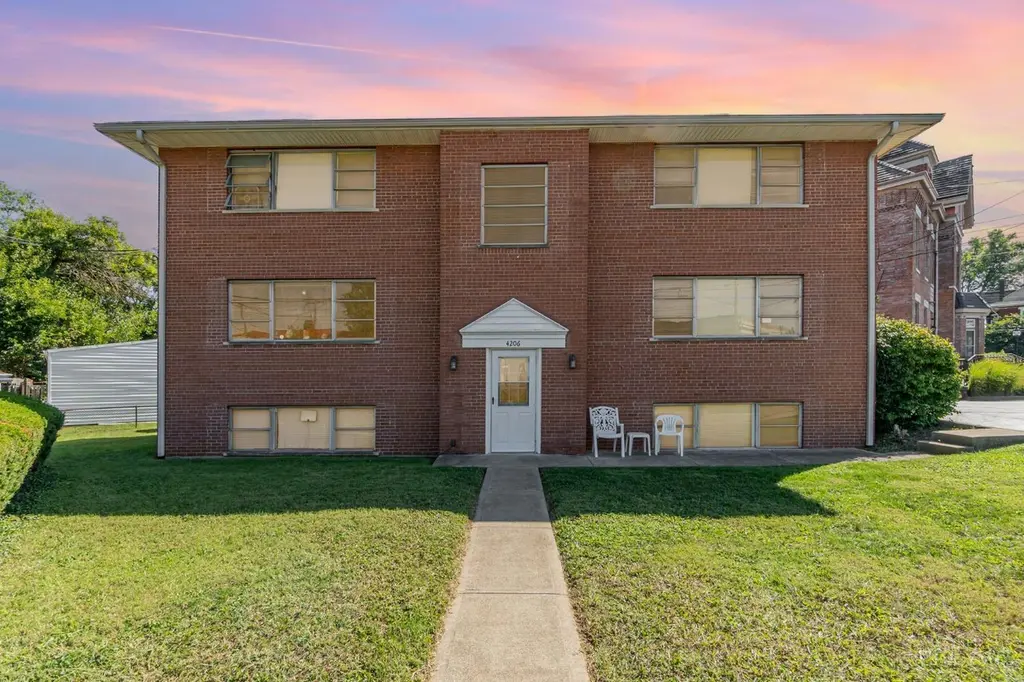
4206 Lafayette Ave · Norwood, OH
Flood risk 5/10 · Moderate
- FEMA flood zone
- X (unshaded)
- Chance of flooding over 30 yrs
- 0.68%
- Est. flood insurance / yr
- $507 – $1,088
Fire risk 1/10 · Minimal
- Est. fire insurance / yr
- $713 – $1,323
Heat risk 5/10 · Moderate
- Hot days now (above 103°F)
- 7 days/yr
- Hot days in 30 yrs
- 19 days/yr
Wind risk 2/10 · Minimal
- Chance of severe wind over 30 yrs
- 1.0%
Air-quality risk 3/10 · Minor
- Unhealthy air days now
- 2 days/yr
- Unhealthy air days in 30 yrs
- 3 days/yr
Risk factors via First Street. Map © Google.
Why this score? — see what drove the B+ grade
The composite is a weighted blend of 9 inputs, each scored 0–100. Each bar is that input's sub-score; the figure is the points it added to the 100-point composite (weight × sub-score).
- Cash flow +30.0/30.0
- ARV discount +15.0/15.0
- 1% rule +10.0/10.0
- DSCR +10.0/10.0
- Livability +4.0/5.0
- Schools +3.7/10.0
- Rent growth +2.6/5.0
- Condition / age +2.5/5.0
- Appreciation +0.0/10.0
$312,000
🖨 Deal sheet 📄 Offer letter ✓ Due diligence
Multi-family units
County records classify this as Multi-Family (5+ Unit). Listing-text estimate: 5 units. confirmed
5+ unit building — per-unit beds/baths from public records are typically unavailable; the breakdown below (if shown) is an estimate from the listing text.
Listing remarks
Fantastic Location: 5 Unit Investment Opportunity in Norwood. All 5 Units are efficiency Units. All 5 Units are rented. The current tenants are on MTM. Near Busline. Boiler 2014 Heat and water paid by Owner. Electric paid by tenants all on separate meters. Storage units for each tenant located in the basement. 24 hour notice for all showings.
Key facts
- Boiler 2014
- Off street parking
- Storage units
Tags
Property features AI
Finance
- Financial info: Total units: 5; All units are efficiencies; Typical efficiency rent: $490
Exterior
- Parking: Off-street parking; Approximately 5 open parking spaces
- Utilities: Public sewer; Water at street; Owner pays water
- Home design: Multi-family property; Three or more levels
- Construction: Brick construction; Shingle roof; Poured foundation; Built as a single building with multiple units
- Exterior features: Patio; Busline nearby
Interior
- Kitchen: No kitchen-specific appliance data provided
- Bedrooms: Five efficiency units
- Heating & cooling: Hot water heating (owner pays heat); Wall unit cooling; Separate gas/electric meters (yes); Separate A/C available (yes)
- Interior features: Storage area; Full basement; Coin laundry
- Laundry & utility: On-site coin laundry
Neighborhood map
What this means for you Summary
Snapshot
- This is a 5 × 1-bed/1-bath units multifamily listed at $312k.
Deal economics
- At list price, monthly cash flow is $2k ($25k/yr) — positive. Per door: $419/mo.
- The deal already cash-flows at list — no discount required.
- Meets the 1% rule at list price ($5k rent vs $312k).
- Recommended offer: $275k (12.0% below list) — sets the bar for market timing.
- Cap rate 14.3% vs local median 4.7% in Norwood — top-decile yield for the area; either an underpriced asset or a hidden risk that comps aren't pricing in. Stress-test before assuming the spread holds.
Location & tenants
- Location reads 79/100 on livability (#154 in OH, #2,322 nationally) — a middle-class / working-renter tenant base. Strengths: commute A+, cost of living A+, housing A+; Watch: crime C-, employment C-, amenities D+.
- Norwood City (suburban): math 35% / reading 53% proficiency, ranked #513 of 656 in OH (top 78%) — families likely to look elsewhere, expect single-tenant / working-renter base with shorter leases; 62% free/reduced lunch — lower-income household profile, screen leases tightly.
- Market conditions: Rents flat; 56 active listings in the ZIP; 40 comparable units currently listed for rent nearby; rentals at typical pace (median 24d on market — plan ~3-4 weeks tenant-placement turnaround); 801 units permitted in Hamilton County in 2024 (190 in 5+ unit buildings).
- At $5,446/mo this rent would consume 90% of the median local household income ($72k/yr) (locally 1192% of renters already pay >50% of income on rent) — very limited rent-growth headroom before tenants either downsize or default.
Forward outlook
- Local home prices are declining (-3.0%/yr); year-one equity from $2k of loan paydown is wiped out by about $9k of value loss. Plan a longer hold.
- At projected returns (-3.0% appreciation + 0.2% rent growth), your $87k cash investment doubles in ~5 years — after that, you're playing with house money.
Negotiation context
- It's been on market 248 days — a 12% lower offer ($275k) is reasonable based on typical stale-listing flexibility.
- 3 sale attempts; this cycle's ask has dropped $78k (20%) from the opening price — seller is motivated, your offer sets the floor, not the list.
- Current owner paid $97k; list at $312k implies a 222% gain — meaningful room to come down on a strong offer.
Risks & watch-outs
- Climate carrying-cost: moderate flood risk; extreme-heat days projected 7→19/yr by 2055 (HVAC capex compounding) — expect insurance premiums to compound above CPI over the hold.
Questions for the listing agent
- It's been on market 248 days. Have you received any prior offers? Is the seller open to a 12% concession, seller financing, or rate buy-down credit?
- Can we see the unit-by-unit rent roll, current vacancy, and any below-market leases? What's the average tenancy length?
- What capital expenditures (roof, boiler, parking lot, exteriors) have been made in the last 5 years, and what's planned in the next 2?
- Built in 1960 — when were the roof, HVAC, electrical panel, plumbing, and water heater last replaced?
- Why hasn't it sold? Are there any deal-killer items the seller is aware of (foundation, flood, title, zoning, code violations)?
- Is there a deadline driving the sale (1031 exchange, divorce, estate, relocation)? That informs how much negotiation room exists.
- Schools are B-rated — typically a magnet for longer-tenancy family renters. What's the average tenant stay here, and is there a school-zone premium baked into asking?
- What's the average days-on-market for RENTAL listings here right now (not sales)? A rising rental-DOM trend means longer vacancies and softer asking-rent achievability than the comps imply.
- What's the recent tenant-quality profile in this submarket — average credit score on applications, eviction rate, late-payment / NSF rate, and stable-employment percentage? A property-management company in the area should have these aggregated.
- How much new apartment / multifamily construction is in the pipeline within 1–3 miles? Heavy new supply (>2% of stock underway) typically softens rents 12–24 months out; light construction supports rent growth.
Investment metrics
- 1% rule
- 1.75% ✓
- Cap rate
- 14.35%
- Cash-on-cash
- 28.76%
- DSCR
- 2.28
- GRM
- 4.8
CMA / ARV
- ARV (median comp)
- $417,617
- List price
- $312,000
- Delta
- -25.29%
- Verdict
- UNDERPRICED
- Comps
- 20 within 1.0 mi
Show comp detail 12 sales within ~0.75 mi
| Address | Dist | Beds/Ba | Sqft | Sold | Price | $/sf | Match |
|---|---|---|---|---|---|---|---|
| 2010 Hopkins Ave | 0.10mi | 6/3.0 | 3,178 | 3mo | $367,500 | $116 | 81 |
| 2119 Slane Ave | 0.13mi | 6/2.0 | 2,573 | 2mo | $345,000 | $134 | 80 |
| 2241 Cameron Ave | 0.19mi | 6/4.0 | 4,028 | 3mo | $538,500 | $134 | 76 |
| 4005 Ivanhoe Ave | 0.33mi | 5/2.0 | 1,927 | 3mo | $160,000 | $83 | 70 |
| 2011 Hudson Ave | 0.43mi | 3/3.0 | — | 0mo | $268,000 | — | 67 |
| 1930 Hudson Ave | 0.43mi | 4/3.0 | 2,590 | 2mo | $370,000 | $143 | 66 |
| 2421 Hudson Ave | 0.50mi | 4/2.0 | 2,676 | 0mo | $367,000 | $137 | 64 |
| 2018 Elm Ave | 0.51mi | 6/3.0 | 3,915 | 1mo | $390,000 | $100 | 63 |
| 1762 Cleveland Ave | 0.51mi | 8/— | — | 2mo | $454,190 | — | 62 |
| 3914 S Madison Ave | 0.54mi | 3/3.0 | 2,949 | 2mo | $415,000 | $141 | 60 |
| 1907 Crown Ave | 0.65mi | 2/2.0 | 2,381 | 1mo | $220,000 | $92 | 56 |
| 2432 Robertson Ave | 0.74mi | —/— | 2,285 | 2mo | $345,000 | $151 | 51 |
Match score weights: distance 35% · size 25% · config 20% · recency 20%. Top-matched comps best support the ARV.
Projected returns pro-forma
-3.0% appreciation · 0.21% rent growth · sell at horizon
- IRR
- 19.9%
- Equity multiple
- 1.78×
- Total profit
- $68,034
- Equity at exit
- $46,520
- IRR
- 26.1%
- Equity multiple
- 2.99×
- Total profit
- $173,699
- Equity at exit
- $26,976
Cash invested: $87,360 (down + closing). Projections, not guarantees.
Landlord ↔ Tenant lean methodology
- Overall (STATE)
- 73 Landlord-Friendly
- State Ohio
- 73 Landlord-Friendly · R+6
- County
- — inherits STATE
- City
- — inherits STATE
ZIP-level market 45212
- Rents YoY
- 0.2%
- Active inventory
- 56
- Price-to-rent
- 23.9×
Monthly cashflow live
- Estimated rent
- $5,446 high interval (Pro) →
- Mortgage (P&I)
- −$1,636
- Tax from tax record
- −$442 /mo · $5,309/yr
- Insurance
- −$130
- HOA
- −$0
- Vacancy / Maint / Mgmt
- −$1,144
- Net cashflow
- $2,094
Break-even live
5-unit breakdown (identical units grouped — click to expand)
| Units | Beds | Baths | Est. rent |
|---|---|---|---|
| 5× units | 1 | 1 | $5,445 |
| #1 | 1 | 1 | $1,089 |
| #2 | 1 | 1 | $1,089 |
| #3 | 1 | 1 | $1,089 |
| #4 | 1 | 1 | $1,089 |
| #5 | 1 | 1 | $1,089 |
| Total (5 units) | $5,446 | ||
UW: 25.0% down · 7.5% · 30yr · 1.5% tax · 5.0% vac · 8.0% maint · 8.0% mgmt
Financing live
Cash to close
- Down payment
- $78,000
- Closing costs
- $9,360
- Reserves months
- —
- Total cash needed
- —
Loan-product check · same deal, 3 products live
Conventional
25% down · 7.5% · 30yr
- Down + closing
- —
- Monthly P&I
- —
- Monthly cashflow
- —
- DSCR
- —
- Eligible?
- —
Personal DTI + credit; lowest rate.
DSCR
20% down · 8.5% · 30yr
- Down + closing
- —
- Monthly P&I
- —
- Monthly cashflow
- —
- DSCR
- —
- Eligible?
- —
No personal income docs; deal must DSCR.
Hard money
10% down · 12.0% · 12mo
- Down + closing
- —
- Monthly P&I
- —
- Monthly cashflow
- —
- DSCR
- —
- Eligible?
- —
Short-term bridge; refi at stabilization.
Rent comps 40 comps
| Address | Beds | Baths | Sqft | Rent | $/sqft | DOM | Units | Dist |
|---|---|---|---|---|---|---|---|---|
| 4014 Montgomery Rd Cincinnati, OH | 1.0 | 1.0 | 600 | $975 | $1.62 | 43d | 1 | 0.19mi |
| 2022 Williams Ave Unit 5 Cincinnati, OH | 1.0 | 1.0 | 525 | $995 | $1.90 | 4d | 1 | 0.19mi |
| 4010 Montgomery Rd Unit 4 Norwood, OH | 1.0 | 1.0 | 700 | $895 | $1.28 | 2d | 1 | 0.21mi |
| 4303 Allison St Cincinnati, OH | 2.0 | 1.0 | 1070 | $1,495 | $1.40 | 4d | 1 | 0.21mi |
| 2131 Williams Ave Unit 1 Cincinnati, OH | 1.0 | 1.0 | 950 | $1,350 | $1.42 | 4d | 1 | 0.21mi |
| 2131 Williams Ave Unit 1 Cincinnati, OH | 2.0 | 1.0 | 900 | $1,395 | $1.55 | 23d | 1 | 0.21mi |
| 2131 Williams Ave Unit 2 Cincinnati, OH | 1.0 | 1.0 | 950 | $1,250 | $1.32 | 43d | 1 | 0.21mi |
| 2131 Williams Ave Unit 1 Cincinnati, OH | 2.0 | 1.0 | 900 | $1,395 | $1.55 | 43d | 1 | 0.21mi |
| 2131 Williams Ave Unit 2133 Cincinnati, OH | 1.0 | 1.0 | 700 | $1,100 | $1.57 | 17d | 1 | 0.21mi |
| 1922 Hopkins Ave Unit 8 Cincinnati, OH | 1.0 | 1.0 | — | $900 | — | 43d | 1 | 0.22mi |
| 1931 Delaware Ave Unit 2 Norwood, OH | 3.0 | 2.0 | 1650 | $1,810 | $1.10 | 43d | 1 | 0.23mi |
| 2200 Jefferson Ave Norwood, OH | 1.0 | 1.0 | 600 | $975 | $1.62 | 7d | 2 | 0.28mi |
| 3923 Spencer Ave #2 Cincinnati, OH | 3.0 | 1.0 | — | $1,250 | — | 23d | 1 | 0.31mi |
| 3918 Regent Ave Cincinnati, OH | 2.0 | 1.0 | 2778 | $1,250 | $0.45 | 23d | 1 | 0.33mi |
| 4539 Montgomery Rd Unit 2 Cincinnati, OH | 1.0 | 1.0 | 1000 | $1,100 | $1.10 | 43d | 1 | 0.35mi |
| 4539 Montgomery Rd Unit 3 Cincinnati, OH | 2.0 | 1.0 | 1200 | $1,375 | $1.15 | 23d | 1 | 0.35mi |
| 4539 Montgomery Rd Unit 2 Cincinnati, OH | 1.0 | 1.0 | 1000 | $1,100 | $1.10 | 10d | 1 | 0.35mi |
| 4539 Montgomery Rd Unit 3 Cincinnati, OH | 2.0 | 1.0 | 1200 | $1,375 | $1.15 | 10d | 1 | 0.35mi |
| 3901 Elsmere Ave Cincinnati, OH | 3.0 | 2.0 | 1415 | $1,995 | $1.41 | 3d | 1 | 0.36mi |
| 2215 Washington Ave Unit 2 Cincinnati, OH | 1.0 | 1.0 | 677 | $800 | $1.18 | 21d | 1 | 0.38mi |
| 4173 Forest Ave Unit Forest Ave unit RUN- Cincinnati, OH | 1.0 | 1.0 | 757 | $895 | $1.18 | 43d | 1 | 0.39mi |
| 2212 Washington Ave Unit 2 Norwood, OH | 1.0 | 1.0 | 560 | $1,250 | $2.23 | 43d | 1 | 0.41mi |
| 2212 Washington Ave Unit 3 Norwood, OH | 1.0 | 1.0 | — | $875 | — | 43d | 1 | 0.41mi |
| 1815 Cleveland Ave Apt 3 Cincinnati, OH | 1.0 | 1.0 | 1012 | $850 | $0.84 | 23d | 1 | 0.46mi |
| 4133 Huston Ave Cincinnati, OH | 3.0 | 1.0 | 1210 | $1,725 | $1.43 | 43d | 1 | 0.48mi |
| 4133 Huston Ave Cincinnati, OH | 3.0 | 1.0 | 1210 | $1,725 | $1.43 | 12d | 1 | 0.48mi |
| 2516 Williams Ave Unit 2 Cincinnati, OH | 1.0 | 1.0 | 650 | $995 | $1.53 | 43d | 1 | 0.57mi |
| 1911 Elm Ave Unit 2 Cincinnati, OH | 2.0 | 1.0 | 688 | $1,200 | $1.74 | 7d | 1 | 0.58mi |
| 1740 Sherman Ave Unit 5 Cincinnati, OH | 1.0 | 1.0 | — | $750 | — | 17d | 1 | 0.59mi |
| 2320 Kenilworth Ave Cincinnati, OH | 3.0 | 2.5 | 1660 | $2,300 | $1.39 | 20d | 1 | 0.61mi |
| 1701 Cleveland Ave Norwood, OH | 1.0 | 1.0 | 1000 | $1,200 | $1.20 | 23d | 1 | 0.62mi |
| 2539 Leslie Ave Cincinnati, OH | 1.0 | 1.0 | — | $875 | — | 14d | 1 | 0.68mi |
| 2418 Robertson Ave Unit 2 Cincinnati, OH | 1.0 | 1.0 | 800 | $1,250 | $1.56 | 4d | 1 | 0.69mi |
| 2418 Robertson Ave Unit 2 Cincinnati, OH | 1.0 | 1.0 | 800 | $1,450 | $1.81 | 23d | 1 | 0.69mi |
| 1725 Cleneay Ave Norwood, OH | 1.0–5.0 | 1.0–5.0 | 1060 | $1,467 | $1.38 | 1d | 46 | 0.70mi |
| 2420 Kenilworth Ave Unit 2 Norwood, OH | 1.0 | 1.0 | — | $850 | — | 23d | 1 | 0.73mi |
| 2417 Park Ave Cincinnati, OH | 1.0 | 1.0 | 3154 | $1,000 | $0.32 | 43d | 1 | 0.73mi |
| 2607 Robertson Ave Unit 2 ROBERTSON 2607 Cincinnati, OH | 3.0 | 1.0 | 1399 | $1,895 | $1.35 | 43d | 1 | 0.77mi |
| 3627 Montgomery Rd Unit 3627-3 Cincinnati, OH | 3.0 | 1.0 | 850 | $1,375 | $1.62 | 14d | 1 | 0.84mi |
| 1621 Asmann Ave Apt 3 Cincinnati, OH | 2.0 | 1.0 | 850 | $1,195 | $1.41 | 23d | 1 | 0.85mi |
Listing history 24 events
-
2026-06-18days on market $312,000 Active 248 DOM
-
2026-06-17days on market $312,000 Active 247 DOM
-
2026-06-16days on market $312,000 Active 246 DOM
-
2026-06-15days on market $312,000 Active 245 DOM
-
2026-06-13days on market $312,000 Active 243 DOM
-
2026-06-09days on market $312,000 Active 239 DOM
-
2026-06-08days on market $312,000 Active 238 DOM
-
2026-06-07days on market $312,000 Active 237 DOM
-
2026-06-03days on market $312,000 Active 233 DOM
-
2026-06-02days on market $312,000 Active 232 DOM
-
2026-06-01days on market $312,000 Active 231 DOM
-
2026-05-31days on market $312,000 Active 230 DOM
-
2026-05-21price $312,000
-
2026-04-22status Active
-
2026-04-15historical Contingency Pending
-
2026-03-11price $340,000
-
2026-03-06status Active
-
2026-02-20historical Contingency Pending
-
2025-12-31price $369,900
-
2025-10-03$390,000 Active
-
1994-06-20soldstatus $97,000
-
1994-06-20soldstatus $92,000
-
1989-03-09soldstatus $85,000
-
1978-03-01soldstatus $55,000
ⓘ Source: listings_history table (triggers on properties + properties_extension) + one-shot
backfill from property_details.listing_events for pre-trigger history.
Tax reassessment forecast OH · Partial reset (capped growth)
- Current annual tax
- $5,309 · $442/mo
- Projected year-2 tax
- $5,309 · $442/mo
- Expected delta
- $0/yr ($0/mo · 0.0%)
ⓘ Screening estimate from a state-policy table — verify with the county assessor before closing.
Climate risk First Street
- Flood 5/10 Major FEMA zone X (unshaded) · 68% chance over 30 yrs
- Wildfire 1/10 Low
- Heat 5/10 Major 7 d/yr ≥103°F today · 19 d/yr by 30 yrs out
- Wind 2/10 Low 100% chance of damaging wind over 30 yrs
- Air quality 3/10 Moderate 2 unhealthy d/yr today · 3 by 30 yrs out
Nearby sold comps map
Loading sold comps map…
Walkable amenities ~0.75 mi
Loading nearby amenities…
Taxation est. · year 1
- Rental income
- $65,352
- − Mortgage interest
- −$17,477
- − Property taxes
- −$5,309
- − Insurance
- −$1,560
- − Repairs & maintenance
- −$5,228
- − Management
- −$5,228
- − Depreciation
- −$9,076
- Taxable income
- $21,473
- Est. tax owed @ 24.0%
- −$5,154
- After-tax cash flow
- $19,971/yr
For passive investors: Depreciation is non-cash, so a rental often shows a tax loss while cash-flowing — sheltering income. Rental losses are passive: they offset passive income freely, and up to $25,000/yr can offset ordinary (W-2) income if you actively participate and your MAGI is under $100k (phasing out to $0 by $150k); unused losses carry forward. On sale, claimed depreciation is recaptured at up to 25%, and gains may owe capital-gains tax (a 1031 exchange can defer both). Figures are a year-1 estimate at your 24.0% rate — not tax advice; consult a CPA.
Schools (NCES district)
- District
- Norwood City
- NCES district ID
- 3904457
- Math proficiency
- 35% ▼ -24.00%
- Reading proficiency
- 53% ▼ -11.00%
- Median HH income
- $38,750
- Composite
- 36.66/100
- National rank
- #4614
- State rank
- #513 of 656 in OH
Livability — Norwood
- Score
- 79/100
- State rank
- #154
- US rank
- #2322
Category grades
Schools grade is shown separately in the Schools card above.
Census & demographics
- Census place
- Norwood, OH
- County
- Hamilton County · 701,295 people
- City population
- 21,526
- Metro
- Cincinnati, OH-KY-IN
- Population (ZIP)
- 21,526
- Household income
- $72,422
- Rent vs Own
- Severe rent burden
- 1192.0
Population outlook (Hamilton County) Hauer SSP2
- Today (2025)
- 826,054 people
- By 2030
- 830,947 · +0.6%
- By 2040
- 832,319 · +0.8%
- By 2050
- 822,428 · -0.4%
- By 2075
- 788,688 · -4.5%
- By 2100
- 710,674 · -14.0%
Race, ethnicity, and origin ACS 2023
- Neighborhood character
- Predominantly White (73%)
- Race & ethnicity
- White 73% Black 15% Hispanic / Latino 8% Two or more races 5% Asian 1%
- Hispanic origin (detail)
- Mexican 3%
- Common ancestry
- Romanian 2% Lithuanian 1% Slovak 1%
- Foreign-born
- 5% · Canada, China
- Languages at home
- 92% English-only · Spanish 6% Arabic 1% Russian/Polish/Slavic 1%
Political lean MEDSL · Hamilton
- 2024 margin
- D (+14.9) · D 57.0% · R 42.1%
- 2008→2024 swing
- +7.9pp toward D · 2008: 7.0pp · 2024: 14.9pp
- All cycles
- 2024: D+14.9 2020: D+15.9 2016: D+9.5 2012: D+4.9 2008: D+7.0
Not yet ingested
- Civics
- —
Market trends
- HPI YoY
- ▼ -209.95%
- Current HPI
- 295.7088
- Rent YoY
- ▲ 0.21%
- Metro
- Cincinnati, OH-KY-IN
- State GDP YoY
- ▲ 1.98%
- F500 in state
- 48
Industry mix (Fortune 500 HQ in OH)
| Industry | F500 HQs | Revenue |
|---|---|---|
| Insurance | 3 | $145B |
|
||
| Industrial Machinery | 3 | $49B |
|
||
| Financial Services | 3 | $24B |
|
||
| Consumer Goods | 2 | $93B |
|
||
| Aerospace / Defense | 2 | $47B |
|
||
| Utilities | 2 | $33B |
|
||
Price history
+467.3% since first listed12 events — show timeline
- 2026-05-21 Price Changed $312,000 Cincy MLS
- 2026-04-22 Relisted — Cincy MLS
- 2026-04-15 Contingent — Cincy MLS
- 2026-03-11 Price Changed $340,000 Cincy MLS
- 2026-03-06 Relisted — Cincy MLS
- 2026-02-20 Contingent — Cincy MLS
- 2025-12-31 Price Changed $369,900 Cincy MLS
- 2025-10-03 Listed $390,000 Cincy MLS
- 1994-06-20 Sold (Public Records) $92,000 Public Records
- 1994-06-20 Sold (Public Records) $97,000 Public Records
- 1989-03-09 Sold (Public Records) $85,000 Public Records
- 1978-03-01 Sold (Public Records) $55,000 Public Records
Property tax history
+3.0%/yrLatest (2025): $5,309 · +0.3% YoY. Source: county tax records.
Cash-flow waterfall
monthlySold comps — $/sqft
last 12 mo · ≤1 miLoading sold comps…