212 S Oak St · Cridersville, OH
Flood risk 1/10 · Minimal
- FEMA flood zone
- X
- Chance of flooding over 30 yrs
- 0.0%
- Est. flood insurance / yr
- $507 – $1,088
Fire risk 1/10 · Minimal
- Est. fire insurance / yr
- $713 – $1,323
Heat risk 3/10 · Minor
- Hot days now (above 99°F)
- 7 days/yr
- Hot days in 30 yrs
- 18 days/yr
Wind risk 2/10 · Minimal
- Chance of severe wind over 30 yrs
- —
Air-quality risk 2/10 · Minimal
- Unhealthy air days now
- 1 days/yr
- Unhealthy air days in 30 yrs
- 2 days/yr
Risk factors via First Street. Map © Google.
Why this score? — see what drove the B+ grade
The composite is a weighted blend of 9 inputs, each scored 0–100. Each bar is that input's sub-score; the figure is the points it added to the 100-point composite (weight × sub-score).
- Cash flow +30.0/30.0
- ARV discount +15.0/15.0
- 1% rule +10.0/10.0
- DSCR +10.0/10.0
- Schools +5.5/10.0
- Livability +3.6/5.0
- Rent growth +2.5/5.0
- Condition / age +2.5/5.0
- Appreciation +0.0/10.0
$120,000
🖨 Deal sheet 📄 Offer letter ✓ Due diligence
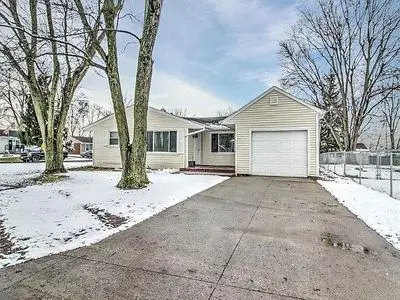
Listing remarks
3-bedroom, 2-bath home offering 1,056 sq ft on a 10,000 sq ft corner lot in a quiet neighborhood, within walking distance to the park and local store. This property was fully renovated in 2018, including updates to the kitchen, bathrooms, flooring, water heater, electrical service, gutters, and most windows. Features a back patio overlooking the yard, providing a great outdoor space. Home is currently occupied with rent-to-own tenants in place who are willing to handle ongoing repairs and updates. Property may need some light cosmetic work. Photos shown are from prior to current occupancy. Great opportunity for an investor seeking a property with tenants already in place.
Key facts
- Updates to kitchen
- Fully renovated
- Outdoor space
Tags
Neighborhood map
What this means for you Summary
Snapshot
- This is a 3-bed/2.0-bath single-family listed at $120k.
Deal economics
- At list price, monthly cash flow is $742 ($9k/yr) — positive.
- The deal already cash-flows at list — no discount required.
- Meets the 1% rule at list price ($2k rent vs $120k).
Location & tenants
- Location reads 72/100 on livability (#391 in OH) — a middle-class / working-renter tenant base. Strengths: crime A+, cost of living A+, housing A+; Watch: employment D+, amenities F, commute F.
- Wapakoneta City (town): math 66% / reading 63% proficiency, ranked #218 of 656 in OH (top 33%) — acceptable for families but not a draw, mixed tenant base, ~2y average lease.
- Market conditions: 49 active listings in the ZIP; 2 comparable units currently listed for rent nearby; solid renter incomes; 121 units permitted in Auglaize County in 2024 (0 in 5+ unit buildings).
Forward outlook
- Local home prices are declining (-3.0%/yr); year-one equity from $830 of loan paydown is wiped out by about $4k of value loss. Plan a longer hold.
- Auglaize County population projected at -12% by 2050 — secular population decline; favor cash flow + early exit over multi-decade hold.
- At projected returns (-3.0% appreciation + 3.0% rent growth), your $34k cash investment doubles in ~5 years — after that, you're playing with house money.
Negotiation context
- Only 1 days on market — expect competitive offers; lowballing is unlikely to land.
- 11 sale attempts since 9y ago with the ask held roughly flat each time — persistent listings suggest the price (not the market) is what's stuck; bring a comps-based counter.
Questions for the listing agent
- Built in 1965 — when were the roof, HVAC, electrical panel, plumbing, and water heater last replaced?
- Is there a deadline driving the sale (1031 exchange, divorce, estate, relocation)? That informs how much negotiation room exists.
- What's the average days-on-market for RENTAL listings here right now (not sales)? A rising rental-DOM trend means longer vacancies and softer asking-rent achievability than the comps imply.
- What's the recent tenant-quality profile in this submarket — average credit score on applications, eviction rate, late-payment / NSF rate, and stable-employment percentage? A property-management company in the area should have these aggregated.
- How much new for-sale + rental construction is in the pipeline within 1–3 miles? Heavy new supply typically softens prices + rents 12–24 months out; constrained supply supports both.
Investment metrics
- 1% rule
- 1.62% ✓
- Cap rate
- 13.71%
- Cash-on-cash
- 26.50%
- DSCR
- 2.18
- GRM
- 5.1
CMA / ARV
- ARV (on-the-fly)
- $157,344
- Comps found
- 7
Show comp detail 7 sales within ~0.75 mi
| Address | Dist | Beds/Ba | Sqft | Sold | Price | $/sf | Match |
|---|---|---|---|---|---|---|---|
| 106 S Oak St | 0.08mi | 2/1.0 (-1) | 1,028 (-3%) | 3mo | $170,000 | $165 | 80 |
| 303 E Main St | 0.15mi | 2/1.0 (-1) | 1,050 (-1%) | 14mo | $73,500 | $70 | 72 |
| 312 S Dixie Hwy | 0.25mi | 2/1.5 (-1) | 1,204 (+14%) | 1mo | $90,000 | $75 | 57 |
| 306 Shawnee Rd | 0.70mi | 3/1.0 | 1,040 (-2%) | 7mo | $155,000 | $149 | 55 |
| 509 Thomas Dr | 0.73mi | 3/1.5 | 1,080 (+2%) | 20mo | $180,000 | $167 | 44 |
| 301 North Pl | 0.61mi | 3/2.0 | 1,209 (+14%) | 8mo | $200,000 | $165 | 41 |
| 307 Wyandot St | 0.58mi | 3/1.0 | 1,200 (+14%) | 17mo | $119,000 | $99 | 32 |
Match score weights: distance 35% · size 25% · config 20% · recency 20%. Top-matched comps best support the ARV.
Projected returns pro-forma
-3.0% appreciation · 3.0% rent growth · sell at horizon
- IRR
- 20.3%
- Equity multiple
- 1.83×
- Total profit
- $27,824
- Equity at exit
- $17,892
- IRR
- 28.5%
- Equity multiple
- 3.53×
- Total profit
- $85,124
- Equity at exit
- $10,375
Cash invested: $33,600 (down + closing). Projections, not guarantees.
Landlord ↔ Tenant lean methodology
- Overall (STATE)
- 73 Landlord-Friendly
- State Ohio
- 73 Landlord-Friendly · R+6
- County
- — inherits STATE
- City
- — inherits STATE
ZIP-level market 45806
- Home prices YoY
- -22.3%
- Active inventory
- 49
- Price-to-rent
- 5.1×
Monthly cashflow live
- Estimated rent
- $1,950 medium interval (Pro) →
- Mortgage (P&I)
- −$629
- Tax from tax record
- −$119 /mo · $1,430/yr
- Insurance
- −$50
- HOA
- −$0
- Vacancy / Maint / Mgmt
- −$410
- Net cashflow
- $742
Break-even live
UW: 25.0% down · 7.5% · 30yr · 1.5% tax · 5.0% vac · 8.0% maint · 8.0% mgmt
Financing live
Cash to close
- Down payment
- $30,000
- Closing costs
- $3,600
- Reserves months
- —
- Total cash needed
- —
Loan-product check · same deal, 3 products live
Conventional
25% down · 7.5% · 30yr
- Down + closing
- —
- Monthly P&I
- —
- Monthly cashflow
- —
- DSCR
- —
- Eligible?
- —
Personal DTI + credit; lowest rate.
DSCR
20% down · 8.5% · 30yr
- Down + closing
- —
- Monthly P&I
- —
- Monthly cashflow
- —
- DSCR
- —
- Eligible?
- —
No personal income docs; deal must DSCR.
Hard money
10% down · 12.0% · 12mo
- Down + closing
- —
- Monthly P&I
- —
- Monthly cashflow
- —
- DSCR
- —
- Eligible?
- —
Short-term bridge; refi at stabilization.
Rent comps 2 comps
| Address | Beds | Baths | Sqft | Rent | $/sqft | DOM | Units | Dist |
|---|---|---|---|---|---|---|---|---|
| 209 E High St Unit 209 Cridersville, OH | 3.0 | 2.0 | 1400 | $1,950 | $1.39 | 43d | 1 | 0.19mi |
| 207 E High St Unit 207 Cridersville, OH | 3.0 | 2.0 | 1400 | $1,950 | $1.39 | 43d | 1 | 0.20mi |
Listing history 21 events
-
2026-05-26$120,000 Active
-
2026-01-06status Contingency - Finance and Inspections
-
2026-01-06status Active Under Contract
-
2025-12-05status Active
-
2025-12-05status Active
-
2025-10-11historical Active Under Contract
-
2025-10-11status Pending
-
2025-10-11historical
-
2025-10-11historical
-
2025-09-22$150,000 Active
-
2025-09-22$150,000 Active
-
2020-02-21soldstatus $114,900
-
2020-02-21soldstatus $114,900
-
2020-02-21soldstatus $114,900
-
2020-01-26$114,900
-
2020-01-26$114,900
-
2017-05-19soldstatus $25,025
-
2017-05-19soldstatus $25,025
-
2017-04-12$18,000
-
2017-04-12$18,000
-
2007-08-23soldstatus $55,000
ⓘ Source: listings_history table (triggers on properties + properties_extension) + one-shot
backfill from property_details.listing_events for pre-trigger history.
Tax reassessment forecast OH · Partial reset (capped growth)
- Current annual tax
- $1,430 · $119/mo
- Projected year-2 tax
- $1,651 · $138/mo
- Expected delta
- +$221/yr (+$18/mo · 15.4%)
ⓘ Screening estimate from a state-policy table — verify with the county assessor before closing.
Climate risk First Street
- Flood 1/10 Low FEMA zone X · 0% chance over 30 yrs
- Wildfire 1/10 Low
- Heat 3/10 Moderate 7 d/yr ≥99°F today · 18 d/yr by 30 yrs out
- Wind 2/10 Low
- Air quality 2/10 Low 1 unhealthy d/yr today · 2 by 30 yrs out
Nearby sold comps map
Loading sold comps map…
Walkable amenities ~0.75 mi
Loading nearby amenities…
Taxation est. · year 1
- Rental income
- $23,400
- − Mortgage interest
- −$6,722
- − Property taxes
- −$1,430
- − Insurance
- −$600
- − Repairs & maintenance
- −$1,872
- − Management
- −$1,872
- − Depreciation
- −$3,491
- Taxable income
- $7,413
- Est. tax owed @ 24.0%
- −$1,779
- After-tax cash flow
- $7,125/yr
For passive investors: Depreciation is non-cash, so a rental often shows a tax loss while cash-flowing — sheltering income. Rental losses are passive: they offset passive income freely, and up to $25,000/yr can offset ordinary (W-2) income if you actively participate and your MAGI is under $100k (phasing out to $0 by $150k); unused losses carry forward. On sale, claimed depreciation is recaptured at up to 25%, and gains may owe capital-gains tax (a 1031 exchange can defer both). Figures are a year-1 estimate at your 24.0% rate — not tax advice; consult a CPA.
Schools (NCES district)
- District
- Wapakoneta City
- NCES district ID
- 3904498
- Math proficiency
- 66% ▼ -8.00%
- Reading proficiency
- 63% ▼ -4.00%
- Median HH income
- $51,471
- Composite
- 54.97/100
- National rank
- #1303
- State rank
- #218 of 656 in OH
Livability — Cridersville
- Score
- 72/100
- State rank
- #391
- US rank
- #6373
Category grades
Schools grade is shown separately in the Schools card above.
Census & demographics
- Census place
- Cridersville, OH
- County
- Allen · 98,169 people
- Metro
- Lima, OH
- Population (ZIP)
- 10,978
- Household income
- $82,160
- Rent vs Own
- Severe rent burden
- 9.8
Population outlook (Auglaize County) Hauer SSP2
- Today (2025)
- 45,247 people
- By 2030
- 44,448 · -1.8%
- By 2040
- 42,355 · -6.4%
- By 2050
- 39,722 · -12.2%
- By 2075
- 33,967 · -24.9%
- By 2100
- 26,839 · -40.7%
Race, ethnicity, and origin ACS 2023
- Neighborhood character
- Predominantly White (87%)
- Race & ethnicity
- White 87% Black 6% Two or more races 4% Hispanic / Latino 3% Asian 2%
- Common ancestry
- Slovak 2% Serbian 1% Italian 1%
- Foreign-born
- 3% · Canada
- Languages at home
- 97% English-only · Spanish 1% Tagalog/Filipino 1%
Political lean MEDSL · Auglaize
- 2024 margin
- Solid R (+64.6) · D 17.3% · R 81.9%
- 2008→2024 swing
- -23.4pp toward R · 2008: -41.2pp · 2024: -64.6pp
- All cycles
- 2024: R+64.6 2020: R+62.6 2016: R+62.6 2012: R+48.9 2008: R+41.2
Not yet ingested
- Civics
- —
Market trends
- HPI YoY
- ▼ -66.04%
- Current HPI
- 229.5361
- Rent YoY
- —
- Metro
- —
- State GDP YoY
- ▲ 1.98%
- F500 in state
- 48
Industry mix (Fortune 500 HQ in OH)
| Industry | F500 HQs | Revenue |
|---|---|---|
| Insurance | 3 | $145B |
|
||
| Industrial Machinery | 3 | $49B |
|
||
| Financial Services | 3 | $24B |
|
||
| Consumer Goods | 2 | $93B |
|
||
| Aerospace / Defense | 2 | $47B |
|
||
| Utilities | 2 | $33B |
|
||
Price history
+118.2% since first listed21 events — show timeline
- 2026-05-26 Listed $120,000 FSBO.com
- 2026-01-06 Relisted — WRIST
- 2026-01-06 Relisted — WCARE
- 2025-12-05 Relisted — WCARE
- 2025-12-05 Relisted — WRIST
- 2025-10-11 Contingent — WCARE
- 2025-10-11 Pending — WRIST
- 2025-10-11 Listing Removed — WRIST
- 2025-10-11 Listing Removed — WRIST
- 2025-09-22 Listed $150,000 WCARE
- 2025-09-22 Listed $150,000 WRIST
- 2020-02-21 Sold (Public Records) $114,900 Public Records
- 2020-02-21 Sold (MLS) $114,900 WRIST
- 2020-02-21 Sold (MLS) $114,900 WCARE
- 2020-01-26 Listed $114,900 WRIST
- 2020-01-26 Listed $114,900 WCARE
- 2017-05-19 Sold (MLS) $25,025 WCARE
- 2017-05-19 Sold (MLS) $25,025 WRIST
- 2017-04-12 Listed $18,000 WCARE
- 2017-04-12 Listed $18,000 WRIST
- 2007-08-23 Sold (Public Records) $55,000 Public Records
Property tax history
+1.8%/yrLatest (2025): $1,430 · -1.4% YoY. Source: county tax records.
Cash-flow waterfall
monthlySold comps — $/sqft
last 12 mo · ≤1 miLoading sold comps…