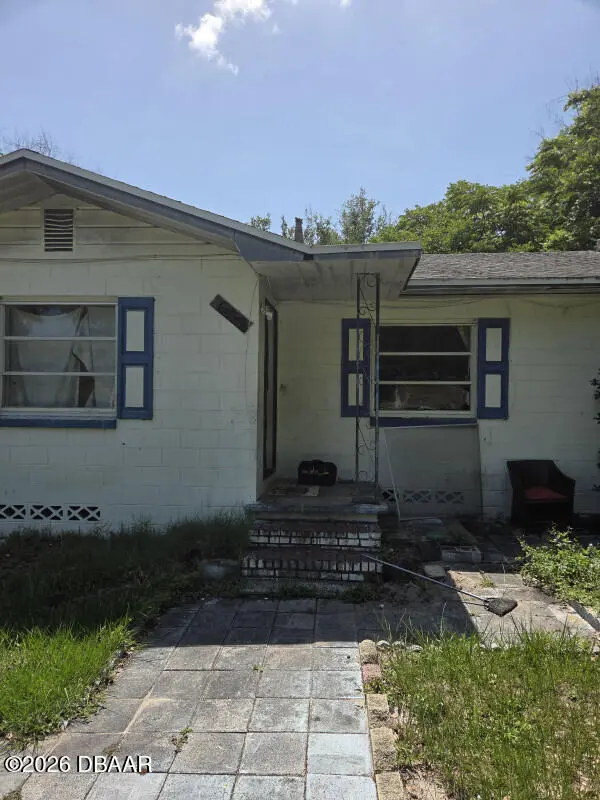
637 Thorpe Ave N · Orange City, FL
Flood risk 1/10 · Minimal
- FEMA flood zone
- X (unshaded)
- Chance of flooding over 30 yrs
- 0.0%
- Est. flood insurance / yr
- $507 – $1,088
Fire risk 3/10 · Minor
- Est. fire insurance / yr
- $947 – $1,759
Heat risk 9/10 · Severe
- Hot days now (above 107°F)
- 7 days/yr
- Hot days in 30 yrs
- 20 days/yr
Wind risk 9/10 · Severe
- Chance of severe wind over 30 yrs
- 99.0%
Air-quality risk 2/10 · Minimal
- Unhealthy air days now
- 1 days/yr
- Unhealthy air days in 30 yrs
- 1 days/yr
Risk factors via First Street. Map © Google.
Why this score? — see what drove the B- grade
The composite is a weighted blend of 9 inputs, each scored 0–100. Each bar is that input's sub-score; the figure is the points it added to the 100-point composite (weight × sub-score).
- Cash flow +28.8/30.0
- DSCR +10.0/10.0
- 1% rule +7.7/10.0
- ARV discount +7.5/15.0
- Schools +3.9/10.0
- Rent growth +3.8/5.0
- Livability +3.6/5.0
- Condition / age +2.5/5.0
- Appreciation +0.0/10.0
$144,900
🖨 Deal sheet 📄 Offer letter ✓ Due diligence
Listing remarks MLS
SHORT SALE. BANK SAYS $46k FANTASTIC HOME FOR SOMEONE WHO WANTS THAT FEELING OF COUNTRY LIVING BUT CLOSE TO EVERYTHING, KNOTTY PINE CEILINGS & WALLS IN DINING & KITCHEN, HALL & BTHRM. HUGE INLAW SUITE HAS PRIVATE ENTRANCE AND COULD BEUSED FOR A MASTER BEDROOM * * * THAT IS NOT COUNTED IN SQUARE FOOTAGE * * * FAMILY ROOM HAS A BUCK STOVE. LOTS OF STORAGE THROUGHOUT THE HOME. TWO BEDROOMS HAVE ORIGINAL FLOORS IN GOOD SHAPE. INSIDE UTILITY. LARGE AND PRIVATE BACKYARD OVER 1/2 ACRE AND VERY PRIVATE. NEWER SEPTIC FIELD.
Key facts
- Generous lot
- Usable outdoor space
- Conveniently located
Tags
Property features AI
Finance
- Other: Directions: I-4 to Exit 114 (Howland Blvd). West on Howland Blvd, right on N Volusia Ave (US-17/92), left on Graves Ave.
Exterior
- Parking: Attached garage
- Utilities: Public water; Electricity connected; Sewer connected; Water connected
- Home design: Single-family residential home; Residential use
- Construction: Block and concrete construction
- Exterior features: Not in a subdivision
Interior
- Bedrooms: 2 total rooms (includes bedrooms and other rooms)
- Bathrooms: 2 full bathrooms
- Heating & cooling: Has heating (type listed as Other); Has cooling (type listed as Other)
- Interior features: No appliances listed
Neighborhood map
What this means for you Summary
Snapshot
- This is a 2-bed/1.5-bath single-family listed at $145k.
Deal economics
- At list price, monthly cash flow is $488 ($6k/yr) — positive.
- The deal already cash-flows at list — no discount required.
- Meets the 1% rule at list price ($2k rent vs $145k).
Location & tenants
- Location reads 71/100 on livability (#406 in FL) — a middle-class / working-renter tenant base. Strengths: cost of living A+, housing A+; Watch: schools C-, employment D+, amenities F.
- Volusia (suburban): math 44% / reading 49% proficiency, ranked #47 of 73 in FL (top 64%) — families likely to look elsewhere, expect single-tenant / working-renter base with shorter leases.
- Market conditions: Rents rising fast (+5.2%/yr); 243 active listings in the ZIP; 4 comparable units currently listed for rent nearby; rentals at typical pace (median 23d on market — plan ~3-4 weeks tenant-placement turnaround); 3,402 units permitted in Volusia County in 2024 (681 in 5+ unit buildings).
- This rent runs 33% of the median local income ($67k/yr) — at the standard rent-burdened threshold; future hikes will face affordability resistance.
Forward outlook
- Local home prices are declining (-3.0%/yr); year-one equity from $1k of loan paydown is wiped out by about $4k of value loss. Plan a longer hold.
- Volusia County population projected at +19% by 2050 — long-run rental-demand tailwind backs the buy-and-hold thesis.
- At projected returns (-3.0% appreciation + 5.2% rent growth), your $41k cash investment doubles in ~7 years — after that, you're playing with house money.
Negotiation context
- Only 12 days on market — expect competitive offers; lowballing is unlikely to land.
- 4 sale attempts since 19y ago with the ask held roughly flat each time — persistent listings suggest the price (not the market) is what's stuck; bring a comps-based counter.
- Current owner paid $70k; list at $145k implies a 107% gain — meaningful room to come down on a strong offer.
Risks & watch-outs
- Watch-outs: built in 1956 — expect roof / HVAC / electrical / plumbing capex.
- Climate carrying-cost: severe wind risk, 99% chance of damaging wind over 30y; extreme-heat days projected 7→20/yr by 2055 (HVAC capex compounding) — expect insurance premiums to compound above CPI over the hold.
Questions for the listing agent
- Built in 1956 — when were the roof, HVAC, electrical panel, plumbing, and water heater last replaced?
- Is there a deadline driving the sale (1031 exchange, divorce, estate, relocation)? That informs how much negotiation room exists.
- What's the average days-on-market for RENTAL listings here right now (not sales)? A rising rental-DOM trend means longer vacancies and softer asking-rent achievability than the comps imply.
- What's the recent tenant-quality profile in this submarket — average credit score on applications, eviction rate, late-payment / NSF rate, and stable-employment percentage? A property-management company in the area should have these aggregated.
- How much new for-sale + rental construction is in the pipeline within 1–3 miles? Heavy new supply typically softens prices + rents 12–24 months out; constrained supply supports both.
Investment metrics
- 1% rule
- 1.27% ✓
- Cap rate
- 10.33%
- Cash-on-cash
- 14.42%
- DSCR
- 1.64
- GRM
- 6.5
CMA / ARV
No comps found within radius.
Projected returns pro-forma
-3.0% appreciation · 5.22% rent growth · sell at horizon
- IRR
- 7.3%
- Equity multiple
- 1.29×
- Total profit
- $11,795
- Equity at exit
- $21,605
- IRR
- 18.4%
- Equity multiple
- 2.69×
- Total profit
- $68,388
- Equity at exit
- $12,528
Cash invested: $40,572 (down + closing). Projections, not guarantees.
Landlord ↔ Tenant lean methodology
- Overall (STATE)
- 87 Strongly Landlord-Friendly
- State Florida
- 87 Strongly Landlord-Friendly · R+3
- County
- — inherits STATE
- City
- — inherits STATE
ZIP-level market 32763
- Rents YoY
- 5.2%
- Active inventory
- 243
- Price-to-rent
- 6.5×
Monthly cashflow live
- Estimated rent
- $1,846 medium interval (Pro) →
- Mortgage (P&I)
- −$760
- Tax from tax record
- −$150 /mo · $1,803/yr
- Insurance
- −$60
- HOA
- −$0
- Vacancy / Maint / Mgmt
- −$388
- Net cashflow
- $488
Break-even live
UW: 25.0% down · 7.5% · 30yr · 1.5% tax · 5.0% vac · 8.0% maint · 8.0% mgmt
Financing live
Cash to close
- Down payment
- $36,225
- Closing costs
- $4,347
- Reserves months
- —
- Total cash needed
- —
Loan-product check · same deal, 3 products live
Conventional
25% down · 7.5% · 30yr
- Down + closing
- —
- Monthly P&I
- —
- Monthly cashflow
- —
- DSCR
- —
- Eligible?
- —
Personal DTI + credit; lowest rate.
DSCR
20% down · 8.5% · 30yr
- Down + closing
- —
- Monthly P&I
- —
- Monthly cashflow
- —
- DSCR
- —
- Eligible?
- —
No personal income docs; deal must DSCR.
Hard money
10% down · 12.0% · 12mo
- Down + closing
- —
- Monthly P&I
- —
- Monthly cashflow
- —
- DSCR
- —
- Eligible?
- —
Short-term bridge; refi at stabilization.
Rent comps 4 comps
| Address | Beds | Baths | Sqft | Rent | $/sqft | DOM | Units | Dist |
|---|---|---|---|---|---|---|---|---|
| 505 Patlin Ave Orange City, FL | 2.0 | 1.5 | 1022 | $1,600 | $1.57 | 23d | 1 | 0.83mi |
| 550 E Minnesota Ave Orange City, FL | 2.0 | 1.0 | 900 | $2,850 | $3.17 | 23d | 1 | 1.00mi |
| 345 E Ohio Ave #345 Orange City, FL | 2.0 | 2.0 | 1006 | $1,697 | $1.69 | 23d | 1 | 1.06mi |
| 240 Whispering Oaks Ct Orange City, FL | 1.0 | 1.0 | 729 | $1,289 | $1.77 | 14d | 1 | 1.16mi |
Listing history 21 events
-
2026-06-10status $144,900 Pending 12 DOM
-
2026-06-09days on market $144,900 Active 12 DOM
-
2026-06-08days on market $144,900 Active 11 DOM
-
2026-06-07days on market $144,900 Active 10 DOM
-
2026-06-05days on market $144,900 Active 7 DOM
-
2026-06-03days on market $144,900 Active 6 DOM
-
2026-06-02days on market $144,900 Active 5 DOM
-
2026-06-01days on market $144,900 Active 4 DOM
-
2026-05-31days on market $144,900 Active 3 DOM
-
2026-05-31days on market $144,900 Active 2 DOM
-
2026-05-28$144,900 Active
-
2013-02-26soldstatus $70,000
-
2013-02-26soldstatus $85,000
-
2012-01-24soldstatus $46,000 544-char remark
Show marketing remark (544 chars)
SHORT SALE. BANK SAYS $46k FANTASTIC HOME FOR SOMEONE WHO WANTS THAT FEELING OF COUNTRY LIVING BUT CLOSE TO EVERYTHING, KNOTTY PINE CEILINGS & WALLS IN DINING & KITCHEN, HALL & BTHRM. HUGE INLAW SUITE HAS PRIVATE ENTRANCE AND COULD BEUSED FOR A MASTER BEDROOM * * * THAT IS NOT COUNTED IN SQUARE FOOTAGE * * * FAMILY ROOM HAS A BUCK STOVE. LOTS OF STORAGE THROUGHOUT THE HOME. TWO BEDROOMS HAVE ORIGINAL FLOORS IN GOOD SHAPE. INSIDE UTILITY. LARGE AND PRIVATE BACKYARD OVER 1/2 ACRE AND VERY PRIVATE. NEWER SEPTIC FIELD.
-
2011-11-28historical 544-char remark
Show marketing remark (544 chars)
SHORT SALE. BANK SAYS $46k FANTASTIC HOME FOR SOMEONE WHO WANTS THAT FEELING OF COUNTRY LIVING BUT CLOSE TO EVERYTHING, KNOTTY PINE CEILINGS & WALLS IN DINING & KITCHEN, HALL & BTHRM. HUGE INLAW SUITE HAS PRIVATE ENTRANCE AND COULD BEUSED FOR A MASTER BEDROOM * * * THAT IS NOT COUNTED IN SQUARE FOOTAGE * * * FAMILY ROOM HAS A BUCK STOVE. LOTS OF STORAGE THROUGHOUT THE HOME. TWO BEDROOMS HAVE ORIGINAL FLOORS IN GOOD SHAPE. INSIDE UTILITY. LARGE AND PRIVATE BACKYARD OVER 1/2 ACRE AND VERY PRIVATE. NEWER SEPTIC FIELD.
-
2009-06-29$45,900 544-char remark
Show marketing remark (544 chars)
SHORT SALE. BANK SAYS $46k FANTASTIC HOME FOR SOMEONE WHO WANTS THAT FEELING OF COUNTRY LIVING BUT CLOSE TO EVERYTHING, KNOTTY PINE CEILINGS & WALLS IN DINING & KITCHEN, HALL & BTHRM. HUGE INLAW SUITE HAS PRIVATE ENTRANCE AND COULD BEUSED FOR A MASTER BEDROOM * * * THAT IS NOT COUNTED IN SQUARE FOOTAGE * * * FAMILY ROOM HAS A BUCK STOVE. LOTS OF STORAGE THROUGHOUT THE HOME. TWO BEDROOMS HAVE ORIGINAL FLOORS IN GOOD SHAPE. INSIDE UTILITY. LARGE AND PRIVATE BACKYARD OVER 1/2 ACRE AND VERY PRIVATE. NEWER SEPTIC FIELD.
-
2009-06-24historical
-
2008-10-05$129,900
-
2008-09-24historical
-
2007-10-05$174,000
-
1995-06-28soldstatus $72,600
ⓘ Source: listings_history table (triggers on properties + properties_extension) + one-shot
backfill from property_details.listing_events for pre-trigger history.
Tax reassessment forecast FL · Resets to sale price
- Current annual tax
- $1,803 · $150/mo
- Projected year-2 tax
- $1,803 · $150/mo
- Expected delta
- $0/yr ($0/mo · 0.0%)
ⓘ Screening estimate from a state-policy table — verify with the county assessor before closing.
Climate risk First Street
- Flood 1/10 Low FEMA zone X (unshaded) · 0% chance over 30 yrs
- Wildfire 3/10 Moderate
- Heat 9/10 Extreme 7 d/yr ≥107°F today · 20 d/yr by 30 yrs out
- Wind 9/10 Extreme 99% chance of damaging wind over 30 yrs
- Air quality 2/10 Low 1 unhealthy d/yr today · 1 by 30 yrs out
Nearby sold comps map
Loading sold comps map…
Walkable amenities ~0.75 mi
Loading nearby amenities…
Taxation est. · year 1
- Rental income
- $22,148
- − Mortgage interest
- −$8,117
- − Property taxes
- −$1,803
- − Insurance
- −$724
- − Repairs & maintenance
- −$1,772
- − Management
- −$1,772
- − Depreciation
- −$4,215
- Taxable income
- $3,745
- Est. tax owed @ 24.0%
- −$899
- After-tax cash flow
- $4,952/yr
For passive investors: Depreciation is non-cash, so a rental often shows a tax loss while cash-flowing — sheltering income. Rental losses are passive: they offset passive income freely, and up to $25,000/yr can offset ordinary (W-2) income if you actively participate and your MAGI is under $100k (phasing out to $0 by $150k); unused losses carry forward. On sale, claimed depreciation is recaptured at up to 25%, and gains may owe capital-gains tax (a 1031 exchange can defer both). Figures are a year-1 estimate at your 24.0% rate — not tax advice; consult a CPA.
Schools (NCES district)
- District
- Volusia
- NCES district ID
- 1201920
- Math proficiency
- 44% ▼ -9.00%
- Reading proficiency
- 49% ▼ -3.00%
- Median HH income
- $42,946
- Composite
- 39.2/100
- National rank
- #4019
- State rank
- #47 of 73 in FL
Livability — Orange City
- Score
- 71/100
- State rank
- #406
- US rank
- #7175
Category grades
Schools grade is shown separately in the Schools card above.
Census & demographics
- Census place
- Orange City, FL
- County
- Volusia County · 556,871 people
- City population
- 24,951
- Metro
- Deltona-Daytona Beach-Ormond Beach, FL
- Population (ZIP)
- 24,951
- Household income
- $66,716
- Rent vs Own
- Severe rent burden
- 1544.0
Population outlook (Volusia County) Hauer SSP2
- Today (2025)
- 572,749 people
- By 2030
- 598,695 · +4.5%
- By 2040
- 644,880 · +12.6%
- By 2050
- 681,451 · +19.0%
- By 2075
- 759,957 · +32.7%
- By 2100
- 778,902 · +36.0%
Race, ethnicity, and origin ACS 2023
- Neighborhood character
- Predominantly White (71%)
- Race & ethnicity
- White 71% Hispanic / Latino 18% Two or more races 7% Black 7% Asian 1%
- Hispanic origin (detail)
- Puerto Rican 12%
- Common ancestry
- Slovak 2% Romanian 2% Lithuanian 2%
- Foreign-born
- 6% · Canada, Vietnam
- Languages at home
- 85% English-only · Spanish 12% Russian/Polish/Slavic 1%
Political lean MEDSL · Volusia
- 2024 margin
- Strong R (+21.8) · D 38.7% · R 60.5%
- 2008→2024 swing
- -27.4pp toward R · 2008: 5.7pp · 2024: -21.8pp
- All cycles
- 2024: R+21.8 2020: R+14.1 2016: R+13.1 2012: R+1.2 2008: D+5.7
Not yet ingested
- Civics
- —
Market trends
- HPI YoY
- ▼ -225.13%
- Current HPI
- 335.8393
- Rent YoY
- ▲ 5.22%
- Metro
- Deltona-Daytona Beach-Ormond Beach, FL
- State GDP YoY
- ▲ 3.28%
- F500 in state
- 36
Industry mix (Fortune 500 HQ in FL)
| Industry | F500 HQs | Revenue |
|---|---|---|
| Industrial Technology | 2 | $29B |
|
||
| Insurance | 2 | $17B |
|
||
| Retail | 1 | $60B |
|
||
| Technology Distribution | 1 | $58B |
|
||
| Homebuilding | 1 | $35B |
|
||
| Technology Manufacturing | 1 | $35B |
|
||
Price history
+99.6% since first listed11 events — show timeline
- 2026-05-28 Listed $144,900 Daytona MLS
- 2013-02-26 Sold (Public Records) $85,000 Public Records
- 2013-02-26 Sold (Public Records) $70,000 Public Records
- 2012-01-24 Sold (MLS) $46,000 Stellar MLS as Distributed by MLS Grid
- 2011-11-28 Listing Removed — Stellar MLS as Distributed by MLS Grid
- 2009-06-29 Listed $45,900 Stellar MLS as Distributed by MLS Grid
- 2009-06-24 Listing Removed — Stellar MLS as Distributed by MLS Grid
- 2008-10-05 Listed $129,900 Stellar MLS as Distributed by MLS Grid
- 2008-09-24 Listing Removed — Stellar MLS as Distributed by MLS Grid
- 2007-10-05 Listed $174,000 Stellar MLS as Distributed by MLS Grid
- 1995-06-28 Sold (Public Records) $72,600 Public Records
Property tax history
+0.9%/yrLatest (2025): $1,803 · +7.9% YoY. Source: county tax records.
Cash-flow waterfall
monthlySold comps — $/sqft
last 12 mo · ≤1 miLoading sold comps…