187 Garfield Ln · Jefferson, OH
Flood risk No data
- FEMA flood zone
- —
- Chance of flooding over 30 yrs
- —
- Est. flood insurance / yr
- —
Fire risk No data
- Est. fire insurance / yr
- —
Heat risk No data
- Hot days now (above threshold)
- —
- Hot days in 30 yrs
- —
Wind risk No data
- Chance of severe wind over 30 yrs
- —
Air-quality risk No data
- Unhealthy air days now
- —
- Unhealthy air days in 30 yrs
- —
Risk factors via First Street. Map © Google.
Why this score? — see what drove the B- grade
The composite is a weighted blend of 9 inputs, each scored 0–100. Each bar is that input's sub-score; the figure is the points it added to the 100-point composite (weight × sub-score).
- Cash flow +28.2/30.0
- DSCR +10.0/10.0
- 1% rule +7.8/10.0
- ARV discount +7.5/15.0
- Schools +4.6/10.0
- Livability +3.5/5.0
- Rent growth +2.5/5.0
- Condition / age +2.5/5.0
- Appreciation +0.0/10.0
$89,900
🖨 Deal sheet 📄 Offer letter ✓ Due diligence
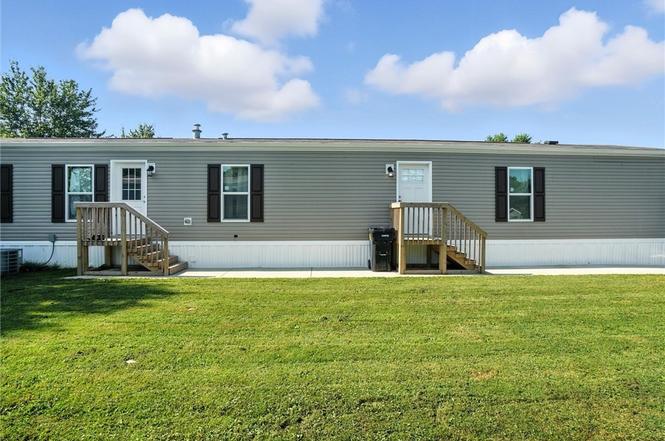
Listing remarks
Welcome home to this beautiful 2024 home located in Jefferson Mobile Estates! This spacious home offers three bedrooms and two full bathrooms, providing plenty of space and comfortable living. Step inside to find a bright, open-concept kitchen featuring dark wood cabinetry, stainless steel appliances, and modern finishes. The primary suite includes an attached bathroom and generous closet space. Enjoy the ease of single-floor living, with durable luxury vinyl plank flooring throughout and neutral tones ready for your personal touch. This home is move-in ready with new mechanicals and appliances, offering worry-free living, close to Jefferson Village. The community features a park, and resid
Key facts
- Open-concept kitchen
- Single-floor living
- Dark wood cabinetry
Tags
Neighborhood map
What this means for you Summary
Snapshot
- This is a 3-bed/2.0-bath single-family listed at $90k.
Deal economics
- At list price, monthly cash flow is $285 ($3k/yr) — positive.
- The deal already cash-flows at list — no discount required.
- Meets the 1% rule at list price ($1k rent vs $90k).
- Recommended offer: $79k (12.0% below list) — sets the bar for market timing.
Location & tenants
- Location reads 69/100 on livability (#506 in OH) — a middle-class / working-renter tenant base. Strengths: cost of living A+, housing A+, crime A; Watch: health & safety D, amenities F, commute F.
- Jefferson Area Local (rural): math 46% / reading 62% proficiency, ranked #382 of 656 in OH (top 58%) — acceptable for families but not a draw, mixed tenant base, ~2y average lease.
- Market conditions: 23 active listings in the ZIP; 155 units permitted in Ashtabula County in 2024 (0 in 5+ unit buildings).
Forward outlook
- Local home prices are declining (-3.0%/yr); year-one equity from $622 of loan paydown is wiped out by about $3k of value loss. Plan a longer hold.
- Ashtabula County population projected at -22% by 2050 — secular population decline; favor cash flow + early exit over multi-decade hold.
- At projected returns (-3.0% appreciation + 3.0% rent growth), your $25k cash investment doubles in ~9 years — after that, you're playing with house money.
Negotiation context
- It's been on market 283 days — a 12% lower offer ($79k) is reasonable based on typical stale-listing flexibility.
- 2 sale attempts with the ask held roughly flat each time — persistent listings suggest the price (not the market) is what's stuck; bring a comps-based counter.
Questions for the listing agent
- It's been on market 283 days. Have you received any prior offers? Is the seller open to a 12% concession, seller financing, or rate buy-down credit?
- Why hasn't it sold? Are there any deal-killer items the seller is aware of (foundation, flood, title, zoning, code violations)?
- Is there a deadline driving the sale (1031 exchange, divorce, estate, relocation)? That informs how much negotiation room exists.
- Schools are B-rated — typically a magnet for longer-tenancy family renters. What's the average tenant stay here, and is there a school-zone premium baked into asking?
- What's the average days-on-market for RENTAL listings here right now (not sales)? A rising rental-DOM trend means longer vacancies and softer asking-rent achievability than the comps imply.
- What's the recent tenant-quality profile in this submarket — average credit score on applications, eviction rate, late-payment / NSF rate, and stable-employment percentage? A property-management company in the area should have these aggregated.
- How much new for-sale + rental construction is in the pipeline within 1–3 miles? Heavy new supply typically softens prices + rents 12–24 months out; constrained supply supports both.
Investment metrics
- 1% rule
- 1.28% ✓
- Cap rate
- 10.10%
- Cash-on-cash
- 13.61%
- DSCR
- 1.61
- GRM
- 6.5
CMA / ARV
- ARV (on-the-fly)
- $200,640
- Comps found
- 8
Show comp detail 8 sales within ~0.75 mi
| Address | Dist | Beds/Ba | Sqft | Sold | Price | $/sf | Match |
|---|---|---|---|---|---|---|---|
| 197 Garfield Ln | 0.05mi | 3/2.0 | 1,216 (0%) | 22mo | $50,000 | $41 | 79 |
| 418 Washington Blvd | 0.23mi | 4/2.0 (+1) | 1,220 (+0%) | 15mo | $250,000 | $205 | 71 |
| 243 Jackson St | 0.12mi | 3/1.0 | 1,064 (-12%) | 2mo | $177,900 | $167 | 68 |
| 242 Jackson St | 0.15mi | 3/1.0 | 1,064 (-12%) | 3mo | $185,000 | $174 | 66 |
| 942 State Route 307 W | 0.57mi | 3/1.5 | 1,162 (-4%) | 5mo | $174,900 | $151 | 60 |
| 846 N State Route 46 | 0.40mi | 2/2.0 (-1) | 1,296 (+7%) | 9mo | $119,900 | $93 | 58 |
| 715 W Beech St | 0.27mi | 3/1.0 | 1,120 (-8%) | 15mo | $185,000 | $165 | 57 |
| 216 Linden St | 0.23mi | 3/1.0 | 1,064 (-12%) | 23mo | $165,000 | $155 | 45 |
Match score weights: distance 35% · size 25% · config 20% · recency 20%. Top-matched comps best support the ARV.
Projected returns pro-forma
-3.0% appreciation · 3.0% rent growth · sell at horizon
- IRR
- 3.7%
- Equity multiple
- 1.14×
- Total profit
- $3,630
- Equity at exit
- $13,404
- IRR
- 13.3%
- Equity multiple
- 2.06×
- Total profit
- $26,641
- Equity at exit
- $7,773
Cash invested: $25,172 (down + closing). Projections, not guarantees.
Landlord ↔ Tenant lean methodology
- Overall (STATE)
- 73 Landlord-Friendly
- State Ohio
- 73 Landlord-Friendly · R+6
- County
- — inherits STATE
- City
- — inherits STATE
ZIP-level market 44047
- Home prices YoY
- -23.3%
- Active inventory
- 23
- Price-to-rent
- 6.5×
Monthly cashflow live
- Estimated rent
- $1,148 medium interval (Pro) →
- Mortgage (P&I)
- −$471
- Tax est. 1.5%
- −$112 /mo · $1,348/yr
- Insurance
- −$37
- HOA
- −$0
- Vacancy / Maint / Mgmt
- −$241
- Net cashflow
- $285
Break-even live
UW: 25.0% down · 7.5% · 30yr · 1.5% tax · 5.0% vac · 8.0% maint · 8.0% mgmt
Financing live
Cash to close
- Down payment
- $22,475
- Closing costs
- $2,697
- Reserves months
- —
- Total cash needed
- —
Loan-product check · same deal, 3 products live
Conventional
25% down · 7.5% · 30yr
- Down + closing
- —
- Monthly P&I
- —
- Monthly cashflow
- —
- DSCR
- —
- Eligible?
- —
Personal DTI + credit; lowest rate.
DSCR
20% down · 8.5% · 30yr
- Down + closing
- —
- Monthly P&I
- —
- Monthly cashflow
- —
- DSCR
- —
- Eligible?
- —
No personal income docs; deal must DSCR.
Hard money
10% down · 12.0% · 12mo
- Down + closing
- —
- Monthly P&I
- —
- Monthly cashflow
- —
- DSCR
- —
- Eligible?
- —
Short-term bridge; refi at stabilization.
Listing history 5 events
-
2026-04-21status Pending
-
2026-04-16historical Contingent
-
2026-02-12status Active
-
2026-01-27historical Contingent
-
2025-07-12$89,900 Active
ⓘ Source: listings_history table (triggers on properties + properties_extension) + one-shot
backfill from property_details.listing_events for pre-trigger history.
Nearby sold comps map
Loading sold comps map…
Walkable amenities ~0.75 mi
Loading nearby amenities…
Taxation est. · year 1
- Rental income
- $13,773
- − Mortgage interest
- −$5,036
- − Property taxes
- −$1,348
- − Insurance
- −$450
- − Repairs & maintenance
- −$1,102
- − Management
- −$1,102
- − Depreciation
- −$2,615
- Taxable income
- $2,120
- Est. tax owed @ 24.0%
- −$509
- After-tax cash flow
- $2,916/yr
For passive investors: Depreciation is non-cash, so a rental often shows a tax loss while cash-flowing — sheltering income. Rental losses are passive: they offset passive income freely, and up to $25,000/yr can offset ordinary (W-2) income if you actively participate and your MAGI is under $100k (phasing out to $0 by $150k); unused losses carry forward. On sale, claimed depreciation is recaptured at up to 25%, and gains may owe capital-gains tax (a 1031 exchange can defer both). Figures are a year-1 estimate at your 24.0% rate — not tax advice; consult a CPA.
Schools (NCES district)
- District
- Jefferson Area Local
- NCES district ID
- 3904587
- Math proficiency
- 46% ▼ -14.00%
- Reading proficiency
- 62% ▼ -10.00%
- Median HH income
- $50,966
- Composite
- 46.13/100
- National rank
- #2506
- State rank
- #382 of 656 in OH
Livability — Jefferson
- Score
- 69/100
- State rank
- #506
- US rank
- #8526
Category grades
Schools grade is shown separately in the Schools card above.
Census & demographics
- Census place
- Jefferson, OH
- County
- Ashtabula · 97,617 people
- Metro
- Cleveland, OH
- Population (ZIP)
- 8,379
- Household income
- $59,720
- Rent vs Own
- Severe rent burden
- 10.7
Population outlook (Ashtabula County) Hauer SSP2
- Today (2025)
- 92,950 people
- By 2030
- 89,146 · -4.1%
- By 2040
- 80,715 · -13.2%
- By 2050
- 72,270 · -22.2%
- By 2075
- 55,780 · -40.0%
- By 2100
- 40,928 · -56.0%
Race, ethnicity, and origin ACS 2023
- Neighborhood character
- Predominantly White (92%)
- Race & ethnicity
- White 92% Two or more races 5% Hispanic / Latino 4%
- Common ancestry
- Romanian 3% Slovak 3% Scotch-Irish 1%
- Foreign-born
- 2% · Canada
Political lean MEDSL · Ashtabula
- 2024 margin
- Strong R (+28.4) · D 35.4% · R 63.8%
- 2008→2024 swing
- -41.9pp toward R · 2008: 13.5pp · 2024: -28.4pp
- All cycles
- 2024: R+28.4 2020: R+23.5 2016: R+19.0 2012: D+12.1 2008: D+13.5
Not yet ingested
- Civics
- —
Market trends
- HPI YoY
- ▼ -73.79%
- Current HPI
- 243.2537
- Rent YoY
- —
- Metro
- —
- State GDP YoY
- ▲ 1.98%
- F500 in state
- 48
Industry mix (Fortune 500 HQ in OH)
| Industry | F500 HQs | Revenue |
|---|---|---|
| Insurance | 3 | $145B |
|
||
| Industrial Machinery | 3 | $49B |
|
||
| Financial Services | 3 | $24B |
|
||
| Consumer Goods | 2 | $93B |
|
||
| Aerospace / Defense | 2 | $47B |
|
||
| Utilities | 2 | $33B |
|
||
Price history
5 events — show timeline
- 2026-04-21 Pending — MLSNOW
- 2026-04-16 Contingent — MLSNOW
- 2026-02-12 Relisted — MLSNOW
- 2026-01-27 Contingent — MLSNOW
- 2025-07-12 Listed $89,900 MLSNOW
Cash-flow waterfall
monthlySold comps — $/sqft
last 12 mo · ≤1 miLoading sold comps…