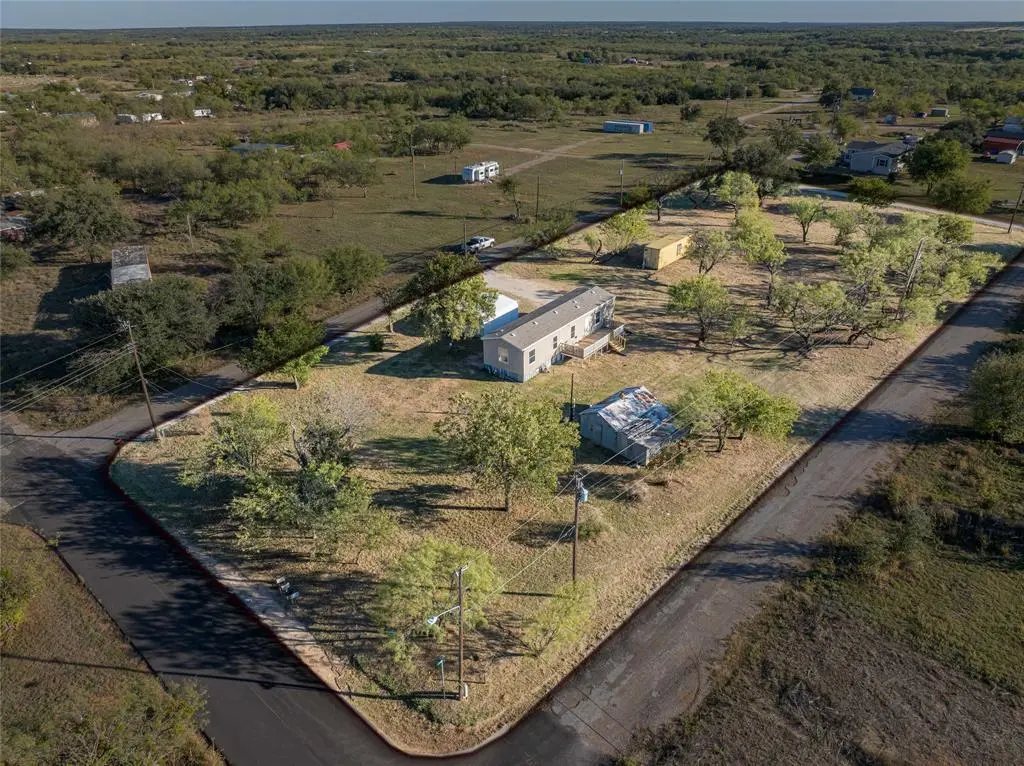
605 S Butte St · Breckenridge, TX
Flood risk 1/10 · Minimal
- FEMA flood zone
- X
- Chance of flooding over 30 yrs
- 0.0%
- Est. flood insurance / yr
- $507 – $1,088
Fire risk 7/10 · Major
- Est. fire insurance / yr
- $1,222 – $2,270
Heat risk 7/10 · Major
- Hot days now (above 107°F)
- 7 days/yr
- Hot days in 30 yrs
- 22 days/yr
Wind risk 4/10 · Minor
- Chance of severe wind over 30 yrs
- 15.0%
Air-quality risk 1/10 · Minimal
- Unhealthy air days now
- 0 days/yr
- Unhealthy air days in 30 yrs
- 0 days/yr
Risk factors via First Street. Map © Google.
Why this score? — see what drove the D+ grade
The composite is a weighted blend of 9 inputs, each scored 0–100. Each bar is that input's sub-score; the figure is the points it added to the 100-point composite (weight × sub-score).
- Cash flow +15.1/30.0
- ARV discount +7.5/15.0
- Appreciation +5.9/10.0
- DSCR +4.6/10.0
- 1% rule +3.7/10.0
- Livability +3.2/5.0
- Schools +2.9/10.0
- Rent growth +2.5/5.0
- Condition / age +2.5/5.0
$109,500
🖨 Deal sheet (PDF) 📄 Offer letter ✓ Due diligence
Listing remarks MLS
Affordable & Move-In Ready!!! Updated 2-bedroom, 2-bath 2015 manufactured home on an entire block totaling nearly an acre. Features an open floor plan, central heat & air, fresh paint, new carpet, and all-electric utilities. Kitchen includes stove, dishwasher, refrigerator, plus washer & dryer. Primary suite offers a private bath with walk-in closet. Relax on the back deck and enjoy peaceful evenings. Two storage sheds provide plenty of extra space. Owner financing available! Great value for first-time buyers, investors, or downsizers. Buyer and or buyer's agent to verify all information.
Key facts
- Open floor plan
- Private bath
- Walk-in closet
Tags
Neighborhood map
What this means for you Summary
Snapshot
- This is a 2-bed/2.0-bath single-family listed at $110k.
Deal economics
- At list price, monthly cash flow is $37 ($443/yr) — positive.
- The deal already cash-flows at list — no discount required.
- To meet the 1% rule (rent ≥ 1% of price), the offer needs to be $95k (13.2% below list).
- Recommended offer: $95k (13.2% below list) — sets the bar for 1% rule.
- Cap rate 6.7% vs local median 3.7% in Breckenridge — top-decile yield for the area; either an underpriced asset or a hidden risk that comps aren't pricing in. Stress-test before assuming the spread holds.
Location & tenants
- Location reads 65/100 on livability (#695 in TX) — a middle-class / working-renter tenant base. Strengths: cost of living A+, housing A+, health & safety A+; Watch: crime D, amenities F, commute F.
- Breckenridge ISD (town): math 36% / reading 32% proficiency, ranked #551 of 826 in TX (top 67%) — families likely to look elsewhere, expect single-tenant / working-renter base with shorter leases.
- Zoned schools: East El (404 students, 78% FRL); Breckenridge J H (math 38% / reading 31%, grade F, #858 of 1,662 statewide, top 54%, 300 students, 71% FRL); Breckenridge H S (math 32% / reading 37%, grade F, #963 of 1,632 statewide, top 61%, 424 students, 58% FRL).
- Market conditions: 119 active listings in the ZIP; 1 comparable units currently listed for rent nearby; 2 units permitted in Stephens County in 2024 (0 in 5+ unit buildings).
Forward outlook
- In year one you build about $3k of equity ($757 loan paydown + $2k appreciation (1.8% local appreciation)).
- Stephens County population projected at +19% by 2050 — long-run rental-demand tailwind backs the buy-and-hold thesis.
- At projected returns (1.8% appreciation + 3.0% rent growth), your $31k cash investment doubles in ~8 years — after that, you're playing with house money.
Negotiation context
- It's been on market 237 days — a 12% lower offer ($96k) is reasonable based on typical stale-listing flexibility.
- 4 sale attempts since 8y ago; this cycle's ask is 23% above the opening price — seller raised mid-cycle; expect resistance to lowballs.
Risks & watch-outs
- Climate carrying-cost: major wildfire risk; extreme-heat days projected 7→22/yr by 2055 (HVAC capex compounding) — expect insurance premiums to compound above CPI over the hold.
Questions for the listing agent
- It's been on market 237 days. Have you received any prior offers? Is the seller open to a 13% concession, seller financing, or rate buy-down credit?
- Why hasn't it sold? Are there any deal-killer items the seller is aware of (foundation, flood, title, zoning, code violations)?
- Is there a deadline driving the sale (1031 exchange, divorce, estate, relocation)? That informs how much negotiation room exists.
- Schools are D-rated, which usually means shorter tenancies and higher turnover. Who's the typical renter profile here, and what's been the actual vacancy rate?
- Crime grade is D in this area — have there been break-ins, vandalism, or insurance claims at this property in the last 3 years? What carrier currently insures it and at what premium?
- The area grade is low — what's the realistic commute time and amenity access for the typical tenant pool here? Any planned neighborhood developments (good or bad) we should know about?
- What's the average days-on-market for RENTAL listings here right now (not sales)? A rising rental-DOM trend means longer vacancies and softer asking-rent achievability than the comps imply.
- What's the recent tenant-quality profile in this submarket — average credit score on applications, eviction rate, late-payment / NSF rate, and stable-employment percentage? A property-management company in the area should have these aggregated.
- How much new for-sale + rental construction is in the pipeline within 1–3 miles? Heavy new supply typically softens prices + rents 12–24 months out; constrained supply supports both.
Investment metrics
- 1% rule
- 0.87% ✗
- Cap rate
- 6.70%
- Cash-on-cash
- 1.44%
- DSCR
- 1.06
- GRM
- 9.6
CMA / ARV
- ARV (median comp)
- $35,000
- List price
- $109,500
- Delta
- 212.86%
- Verdict
- OVERPRICED
- Comps
- 1 within 2.0 mi
Show comp detail 5 sales within ~0.75 mi
| Address | Dist | Beds/Ba | Sqft | Sold | Price | $/sf | Match |
|---|---|---|---|---|---|---|---|
| 207 S Flint St | 0.42mi | 2/1.0 | 852 (-5%) | 3mo | $89,000 | $104 | 66 |
| 1308 E Wheeler St | 0.54mi | 2/1.0 | 828 (-8%) | 6mo | $38,500 | $46 | 53 |
| 203 N Flint St | 0.57mi | 2/1.0 | 972 (+8%) | 12mo | $155,000 | $159 | 46 |
| 902 E Lindsey St | 0.62mi | 2/1.0 | 964 (+8%) | 14mo | $124,900 | $130 | 42 |
| 304 N Geneva St | 0.66mi | 2/1.0 | 950 (+6%) | 20mo | $59,900 | $63 | 39 |
Match score weights: distance 35% · size 25% · config 20% · recency 20%. Top-matched comps best support the ARV.
Projected returns pro-forma
1.8% appreciation · 3.0% rent growth · sell at horizon
- IRR
- 5.3%
- Equity multiple
- 1.29×
- Total profit
- $8,747
- Equity at exit
- $42,020
- IRR
- 9.0%
- Equity multiple
- 2.20×
- Total profit
- $36,710
- Equity at exit
- $59,625
Cash invested: $30,660 (down + closing). Projections, not guarantees.
Landlord ↔ Tenant lean methodology
- Overall (STATE)
- 87 Strongly Landlord-Friendly
- State Texas
- 87 Strongly Landlord-Friendly · R+5
- County
- — inherits STATE
- City
- — inherits STATE
ZIP-level market 76424
- Home prices YoY
- 1.6%
- Active inventory
- 119
- Price-to-rent
- 9.6×
Monthly cashflow live
- Estimated rent
- $950 medium interval (Pro) →
- Mortgage (P&I)
- −$574
- Tax from tax record
- −$94 /mo · $1,125/yr
- Insurance
- −$46
- HOA
- −$0
- Vacancy / Maint / Mgmt
- −$200
- Net cashflow
- $37
Break-even live
Sensitivity live
| Price | -10% $99 | -5% $68 | +0% $37 | +5% $6 | +10% $-25 |
|---|---|---|---|---|---|
| Rent | -10% $-38 | -5% $-1 | +0% $37 | +5% $74 | +10% $112 |
| Rate | -1.0pp $92 | -0.5pp $65 | base $37 | +0.5pp $9 | +1.0pp $-20 |
UW: 25.0% down · 7.5% · 30yr · 1.5% tax · 5.0% vac · 8.0% maint · 8.0% mgmt
Financing live
Cash to close
- Down payment
- $27,375
- Closing costs
- $3,285
- Reserves months
- —
- Total cash needed
- —
Loan-product check · same deal, 3 products live
Conventional
25% down · 7.5% · 30yr
- Down + closing
- —
- Monthly P&I
- —
- Monthly cashflow
- —
- DSCR
- —
- Eligible?
- —
Personal DTI + credit; lowest rate.
DSCR
20% down · 8.5% · 30yr
- Down + closing
- —
- Monthly P&I
- —
- Monthly cashflow
- —
- DSCR
- —
- Eligible?
- —
No personal income docs; deal must DSCR.
Hard money
10% down · 12.0% · 12mo
- Down + closing
- —
- Monthly P&I
- —
- Monthly cashflow
- —
- DSCR
- —
- Eligible?
- —
Short-term bridge; refi at stabilization.
Rent comps 1 comps
| Address | Beds | Baths | Sqft | Rent | $/sqft | DOM | Units | Dist |
|---|---|---|---|---|---|---|---|---|
| 107 S Miller St Unit 1/2 Breckenridge, TX | 2.0 | 1.0 | 800 | $950 | $1.19 | 45d | 1 | 0.88mi |
Listing history 35 events
-
2026-06-21days on market $109,500 Active 237 DOM
-
2026-06-21days on market $109,500 Active 236 DOM
-
2026-06-18days on market $109,500 Active 234 DOM
-
2026-06-17days on market $109,500 Active 233 DOM
-
2026-06-16days on market $109,500 Active 232 DOM
-
2026-06-15days on market $109,500 Active 231 DOM
-
2026-06-13days on market $109,500 Active 229 DOM
-
2026-06-12days on market $109,500 Active 228 DOM
-
2026-06-09days on market $109,500 Active 225 DOM
-
2026-06-08days on market $109,500 Active 224 DOM
-
2026-06-08days on market $109,500 Active 223 DOM
-
2026-06-05days on market $109,500 Active 221 DOM
-
2026-06-03days on market $109,500 Active 219 DOM
-
2026-06-02days on market $109,500 Active 218 DOM
-
2026-06-01days on market $109,500 Active 217 DOM
-
2026-05-31days on market $109,500 Active 216 DOM
-
2025-11-22price $109,500 607-char remark
Show marketing remark (607 chars)
Affordable & Move-In Ready!!! Updated 2-bedroom, 2-bath 2015 manufactured home on an entire block totaling nearly an acre. Features an open floor plan, central heat & air, fresh paint, new carpet, and all-electric utilities. Kitchen includes stove, dishwasher, refrigerator, plus washer & dryer. Primary suite offers a private bath with walk-in closet. Relax on the back deck and enjoy peaceful evenings. Two storage sheds provide plenty of extra space. Owner financing available! Great value for first-time buyers, investors, or downsizers. Buyer and or buyer's agent to verify all information.
-
2025-10-24$88,750 Active 607-char remark
Show marketing remark (607 chars)
Affordable & Move-In Ready!!! Updated 2-bedroom, 2-bath 2015 manufactured home on an entire block totaling nearly an acre. Features an open floor plan, central heat & air, fresh paint, new carpet, and all-electric utilities. Kitchen includes stove, dishwasher, refrigerator, plus washer & dryer. Primary suite offers a private bath with walk-in closet. Relax on the back deck and enjoy peaceful evenings. Two storage sheds provide plenty of extra space. Owner financing available! Great value for first-time buyers, investors, or downsizers. Buyer and or buyer's agent to verify all information.
-
2025-09-02soldstatus
-
2020-06-15soldstatus Sold 406-char remark
Show marketing remark (406 chars)
Home on 8 lots, one full block, almost half an acre! 2015 Fleetwood single wide mobile home 16 X 56 with 2 bedrooms and 2 bathrooms. Split floor plan. Open kitchen and living area. Refrigerator, electric range, dishwasher, range hood, washer and dryer convey to buyer. Large deck and storage building. Security camera. Composition roof. City water. Septic system that was installed in 2014. 21 X 18 garage.
-
2020-06-12soldstatus
-
2020-04-26historical Active Contingent 406-char remark
Show marketing remark (406 chars)
Home on 8 lots, one full block, almost half an acre! 2015 Fleetwood single wide mobile home 16 X 56 with 2 bedrooms and 2 bathrooms. Split floor plan. Open kitchen and living area. Refrigerator, electric range, dishwasher, range hood, washer and dryer convey to buyer. Large deck and storage building. Security camera. Composition roof. City water. Septic system that was installed in 2014. 21 X 18 garage.
-
2020-04-03$45,000 Active 406-char remark
Show marketing remark (406 chars)
Home on 8 lots, one full block, almost half an acre! 2015 Fleetwood single wide mobile home 16 X 56 with 2 bedrooms and 2 bathrooms. Split floor plan. Open kitchen and living area. Refrigerator, electric range, dishwasher, range hood, washer and dryer convey to buyer. Large deck and storage building. Security camera. Composition roof. City water. Septic system that was installed in 2014. 21 X 18 garage.
-
2020-04-01historical
-
2020-03-18status Active
-
2019-11-02status Pending
-
2019-10-30historical Active Option Contract
-
2019-09-30price $52,900
-
2019-09-09price $54,995
-
2019-08-02price $57,000
-
2019-06-04price $59,000
-
2019-05-09price $60,900
-
2019-02-11price $64,900
-
2018-11-14$67,900 Active
-
2006-11-17soldstatus
ⓘ Source: listings_history table (triggers on properties + properties_extension) + one-shot
backfill from property_details.listing_events for pre-trigger history.
Tax reassessment forecast TX · Resets to sale price
- Current annual tax
- $1,125 · $94/mo
- Projected year-2 tax
- $2,004 · $167/mo
- Expected delta
- +$879/yr (+$73/mo · 78.1%)
ⓘ Screening estimate from a state-policy table — verify with the county assessor before closing.
Climate risk First Street
- Flood 1/10 Low FEMA zone X · 0% chance over 30 yrs
- Wildfire 7/10 Severe
- Heat 7/10 Severe 7 d/yr ≥107°F today · 22 d/yr by 30 yrs out
- Wind 4/10 Moderate 15% chance of damaging wind over 30 yrs
- Air quality 1/10 Low 0 unhealthy d/yr today · 0 by 30 yrs out
Nearby sold comps map
Loading sold comps map…
Walkable amenities ~0.75 mi
Loading nearby amenities…
Taxation est. · year 1
- Rental income
- $11,400
- − Mortgage interest
- −$6,134
- − Property taxes
- −$1,125
- − Insurance
- −$548
- − Repairs & maintenance
- −$912
- − Management
- −$912
- − Depreciation
- −$3,185
- Taxable loss
- −$1,416
- Est. tax savings @ 24.0%
- +$340
- After-tax cash flow
- $783/yr
For passive investors: Depreciation is non-cash, so a rental often shows a tax loss while cash-flowing — sheltering income. Rental losses are passive: they offset passive income freely, and up to $25,000/yr can offset ordinary (W-2) income if you actively participate and your MAGI is under $100k (phasing out to $0 by $150k); unused losses carry forward. On sale, claimed depreciation is recaptured at up to 25%, and gains may owe capital-gains tax (a 1031 exchange can defer both). Figures are a year-1 estimate at your 24.0% rate — not tax advice; consult a CPA.
Schools (NCES district)
- District
- Breckenridge ISD
- NCES district ID
- 4811220
- Math proficiency
- 36% ▬ 0.00%
- Reading proficiency
- 32% ▼ -4.00%
- Median HH income
- $40,744
- Composite
- 28.66/100
- National rank
- #6700
- State rank
- #551 of 826 in TX
Livability — Breckenridge
- Score
- 65/100
- State rank
- #695
- US rank
- #12987
Category grades
Schools grade is shown separately in the Schools card above.
Census & demographics
- Census place
- Breckenridge, TX
- Population (ZIP)
- 8,626
Population outlook (Stephens County) Hauer SSP2
- Today (2025)
- 10,625 people
- By 2030
- 11,029 · +3.8%
- By 2040
- 11,827 · +11.3%
- By 2050
- 12,609 · +18.7%
- By 2075
- 13,855 · +30.4%
- By 2100
- 13,067 · +23.0%
Race, ethnicity, and origin ACS 2023
- Neighborhood character
- Predominantly White (67%)
- Race & ethnicity
- White 67% Hispanic / Latino 27% Two or more races 12% Black 3% Asian 1%
- Hispanic origin (detail)
- Mexican 25%
- Common ancestry
- Lithuanian 2% Slovak 2% Italian 1%
- Foreign-born
- 8% · Canada
- Languages at home
- 82% English-only · Spanish 17%
Political lean MEDSL · Stephens
- 2024 margin
- Solid R (+79.3) · D 10.2% · R 89.5%
- 2008→2024 swing
- -15.7pp toward R · 2008: -63.6pp · 2024: -79.3pp
- All cycles
- 2024: R+79.3 2020: R+78.6 2016: R+77.8 2012: R+70.9 2008: R+63.6
Not yet ingested
- Civics
- —
Market trends
- HPI YoY
- ▲ 1.80%
- Current HPI
- 110.8496
- Rent YoY
- —
- Metro
- —
- State GDP YoY
- ▲ 3.95%
- F500 in state
- 110
Industry mix (Fortune 500 HQ in TX)
| Industry | F500 HQs | Revenue |
|---|---|---|
| Energy | 16 | $1,198B |
|
||
| Technology | 5 | $198B |
|
||
| Engineering / Construction | 4 | $72B |
|
||
| Energy Services | 3 | $60B |
|
||
| Utilities | 3 | $41B |
|
||
| Healthcare | 2 | $330B |
|
||
Price history
+61.3% since first listed19 events — show timeline
- 2025-11-22 Price Changed $109,500 NTREIS
- 2025-10-24 Listed $88,750 NTREIS
- 2025-09-02 Sold (Public Records) — Public Records
- 2020-06-15 Sold (MLS) — NTREIS
- 2020-06-12 Sold (Public Records) — Public Records
- 2020-04-26 Contingent — NTREIS
- 2020-04-03 Listed $45,000 NTREIS
- 2020-04-01 Listing Removed — NTREIS
- 2020-03-18 Relisted — NTREIS
- 2019-11-02 Pending — NTREIS
- 2019-10-30 Contingent — NTREIS
- 2019-09-30 Price Changed $52,900 NTREIS
- 2019-09-09 Price Changed $54,995 NTREIS
- 2019-08-02 Price Changed $57,000 NTREIS
- 2019-06-04 Price Changed $59,000 NTREIS
- 2019-05-09 Price Changed $60,900 NTREIS
- 2019-02-11 Price Changed $64,900 NTREIS
- 2018-11-14 Listed $67,900 NTREIS
- 2006-11-17 Sold (Public Records) — Public Records
Property tax history
+14.7%/yrLatest (2025): $1,125 · -39.0% YoY. Source: county tax records.
Cash-flow waterfall
monthlySold comps — $/sqft
last 12 mo · ≤1 miLoading sold comps…