 🏗️ New Construction
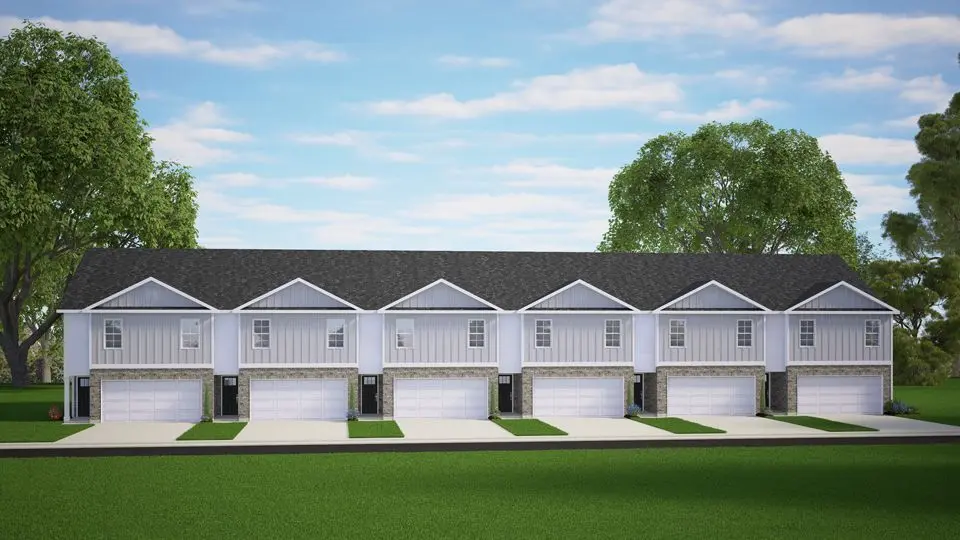
PATTISON - DRHE Plan · Whitsett, NC
Flood risk No data
- FEMA flood zone
- —
- Chance of flooding over 30 yrs
- —
- Est. flood insurance / yr
- —
Fire risk No data
- Est. fire insurance / yr
- —
Heat risk No data
- Hot days now (above threshold)
- —
- Hot days in 30 yrs
- —
Wind risk No data
- Chance of severe wind over 30 yrs
- —
Air-quality risk No data
- Unhealthy air days now
- —
- Unhealthy air days in 30 yrs
- —
Risk factors via First Street. Map © Google.
Why this score? — see what drove the D+ grade
The composite is a weighted blend of 9 inputs, each scored 0–100. Each bar is that input's sub-score; the figure is the points it added to the 100-point composite (weight × sub-score).
- Cash flow +11.3/30.0
- ARV discount +7.5/15.0
- Appreciation +5.5/10.0
- Condition / age +5.0/5.0
- Schools +3.6/10.0
- Rent growth +3.5/5.0
- 1% rule +3.3/10.0
- DSCR +3.3/10.0
- Livability +3.2/5.0
$287,900
🖨 Deal sheet (PDF) 📄 Offer letter ✓ Due diligence
Listing remarks
The Pattison is one of our newest two-story townhome floorplan showcased in our Brightwood Farm community located in whitsett, North Carolina. As you step inside this 4-bedroom, 2.5-bath townhome you'll discover 1,658 square feet of comfortable living space. The Pattison also features a 2-car garage, adding convenience and style, making it one our most sought-after townhome floorplans. The first floor living area is designed with an open-concept layout, seamlessly connecting the kitchen, living, and dining areas for a versatile space ideal for everyday living and entertaining. The kitchen boasts shaker-style cabinets, granite countertops with a tile backsplash, and stainless steel appliance
Key facts
- Two-story townhome
- Granite countertops
- Tile backsplash
Tags
Property features AI
Finance
- Financial info: List price $287,900
Exterior
- Parking: 2 total parking spaces; 2-car garage
- Home design: Single-family plan home; Addressed in Whitsett, NC (7071 Eclipse Trl)
- Exterior features: Living area approximately 1658
Interior
- Bedrooms: 4 bedrooms
- Bathrooms: 2 full bathrooms and 1 half bathroom
- Interior features: Plan home (PATTISON - DRHE); Active new construction plan
Neighborhood map
What this means for you Summary
Snapshot
- This is a 4-bed/2.5-bath townhouse listed at $288k. Condition is rated excellent.
Deal economics
- At list price, monthly cash flow is $-104 ($-1k/yr) — negative.
- To cash-flow at today's rent, offer at most $268k (6.8% below list).
- To meet the 1% rule (rent ≥ 1% of price), the offer needs to be $235k (18.4% below list).
- Recommended offer: $235k (18.4% below list) — sets the bar for 1% rule.
- Cap rate 5.9% vs local median 4.5% in Whitsett — meaningfully above typical; check what's discounted (condition, days-on-market, listing class) to confirm the premium yield is real.
Location & tenants
- Location reads 63/100 on livability (#381 in NC) — a middle-class / working-renter tenant base. Strengths: cost of living A+, housing A+; Watch: health & safety C-, amenities F, commute F.
- Guilford County Schools (urban): math 39% / reading 45% proficiency, ranked #99 of 178 in NC (top 56%) — families likely to look elsewhere, expect single-tenant / working-renter base with shorter leases.
- Zoned schools: Sedalia Elementary (math 37% / reading 42%, grade F, #694 of 1,410 statewide, top 53%, 550 students, 62% FRL); Eastern Guilford Middle (math 26% / reading 38%, grade F, #317 of 475 statewide, top 68%, 980 students, 75% FRL); Eastern Guilford High (math 25% / reading 37%, grade F, #454 of 535 statewide, top 85%, 1,198 students, 67% FRL) — zoned schools average 68% FRL vs 52% district-wide (16 pts higher); higher-poverty schools than district average — tighter screening recommended.
- Market conditions: Rents rising fast (+4.0%/yr); 105 active listings in the ZIP; 8 comparable units currently listed for rent nearby; rentals at typical pace (median 23d on market — plan ~3-4 weeks tenant-placement turnaround); solid renter incomes; 3,843 units permitted in Guilford County in 2024 (2,397 in 5+ unit buildings).
- This rent runs 31% of the median local income ($90k/yr) — at the standard rent-burdened threshold; future hikes will face affordability resistance.
Forward outlook
- In year one you build about $5k of equity ($2k loan paydown + $3k appreciation (1.0% local appreciation)).
- Guilford County population projected at +26% by 2050 — long-run rental-demand tailwind backs the buy-and-hold thesis.
- By year 7, paydown + projected appreciation supports a ~$33k cash-out refi (75% LTV) — recoverable capital for the next deal without selling this one.
Negotiation context
- It's been on market 75 days — a 6% lower offer ($271k) is reasonable based on typical stale-listing flexibility.
Questions for the listing agent
- What do current leases actually rent for vs. the listed asking? Can we see a recent rent roll and the last 12 months of T-12 income?
- It's been on market 75 days. Have you received any prior offers? Is the seller open to a 18% concession, seller financing, or rate buy-down credit?
- Why hasn't it sold? Are there any deal-killer items the seller is aware of (foundation, flood, title, zoning, code violations)?
- Is there a deadline driving the sale (1031 exchange, divorce, estate, relocation)? That informs how much negotiation room exists.
- Schools are F-rated, which usually means shorter tenancies and higher turnover. Who's the typical renter profile here, and what's been the actual vacancy rate?
- The area grade is low — what's the realistic commute time and amenity access for the typical tenant pool here? Any planned neighborhood developments (good or bad) we should know about?
- What's the average days-on-market for RENTAL listings here right now (not sales)? A rising rental-DOM trend means longer vacancies and softer asking-rent achievability than the comps imply.
- What's the recent tenant-quality profile in this submarket — average credit score on applications, eviction rate, late-payment / NSF rate, and stable-employment percentage? A property-management company in the area should have these aggregated.
- How much new for-sale + rental construction is in the pipeline within 1–3 miles? Heavy new supply typically softens prices + rents 12–24 months out; constrained supply supports both.
Investment metrics
- 1% rule
- 0.83% ✗
- Cap rate
- 5.85%
- Cash-on-cash
- -1.57%
- DSCR
- 0.93
- GRM
- 10.1
CMA / ARV
- ARV (on-the-fly)
- $283,518
- Comps found
- 12
Show comp detail 12 sales within ~0.75 mi
| Address | Dist | Beds/Ba | Sqft | Sold | Price | $/sf | Match |
|---|---|---|---|---|---|---|---|
| 7026 Eclipse Trl | 0.11mi | 4/2.5 | 1,658 (0%) | 2mo | $274,000 | $165 | 93 |
| 7028 Eclipse Trl | 0.11mi | 4/2.5 | 1,658 (0%) | 3mo | $275,000 | $166 | 92 |
| 7023 Eclipse Trl | 0.13mi | 4/2.5 | 1,658 (0%) | 3mo | $280,000 | $169 | 92 |
| 7031 Eclipse Trl | 0.11mi | 4/2.5 | 1,658 (0%) | 4mo | $285,000 | $172 | 91 |
| 7029 Eclipse Trl | 0.12mi | 4/2.5 | 1,658 (0%) | 4mo | $275,000 | $166 | 91 |
| 7030 Eclipse Trl | 0.10mi | 4/2.5 | 1,658 (0%) | 5mo | $292,000 | $176 | 91 |
| 7025 Eclipse Trl | 0.12mi | 4/2.5 | 1,658 (0%) | 4mo | $280,000 | $169 | 91 |
| 7022 Eclipse Trl | 0.12mi | 4/2.5 | 1,658 (0%) | 5mo | $275,000 | $166 | 90 |
| 7021 Eclipse Trl | 0.13mi | 4/2.5 | 1,658 (0%) | 6mo | $295,000 | $178 | 89 |
| 7020 Eclipse Trl | 0.13mi | 4/2.5 | 1,658 (0%) | 6mo | $291,000 | $176 | 89 |
| 7035 Eclipse Trl | 0.10mi | 4/2.5 | 1,694 (+2%) | 4mo | $290,000 | $171 | 88 |
| 6531 Knob Creek Dr | 0.33mi | 3/2.0 (-1) | 1,669 (+1%) | 4mo | $324,900 | $195 | 74 |
Match score weights: distance 35% · size 25% · config 20% · recency 20%. Top-matched comps best support the ARV.
Projected returns pro-forma
1.02% appreciation · 4.0% rent growth · sell at horizon
- IRR
- 0.3%
- Equity multiple
- 1.02×
- Total profit
- $1,308
- Equity at exit
- $97,022
- IRR
- 5.7%
- Equity multiple
- 1.71×
- Total profit
- $56,244
- Equity at exit
- $129,114
Cash invested: $79,385 (down + closing). Projections, not guarantees.
Landlord ↔ Tenant lean methodology
- Overall (STATE)
- 85 Strongly Landlord-Friendly
- State North Carolina
- 85 Strongly Landlord-Friendly · R+3
- County
- — inherits STATE
- City
- — inherits STATE
ZIP-level market 27377
- Home prices YoY
- 0.4%
- Rents YoY
- 4.0%
- Active inventory
- 105
- Price-to-rent
- 10.2×
Monthly cashflow live
- Estimated rent
- $2,348 high interval (Pro) →
- Mortgage (P&I)
- −$1,487
- Tax est. 1.5%
- −$354 /mo · $4,253/yr
- Insurance
- −$118
- HOA
- −$0
- Vacancy / Maint / Mgmt
- −$493
- Net cashflow
- $-104
Break-even live
Sensitivity live
| Price | -10% $92 | -5% $-6 | +0% $-104 | +5% $-202 | +10% $-300 |
|---|---|---|---|---|---|
| Rent | -10% $-290 | -5% $-197 | +0% $-104 | +5% $-11 | +10% $81 |
| Rate | -1.0pp $39 | -0.5pp $-32 | base $-104 | +0.5pp $-178 | +1.0pp $-252 |
UW: 25.0% down · 7.5% · 30yr · 1.5% tax · 5.0% vac · 8.0% maint · 8.0% mgmt
Financing live
Cash to close
- Down payment
- $70,880
- Closing costs
- $8,506
- Reserves months
- —
- Total cash needed
- —
Loan-product check · same deal, 3 products live
Conventional
25% down · 7.5% · 30yr
- Down + closing
- —
- Monthly P&I
- —
- Monthly cashflow
- —
- DSCR
- —
- Eligible?
- —
Personal DTI + credit; lowest rate.
DSCR
20% down · 8.5% · 30yr
- Down + closing
- —
- Monthly P&I
- —
- Monthly cashflow
- —
- DSCR
- —
- Eligible?
- —
No personal income docs; deal must DSCR.
Hard money
10% down · 12.0% · 12mo
- Down + closing
- —
- Monthly P&I
- —
- Monthly cashflow
- —
- DSCR
- —
- Eligible?
- —
Short-term bridge; refi at stabilization.
Rent comps 8 comps
| Address | Beds | Baths | Sqft | Rent | $/sqft | DOM | Units | Dist |
|---|---|---|---|---|---|---|---|---|
| 7161 Royal Ascot Dr Whitsett, NC | 4.0 | 1.0–2.5 | 1658 | $2,250 | $1.36 | 16d | 80 | 0.07mi |
| 676 Affirmed Dr Whitsett, NC | 3.0 | 2.5 | 1951 | $1,955 | $1.00 | 23d | 1 | 0.25mi |
| 6850 Keeneland Dr Whitsett, NC | 4.0 | 2.5 | 2196 | $2,010 | $0.92 | 23d | 1 | 0.33mi |
| 6700 Olivia Way Whitsett, NC | 4.0 | 2.5 | 2231 | $1,949 | $0.87 | 25d | 1 | 0.45mi |
| 1010 Fairway Village Way Whitsett, NC | 1.0–3.0 | 1.0–2.0 | 1122 | $1,857 | $1.66 | 16d | 18 | 1.13mi |
| 541 NC Highway 61 Whitsett, NC | 3.0 | 2.5 | 1422 | $1,839 | $1.29 | 16d | 10 | 1.39mi |
| 941 Poets Walk Rd Whitsett, NC | 3.0 | 2.5 | 1598 | $1,850 | $1.16 | 25d | 1 | 1.43mi |
| 1022 Poets Walk Rd Unit 1 Whitsett, NC | 3.0 | 2.5 | 1706 | $1,850 | $1.08 | 23d | 1 | 1.48mi |
Listing history 15 events
-
2026-06-22days on market $287,900 Active 75 DOM
-
2026-06-18days on market $287,900 Active 72 DOM
-
2026-06-17days on market $287,900 Active 71 DOM
-
2026-06-16days on market $287,900 Active 70 DOM
-
2026-06-15days on market $287,900 Active 69 DOM
-
2026-06-14days on market $287,900 Active 67 DOM
-
2026-06-10days on market $287,900 Active 64 DOM
-
2026-06-09days on market $287,900 Active 63 DOM
-
2026-06-08days on market $287,900 Active 62 DOM
-
2026-06-07days on market $287,900 Active 61 DOM
-
2026-06-03days on market $287,900 Active 57 DOM
-
2026-06-02days on market $287,900 Active 56 DOM
-
2026-06-01days on market $287,900 Active 55 DOM
-
2026-05-31days on market $287,900 Active 54 DOM
-
2026-05-31days on market $287,900 Active 53 DOM
ⓘ Source: listings_history table (triggers on properties + properties_extension) + one-shot
backfill from property_details.listing_events for pre-trigger history.
Nearby sold comps map
Loading sold comps map…
Walkable amenities ~0.75 mi
Loading nearby amenities…
Taxation est. · year 1
- Rental income
- $28,180
- − Mortgage interest
- −$15,881
- − Property taxes
- −$4,253
- − Insurance
- −$1,418
- − Repairs & maintenance
- −$2,254
- − Management
- −$2,254
- − Depreciation
- −$8,248
- Taxable loss
- −$6,129
- Est. tax savings @ 24.0%
- +$1,471
- After-tax cash flow
- $221/yr
For passive investors: Depreciation is non-cash, so a rental often shows a tax loss while cash-flowing — sheltering income. Rental losses are passive: they offset passive income freely, and up to $25,000/yr can offset ordinary (W-2) income if you actively participate and your MAGI is under $100k (phasing out to $0 by $150k); unused losses carry forward. On sale, claimed depreciation is recaptured at up to 25%, and gains may owe capital-gains tax (a 1031 exchange can defer both). Figures are a year-1 estimate at your 24.0% rate — not tax advice; consult a CPA.
Condition & rehab AI · 12 photos
This well-maintained, move-in-ready townhome in Whitsett, NC, offers a spacious and modern living experience with excellent curb appeal and interior finishes.
Value-add opportunities
- Both Painting exterior and interior walls — Fresh paint can enhance curb appeal and interior aesthetics
- Both Replace window treatments — New window treatments can improve energy efficiency and add a fresh look
- Both Install smart home devices — Smart home devices can increase convenience and add value for potential buyers
Renovation cost estimate screening
Value-add ROI direction
- Both Painting exterior and interior walls — Fresh paint can enhance curb appeal and interior aesthetics ↑
- Both Replace window treatments — New window treatments can improve energy efficiency and add a fresh look ↑
- Both Install smart home devices — Smart home devices can increase convenience and add value for potential buyers ↑
ⓘ Cost ranges are severity-bucket heuristics (US national rule-of-thumb). Get contractor quotes + a written scope before underwriting a rehab budget.
Schools (NCES district)
- District
- Guilford County Schools
- NCES district ID
- 3701920
- Math proficiency
- 39% ▲ 1.00%
- Reading proficiency
- 45% ▲ 1.00%
- Median HH income
- $46,315
- Composite
- 35.78/100
- National rank
- #4842
- State rank
- #99 of 178 in NC
Livability — Whitsett
- Score
- 63/100
- State rank
- #381
- US rank
- #15002
Category grades
Schools grade is shown separately in the Schools card above.
Census & demographics
- County
- Guilford County · 487,190 people
- City population
- 10,885
- Metro
- Greensboro-High Point, NC
- Population (ZIP)
- 10,885
- Household income
- $90,181
- Rent vs Own
- Severe rent burden
- 356.0
Population outlook (Guilford County) Hauer SSP2
- Today (2025)
- 584,596 people
- By 2030
- 616,851 · +5.5%
- By 2040
- 678,451 · +16.1%
- By 2050
- 734,788 · +25.7%
- By 2075
- 862,985 · +47.6%
- By 2100
- 948,704 · +62.3%
Race, ethnicity, and origin ACS 2023
- Neighborhood character
- Diverse neighborhood (Simpson 0.61)
- Race & ethnicity
- White 52% Black 34% Two or more races 8% Hispanic / Latino 5% Asian 2%
- Common ancestry
- Serbian 6% Italian 3% Lithuanian 1%
- Foreign-born
- 5% · Canada, China
- Languages at home
- 95% English-only · Spanish 2% Chinese 1% Other Indo-European 1%
Political lean MEDSL · Guilford
- 2024 margin
- Strong D (+21.8) · D 60.2% · R 38.4% · Other 1.4%
- 2008→2024 swing
- +3.5pp toward D · 2008: 18.4pp · 2024: 21.8pp
- All cycles
- 2024: D+21.8 2020: D+23.1 2016: D+20.0 2012: D+16.5 2008: D+18.4
Not yet ingested
- Civics
- —
Market trends
- HPI YoY
- ▲ 1.02%
- Current HPI
- 232.0638
- Rent YoY
- ▲ 4.00%
- Metro
- Greensboro-High Point, NC
- State GDP YoY
- ▲ 3.28%
- F500 in state
- 26
Industry mix (Fortune 500 HQ in NC)
| Industry | F500 HQs | Revenue |
|---|---|---|
| Financial Services | 2 | $213B |
|
||
| Retail | 2 | $95B |
|
||
| Industrial Conglomerate | 1 | $38B |
|
||
| Metals / Steel | 1 | $35B |
|
||
| Utilities | 1 | $30B |
|
||
| Industrial Machinery | 1 | $19B |
|
||
Cash-flow waterfall
monthlySold comps — $/sqft
last 12 mo · ≤1 miLoading sold comps…