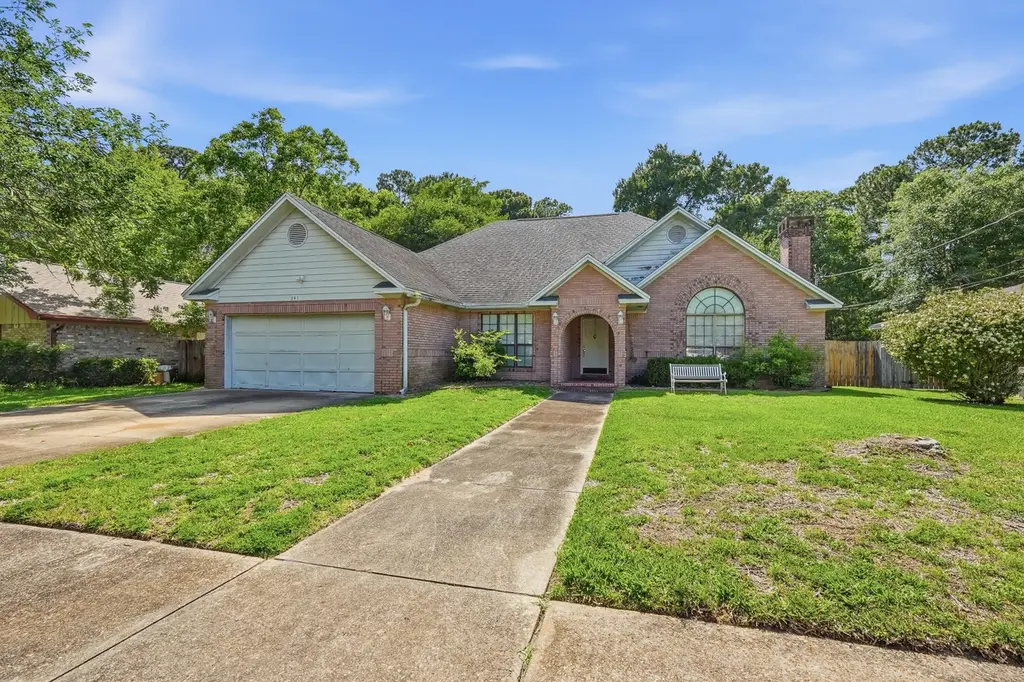
341 Brian Cir · Mary Esther, FL
Flood risk 1/10 · Minimal
- FEMA flood zone
- X (unshaded)
- Chance of flooding over 30 yrs
- 0.0%
- Est. flood insurance / yr
- $507 – $1,088
Fire risk 4/10 · Minor
- Est. fire insurance / yr
- $947 – $1,759
Heat risk 10/10 · Severe
- Hot days now (above 104°F)
- 7 days/yr
- Hot days in 30 yrs
- 22 days/yr
Wind risk 9/10 · Severe
- Chance of severe wind over 30 yrs
- 99.0%
Air-quality risk 2/10 · Minimal
- Unhealthy air days now
- 1 days/yr
- Unhealthy air days in 30 yrs
- 1 days/yr
Risk factors via First Street. Map © Google.
Why this score? — see what drove the C+ grade
The composite is a weighted blend of 9 inputs, each scored 0–100. Each bar is that input's sub-score; the figure is the points it added to the 100-point composite (weight × sub-score).
- Cash flow +20.7/30.0
- ARV discount +15.0/15.0
- DSCR +6.6/10.0
- Schools +5.2/10.0
- 1% rule +4.8/10.0
- Livability +4.5/5.0
- Condition / age +2.5/5.0
- Rent growth +2.4/5.0
- Appreciation +0.0/10.0
$279,000
🖨 Deal sheet 📄 Offer letter ✓ Due diligence
Listing remarks
* Sellers are asking for HIGHEST AND BEST by 5/27/2026 at 5:00 pm. * Check out this charming 3 bedroom all brick home in Mary Esther, Florida! You are welcomed into the home through custom designed brick work at the front door and upon entering, you will find a designated office/ flex space to the left and the living room on the right. This spacious home also has a formal dining room that flows from the living room to the kitchen. While this home needs some updating from a new owner, the major systems are updated as follows: the water heater was replaced in 2020, HVAC and gas heater in 2021, and a new roof was installed in 2014. A new owner could easily convert the front office to a bedroo
Key facts
- Updated gas heater
- Formal dining room
- Updated water heater
Tags
Property features AI
Finance
- HOA & community: Playground in the community; Subdivision: MARY ESTHER MANOR
Exterior
- Parking: Attached 2-car garage; Garage door opener
- Utilities: Public water; Public sewer; Electric service; Natural gas; Phone service; Cable TV
- Home design: Traditional single-family home; One story; Built in 1988; Slab foundation
- Construction: Brick exterior with wood trim; Composite shingle roof; Slab foundation
- Exterior features: Private yard; Lawn pump; Sprinkler system; Yard building; Privacy fencing; Curb & gutter; Interior lot; Level lot; Sidewalks; City street frontage; Paved road access
Interior
- Kitchen: Kitchen island; Microwave; Range hood; Garbage disposal
- Bedrooms: 3 bedrooms; Master bedroom on the first floor with cathedral ceiling and walk-in closet
- Bathrooms: 2 full bathrooms; Master bathroom with double vanity and garden tub
- Heating & cooling: Central air; Ceiling fans; Natural gas heating
- Interior features: Cathedral ceilings; Tray ceilings; Fireplace; Kitchen island; Washer/dryer hookup; Painted woodwork; Double pane windows; Skylights
- Laundry & utility: Laundry room on the first floor; Washer/dryer hookup; Gas water heater
Neighborhood map
What this means for you Summary
Snapshot
- This is a 3-bed/2.0-bath single-family listed at $279k.
Deal economics
- At list price, monthly cash flow is $375 ($5k/yr) — positive.
- The deal already cash-flows at list — no discount required.
- To meet the 1% rule (rent ≥ 1% of price), the offer needs to be $273k (2.2% below list).
- Recommended offer: $273k (2.2% below list) — sets the bar for 1% rule.
- Cap rate 7.9% vs local median 4.8% in Mary Esther — top-decile yield for the area; either an underpriced asset or a hidden risk that comps aren't pricing in. Stress-test before assuming the spread holds.
Location & tenants
- Location reads 89/100 on livability (#2 in FL, #137 nationally) — a professional / high-income tenant draw. Strengths: crime A+, commute A+, cost of living A+.
- Okaloosa (other): math 60% / reading 60% proficiency, ranked #12 of 73 in FL (top 16%) — acceptable for families but not a draw, mixed tenant base, ~2y average lease.
- Zoned schools: Florosa Elementary School (math 65% / reading 61%, grade B, #582 of 2,144 statewide, top 28%, 536 students, 52% FRL); Fort Walton Beach High School (math 54% / reading 58%, grade C, #131 of 667 statewide, top 20%, 1,620 students, 42% FRL).
- Market conditions: Rents soft (-0.5%/yr); 175 active listings in the ZIP; 3 comparable units currently listed for rent nearby; rentals at typical pace (median 21d on market — plan ~3-4 weeks tenant-placement turnaround); solid renter incomes; 1,268 units permitted in Okaloosa County in 2024 (175 in 5+ unit buildings).
- This rent runs 42% of the median local income ($78k/yr) — at the standard rent-burdened threshold; future hikes will face affordability resistance.
Forward outlook
- Local home prices are declining (-3.0%/yr); year-one equity from $2k of loan paydown is wiped out by about $8k of value loss. Plan a longer hold.
- Okaloosa County population projected at +37% by 2050 — long-run rental-demand tailwind backs the buy-and-hold thesis.
Negotiation context
- Only 2 days on market — expect competitive offers; lowballing is unlikely to land.
- 9 sale attempts since 24y ago with the ask held roughly flat each time — persistent listings suggest the price (not the market) is what's stuck; bring a comps-based counter.
Risks & watch-outs
- Climate carrying-cost: severe wind risk, 99% chance of damaging wind over 30y; extreme-heat days projected 7→22/yr by 2055 (HVAC capex compounding) — expect insurance premiums to compound above CPI over the hold.
Questions for the listing agent
- Is there a deadline driving the sale (1031 exchange, divorce, estate, relocation)? That informs how much negotiation room exists.
- Schools are B-rated — typically a magnet for longer-tenancy family renters. What's the average tenant stay here, and is there a school-zone premium baked into asking?
- What's the average days-on-market for RENTAL listings here right now (not sales)? A rising rental-DOM trend means longer vacancies and softer asking-rent achievability than the comps imply.
- What's the recent tenant-quality profile in this submarket — average credit score on applications, eviction rate, late-payment / NSF rate, and stable-employment percentage? A property-management company in the area should have these aggregated.
- How much new for-sale + rental construction is in the pipeline within 1–3 miles? Heavy new supply typically softens prices + rents 12–24 months out; constrained supply supports both.
Investment metrics
- 1% rule
- 0.98% ✗
- Cap rate
- 7.91%
- Cash-on-cash
- 5.77%
- DSCR
- 1.26
- GRM
- 8.5
CMA / ARV
- ARV (on-the-fly)
- $503,472
- Comps found
- 10
Show comp detail 10 sales within ~0.75 mi
| Address | Dist | Beds/Ba | Sqft | Sold | Price | $/sf | Match |
|---|---|---|---|---|---|---|---|
| 341 Brian Cir | 0.00mi | 3/2.0 | 2,468 (0%) | 0mo | $295,000 | $120 | 100 |
| 265 Brian Cir | 0.14mi | 4/2.5 (+1) | 2,372 (-4%) | 16mo | $485,000 | $204 | 67 |
| 480 Brian Cir | 0.15mi | 4/3.0 (+1) | 2,595 (+5%) | 17mo | $499,000 | $192 | 61 |
| 221 ELLIOTT Rd | 0.32mi | 4/3.0 (+1) | 2,359 (-4%) | 13mo | $525,000 | $223 | 58 |
| 25 Emory St | 0.15mi | 4/2.5 (+1) | 2,255 (-9%) | 21mo | $360,000 | $160 | 54 |
| 211 Elliott Rd | 0.33mi | 3/3.0 | 2,366 (-4%) | 24mo | $575,000 | $243 | 54 |
| 1626 Fenwick Ave | 0.74mi | 4/2.0 (+1) | 2,149 (-13%) | 4mo | $449,000 | $209 | 35 |
| 695 Randall Roberts Rd | 0.67mi | 4/2.0 (+1) | 2,098 (-15%) | 9mo | $434,000 | $207 | 31 |
| 1600 Trent St | 0.69mi | 3/2.0 | 2,100 (-15%) | 19mo | $420,000 | $200 | 27 |
| 712 Randall Roberts Rd | 0.74mi | 4/2.0 (+1) | 2,122 (-14%) | 19mo | $375,000 | $177 | 22 |
Match score weights: distance 35% · size 25% · config 20% · recency 20%. Top-matched comps best support the ARV.
Projected returns pro-forma
-3.0% appreciation · 0.0% rent growth · sell at horizon
- IRR
- -10.6%
- Equity multiple
- 0.62×
- Total profit
- $-29,350
- Equity at exit
- $41,600
- IRR
- -5.9%
- Equity multiple
- 0.67×
- Total profit
- $-25,882
- Equity at exit
- $24,123
Cash invested: $78,120 (down + closing). Projections, not guarantees.
Landlord ↔ Tenant lean methodology
- Overall (STATE)
- 87 Strongly Landlord-Friendly
- State Florida
- 87 Strongly Landlord-Friendly · R+3
- County
- — inherits STATE
- City
- — inherits STATE
ZIP-level market 32569
- Home prices YoY
- -26.5%
- Rents YoY
- -0.5%
- Active inventory
- 175
- Price-to-rent
- 8.5×
Monthly cashflow live
- Estimated rent
- $2,729 medium interval (Pro) →
- Mortgage (P&I)
- −$1,463
- Tax from tax record
- −$201 /mo · $2,413/yr
- Insurance
- −$116
- HOA
- −$0
- Vacancy / Maint / Mgmt
- −$573
- Net cashflow
- $375
Break-even live
UW: 25.0% down · 7.5% · 30yr · 1.5% tax · 5.0% vac · 8.0% maint · 8.0% mgmt
Financing live
Cash to close
- Down payment
- $69,750
- Closing costs
- $8,370
- Reserves months
- —
- Total cash needed
- —
Loan-product check · same deal, 3 products live
Conventional
25% down · 7.5% · 30yr
- Down + closing
- —
- Monthly P&I
- —
- Monthly cashflow
- —
- DSCR
- —
- Eligible?
- —
Personal DTI + credit; lowest rate.
DSCR
20% down · 8.5% · 30yr
- Down + closing
- —
- Monthly P&I
- —
- Monthly cashflow
- —
- DSCR
- —
- Eligible?
- —
No personal income docs; deal must DSCR.
Hard money
10% down · 12.0% · 12mo
- Down + closing
- —
- Monthly P&I
- —
- Monthly cashflow
- —
- DSCR
- —
- Eligible?
- —
Short-term bridge; refi at stabilization.
Rent comps 3 comps
| Address | Beds | Baths | Sqft | Rent | $/sqft | DOM | Units | Dist |
|---|---|---|---|---|---|---|---|---|
| 470 Brian Cir Mary Esther, FL | 3.0 | 2.0 | 1875 | $2,800 | $1.49 | 44d | 1 | 0.13mi |
| 1469 Bentley Cir Fort Walton Beach, FL | 3.0 | 2.5 | 1882 | $1,995 | $1.06 | 21d | 1 | 0.83mi |
| 490 Soundview Ct Mary Esther, FL | 3.0 | 2.5 | 1678 | $3,200 | $1.91 | 21d | 1 | 1.24mi |
Listing history 19 events
-
2026-05-25$279,000 Active
-
2005-02-16soldstatus $337,000
-
2005-02-10soldstatus $337,000
-
2005-02-10soldstatus $337,000
-
2005-01-03$349,000
-
2005-01-03$349,000
-
2004-11-23historical
-
2004-08-19$339,900
-
2004-08-19$339,900
-
2004-08-10historical
-
2004-05-10$379,000
-
2004-05-10$379,000
-
2002-06-20soldstatus $179,000
-
2002-06-17soldstatus $179,900
-
2002-06-17soldstatus $179,900
-
2002-04-10$179,900
-
2002-04-10$179,900
-
1997-03-24soldstatus $111,000
-
1990-07-01soldstatus $128,500
ⓘ Source: listings_history table (triggers on properties + properties_extension) + one-shot
backfill from property_details.listing_events for pre-trigger history.
Tax reassessment forecast FL · Resets to sale price
- Current annual tax
- $2,413 · $201/mo
- Projected year-2 tax
- $2,413 · $201/mo
- Expected delta
- $0/yr ($0/mo · 0.0%)
ⓘ Screening estimate from a state-policy table — verify with the county assessor before closing.
Climate risk First Street
- Flood 1/10 Low FEMA zone X (unshaded) · 0% chance over 30 yrs
- Wildfire 4/10 Moderate
- Heat 10/10 Extreme 7 d/yr ≥104°F today · 22 d/yr by 30 yrs out
- Wind 9/10 Extreme 99% chance of damaging wind over 30 yrs
- Air quality 2/10 Low 1 unhealthy d/yr today · 1 by 30 yrs out
Nearby sold comps map
Loading sold comps map…
Walkable amenities ~0.75 mi
Loading nearby amenities…
Taxation est. · year 1
- Rental income
- $32,746
- − Mortgage interest
- −$15,628
- − Property taxes
- −$2,413
- − Insurance
- −$1,395
- − Repairs & maintenance
- −$2,620
- − Management
- −$2,620
- − Depreciation
- −$8,116
- Taxable loss
- −$46
- Est. tax savings @ 24.0%
- +$11
- After-tax cash flow
- $4,515/yr
For passive investors: Depreciation is non-cash, so a rental often shows a tax loss while cash-flowing — sheltering income. Rental losses are passive: they offset passive income freely, and up to $25,000/yr can offset ordinary (W-2) income if you actively participate and your MAGI is under $100k (phasing out to $0 by $150k); unused losses carry forward. On sale, claimed depreciation is recaptured at up to 25%, and gains may owe capital-gains tax (a 1031 exchange can defer both). Figures are a year-1 estimate at your 24.0% rate — not tax advice; consult a CPA.
Schools (NCES district)
- District
- Okaloosa
- NCES district ID
- 1201380
- Math proficiency
- 60% ▼ -12.00%
- Reading proficiency
- 60% ▼ -4.00%
- Median HH income
- $55,601
- Composite
- 51.62/100
- National rank
- #1705
- State rank
- #12 of 73 in FL
Livability — Mary Esther
- Score
- 89/100
- State rank
- #2
- US rank
- #137
Category grades
Schools grade is shown separately in the Schools card above.
Census & demographics
- Census place
- Mary Esther, FL
- County
- Okaloosa County · 194,352 people
- City population
- 12,063
- Metro
- Crestview-Fort Walton Beach-Destin, FL
- Population (ZIP)
- 12,063
- Household income
- $77,718
- Rent vs Own
- Severe rent burden
- 416.0
Population outlook (Okaloosa County) Hauer SSP2
- Today (2025)
- 235,133 people
- By 2030
- 253,483 · +7.8%
- By 2040
- 289,537 · +23.1%
- By 2050
- 322,954 · +37.3%
- By 2075
- 399,624 · +70.0%
- By 2100
- 425,311 · +80.9%
Race, ethnicity, and origin ACS 2023
- Neighborhood character
- Diverse neighborhood (Simpson 0.58)
- Race & ethnicity
- White 63% Two or more races 12% Black 12% Hispanic / Latino 9% Asian 8%
- Hispanic origin (detail)
- Mexican 3% Puerto Rican 2%
- Common ancestry
- Slovak 5% Romanian 2% Lithuanian 2%
- Foreign-born
- 5% · Canada, South Korea, China
- Languages at home
- 89% English-only · Other Indo-European 4% Spanish 3% Tagalog/Filipino 1%
Political lean MEDSL · Okaloosa
- 2024 margin
- Solid R (+42.4) · D 28.2% · R 70.7% · Other 1.1%
- 2008→2024 swing
- +2.5pp toward D · 2008: -44.9pp · 2024: -42.4pp
- All cycles
- 2024: R+42.4 2020: R+39.1 2016: R+47.8 2012: R+49.4 2008: R+44.9
Not yet ingested
- Civics
- —
Market trends
- HPI YoY
- ▼ -97.13%
- Current HPI
- 269.266
- Rent YoY
- ▼ -0.45%
- Metro
- Crestview-Fort Walton Beach-Destin, FL
- State GDP YoY
- ▲ 3.28%
- F500 in state
- 36
Industry mix (Fortune 500 HQ in FL)
| Industry | F500 HQs | Revenue |
|---|---|---|
| Industrial Technology | 2 | $29B |
|
||
| Insurance | 2 | $17B |
|
||
| Retail | 1 | $60B |
|
||
| Technology Distribution | 1 | $58B |
|
||
| Homebuilding | 1 | $35B |
|
||
| Technology Manufacturing | 1 | $35B |
|
||
Price history
+117.1% since first listed19 events — show timeline
- 2026-05-25 Listed $279,000 ECAR
- 2005-02-16 Sold (Public Records) $337,000 Public Records
- 2005-02-10 Sold (MLS) $337,000 ECAR
- 2005-02-10 Sold (MLS) $337,000 NAMLS
- 2005-01-03 Listed $349,000 ECAR
- 2005-01-03 Listed $349,000 NAMLS
- 2004-11-23 Listing Removed — NAMLS
- 2004-08-19 Listed $339,900 NAMLS
- 2004-08-19 Listed $339,900 ECAR
- 2004-08-10 Listing Removed — NAMLS
- 2004-05-10 Listed $379,000 NAMLS
- 2004-05-10 Listed $379,000 ECAR
- 2002-06-20 Sold (Public Records) $179,000 Public Records
- 2002-06-17 Sold (MLS) $179,900 ECAR
- 2002-06-17 Sold (MLS) $179,900 NAMLS
- 2002-04-10 Listed $179,900 ECAR
- 2002-04-10 Listed $179,900 NAMLS
- 1997-03-24 Sold (Public Records) $111,000 Public Records
- 1990-07-01 Sold (Public Records) $128,500 Public Records
Property tax history
+3.3%/yrLatest (2020): $2,413 · +1.6% YoY. Source: county tax records.
Cash-flow waterfall
monthlySold comps — $/sqft
last 12 mo · ≤1 miLoading sold comps…