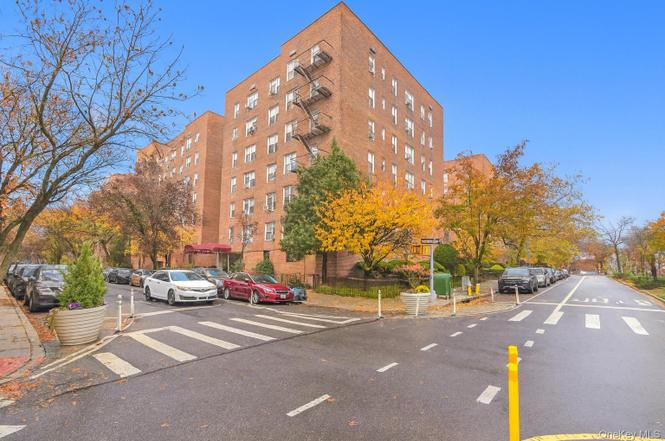
33-45 92 St Unit 2B · New York, NY
Flood risk 1/10 · Minimal
- FEMA flood zone
- X (unshaded)
- Chance of flooding over 30 yrs
- 0.0%
- Est. flood insurance / yr
- $507 – $1,088
Fire risk 1/10 · Minimal
- Est. fire insurance / yr
- $691 – $1,283
Heat risk 6/10 · Moderate
- Hot days now (above 99°F)
- 7 days/yr
- Hot days in 30 yrs
- 15 days/yr
Wind risk 6/10 · Moderate
- Chance of severe wind over 30 yrs
- 27.0%
Air-quality risk 4/10 · Minor
- Unhealthy air days now
- 5 days/yr
- Unhealthy air days in 30 yrs
- 6 days/yr
Risk factors via First Street. Map © Google.
Why this score? — see what drove the C grade
The composite is a weighted blend of 9 inputs, each scored 0–100. Each bar is that input's sub-score; the figure is the points it added to the 100-point composite (weight × sub-score).
- Cash flow +22.2/30.0
- ARV discount +7.5/15.0
- DSCR +7.1/10.0
- 1% rule +5.8/10.0
- Schools +5.0/10.0
- Livability +3.8/5.0
- Appreciation +3.2/10.0
- Condition / age +2.5/5.0
- Rent growth +2.4/5.0
$229,000
🖨 Deal sheet 📄 Offer letter ✓ Due diligence
Listing remarks
Welcome to 33-45 92nd Street #2B, a spacious and well-designed one-bedroom residence located in the heart of Jackson Heights. This thoughtfully laid-out home features an oversized living room measuring 11'4" x 19'0", providing a comfortable and versatile space for both relaxing and entertaining. A dedicated dining area flows naturally from the living space, offering the perfect setting for meals or work-from-home needs. The separate windowed kitchen includes efficient counter space and cabinetry, conveniently positioned between the dining area and hallway. The king-sized bedroom (11'4" x 16'1") offers ample room for large furniture, with two deep closets providing excell
Key facts
- Multiple bus lines
- Two deep closets
- Built 1958
Tags
Property features AI
Finance
- HOA & community: Senior community
Exterior
- Parking: No carport; No designated parking
- Utilities: Public sewer; Electricity available and connected; Natural gas available and connected; Water available and connected
- Home design: Stock cooperative
- Construction: Year built: Not specified
- Exterior features: Non-waterfront property; Construction materials: Unknown
Interior
- Kitchen: No appliances included
- Bedrooms: One bedroom on the first floor
- Bathrooms: One full bathroom
- Heating & cooling: Central air conditioning; Natural gas heating
- Interior features: First-floor bedroom; First-floor full bathroom; Entry on level 2; No basement; Total of 2 rooms
- Laundry & utility: Pets allowed — contact for details
Neighborhood map
What this means for you Summary
Snapshot
- This is a 1-bed/1.0-bath condo listed at $229k.
Deal economics
- At list price, monthly cash flow is $372 ($4k/yr) — positive.
- The deal already cash-flows at list — no discount required.
- Meets the 1% rule at list price ($2k rent vs $229k).
- Recommended offer: $202k (12.0% below list) — sets the bar for market timing.
- Cap rate 8.2% vs local median 2.6% in New York — top-decile yield for the area; either an underpriced asset or a hidden risk that comps aren't pricing in. Stress-test before assuming the spread holds.
Location & tenants
- Location reads 75/100 on livability (#268 in NY, #4,188 nationally) — a middle-class / working-renter tenant base. Strengths: amenities A+, commute A+, health & safety A; Watch: crime F, cost of living F.
- Market conditions: Rents soft (-0.6%/yr); 303 active listings in the ZIP; 13 comparable units currently listed for rent nearby; rentals at typical pace (median 19d on market — plan ~3-4 weeks tenant-placement turnaround); solid renter incomes; 5,302 units permitted in Queens County in 2024 (4,918 in 5+ unit buildings).
- This rent runs 38% of the median local income ($79k/yr) — at the standard rent-burdened threshold; future hikes will face affordability resistance.
Forward outlook
- Local home prices are declining (-3.0%/yr); year-one equity from $2k of loan paydown is wiped out by about $7k of value loss. Plan a longer hold.
- Queens County population projected at +16% by 2050 — long-run rental-demand tailwind backs the buy-and-hold thesis.
Negotiation context
- It's been on market 195 days — a 12% lower offer ($202k) is reasonable based on typical stale-listing flexibility.
Risks & watch-outs
- Watch-outs: built in 1958 — expect roof / HVAC / electrical / plumbing capex.
- Climate carrying-cost: major wind risk, 27% chance of damaging wind over 30y; extreme-heat days projected 7→15/yr by 2055 (HVAC capex compounding) — expect insurance premiums to compound above CPI over the hold.
Questions for the listing agent
- It's been on market 195 days. Have you received any prior offers? Is the seller open to a 12% concession, seller financing, or rate buy-down credit?
- Built in 1958 — when were the roof, HVAC, electrical panel, plumbing, and water heater last replaced?
- Any open or pending special assessments — roof, HVAC, plumbing, elevator, façade? What's the per-unit balance and payoff schedule, and is the seller paying it off at close or rolling it to the buyer?
- Why hasn't it sold? Are there any deal-killer items the seller is aware of (foundation, flood, title, zoning, code violations)?
- Is there a deadline driving the sale (1031 exchange, divorce, estate, relocation)? That informs how much negotiation room exists.
- Schools are B-rated — typically a magnet for longer-tenancy family renters. What's the average tenant stay here, and is there a school-zone premium baked into asking?
- Crime grade is F in this area — have there been break-ins, vandalism, or insurance claims at this property in the last 3 years? What carrier currently insures it and at what premium?
- What's the average days-on-market for RENTAL listings here right now (not sales)? A rising rental-DOM trend means longer vacancies and softer asking-rent achievability than the comps imply.
- What's the recent tenant-quality profile in this submarket — average credit score on applications, eviction rate, late-payment / NSF rate, and stable-employment percentage? A property-management company in the area should have these aggregated.
- How much new apartment / multifamily construction is in the pipeline within 1–3 miles? Heavy new supply (>2% of stock underway) typically softens rents 12–24 months out; light construction supports rent growth.
Investment metrics
- 1% rule
- 1.08% ✓
- Cap rate
- 8.24%
- Cash-on-cash
- 6.96%
- DSCR
- 1.31
- GRM
- 7.7
CMA / ARV
No comps found within radius.
Projected returns pro-forma
-3.0% appreciation · 0.0% rent growth · sell at horizon
- IRR
- -9.1%
- Equity multiple
- 0.68×
- Total profit
- $-20,629
- Equity at exit
- $34,145
- IRR
- -4.2%
- Equity multiple
- 0.76×
- Total profit
- $-15,325
- Equity at exit
- $19,800
Cash invested: $64,120 (down + closing). Projections, not guarantees.
Landlord ↔ Tenant lean methodology
- Overall (CITY)
- 0 Strongly Tenant-Friendly
- State New York
- 15 Strongly Tenant-Friendly · D+10
- County
- — inherits STATE
- City New York
- 0 Strongly Tenant-Friendly · D+34
ZIP-level market 11372
- Home prices YoY
- -1.5%
- Rents YoY
- -0.6%
- Active inventory
- 303
- Price-to-rent
- 7.7×
Monthly cashflow live
- Estimated rent
- $2,474 high interval (Pro) →
- Mortgage (P&I)
- −$1,201
- Tax est. 1.5%
- −$286 /mo · $3,435/yr
- Insurance
- −$95
- HOA
- −$0
- Vacancy / Maint / Mgmt
- −$520
- Net cashflow
- $372
Break-even live
UW: 25.0% down · 7.5% · 30yr · 1.5% tax · 5.0% vac · 8.0% maint · 8.0% mgmt
Financing live
Cash to close
- Down payment
- $57,250
- Closing costs
- $6,870
- Reserves months
- —
- Total cash needed
- —
Loan-product check · same deal, 3 products live
Conventional
25% down · 7.5% · 30yr
- Down + closing
- —
- Monthly P&I
- —
- Monthly cashflow
- —
- DSCR
- —
- Eligible?
- —
Personal DTI + credit; lowest rate.
DSCR
20% down · 8.5% · 30yr
- Down + closing
- —
- Monthly P&I
- —
- Monthly cashflow
- —
- DSCR
- —
- Eligible?
- —
No personal income docs; deal must DSCR.
Hard money
10% down · 12.0% · 12mo
- Down + closing
- —
- Monthly P&I
- —
- Monthly cashflow
- —
- DSCR
- —
- Eligible?
- —
Short-term bridge; refi at stabilization.
Rent comps 13 comps
| Address | Beds | Baths | Sqft | Rent | $/sqft | DOM | Units | Dist |
|---|---|---|---|---|---|---|---|---|
| 8910 35th Ave Unit E1L Jackson Heights, NY | 2.0 | 1.0 | 850 | $3,050 | $3.59 | 24d | 1 | 0.21mi |
| 31-40 98th St Unit 2 Flushing, NY | 1.0 | 1.0 | 800 | $2,100 | $2.62 | 7d | 1 | 0.41mi |
| 37-27 86th St Unit 6N Flushing, NY | — | 1.0 | 650 | $1,900 | $2.92 | 24d | 1 | 0.46mi |
| 3716 83rd St Jackson Heights, NY | 1.0 | 1.0 | 700 | $1,800 | $2.57 | 18d | 1 | 0.56mi |
| 31-47 102nd St Unit 2 fl Flushing, NY | 2.0 | 1.0 | 650 | $2,600 | $4.00 | 24d | 1 | 0.59mi |
| 25-61 99th St Unit 2nd Fl Flushing, NY | 2.0 | 1.0 | 780 | $3,200 | $4.10 | 24d | 1 | 0.63mi |
| 3730 103rd St Corona, NY | 1.0 | 1.0 | 540 | $1,800 | $3.33 | 18d | 1 | 0.65mi |
| 3260 106th St East Elmhurst, NY | 1.0 | 1.0 | 600 | $3,750 | $6.25 | 7d | 1 | 0.71mi |
| 2724 Gillmore St Unit 2 East Elmhurst, NY | 1.0 | 1.0 | 576 | $2,300 | $3.99 | 24d | 1 | 0.76mi |
| 8360 Vietor Ave Unit 6P Elmhurst, NY | 2.0 | 1.0 | 850 | $2,650 | $3.12 | 15d | 1 | 0.82mi |
| 10302 42nd Ave Unit 4D Corona, NY | 2.0 | 1.5 | 761 | $3,400 | $4.47 | 18d | 1 | 0.88mi |
| 9430 58th Ave Unit 3A Elmhurst, NY | — | 1.0 | 530 | $1,800 | $3.40 | 10d | 1 | 1.44mi |
| 54-01 108th St Unit 2R Flushing, NY | 2.0 | 1.0 | 1000 | $3,050 | $3.05 | 24d | 1 | 1.45mi |
HOA detail condo
- Monthly dues
- $0 · $0/yr
- Assessments
- None detected in remarks — confirm with the listing agent.
Listing history 12 events
-
2026-06-18statusdays on market $229,000 Pending 195 DOM
-
2026-06-17days on market $229,000 Active 194 DOM
-
2026-06-15days on market $229,000 Active 192 DOM
-
2026-06-13days on market $229,000 Active 190 DOM
-
2026-06-10days on market $229,000 Active 186 DOM
-
2026-06-08days on market $229,000 Active 185 DOM
-
2026-06-04days on market $229,000 Active 181 DOM
-
2026-06-03days on market $229,000 Active 180 DOM
-
2026-06-01days on market $229,000 Active 178 DOM
-
2026-05-31days on market $229,000 Active 177 DOM
-
2026-01-26price $229,000
-
2025-12-05$239,000 Active
ⓘ Source: listings_history table (triggers on properties + properties_extension) + one-shot
backfill from property_details.listing_events for pre-trigger history.
Climate risk First Street
- Flood 1/10 Low FEMA zone X (unshaded) · 0% chance over 30 yrs
- Wildfire 1/10 Low
- Heat 6/10 Major 7 d/yr ≥99°F today · 15 d/yr by 30 yrs out
- Wind 6/10 Major 27% chance of damaging wind over 30 yrs
- Air quality 4/10 Moderate 5 unhealthy d/yr today · 6 by 30 yrs out
Nearby sold comps map
Loading sold comps map…
Walkable amenities ~0.75 mi
Loading nearby amenities…
Taxation est. · year 1
- Rental income
- $29,689
- − Mortgage interest
- −$12,828
- − Property taxes
- −$3,435
- − Insurance
- −$1,145
- − Repairs & maintenance
- −$2,375
- − Management
- −$2,375
- − Depreciation
- −$6,662
- Taxable income
- $870
- Est. tax owed @ 24.0%
- −$209
- After-tax cash flow
- $4,255/yr
For passive investors: Depreciation is non-cash, so a rental often shows a tax loss while cash-flowing — sheltering income. Rental losses are passive: they offset passive income freely, and up to $25,000/yr can offset ordinary (W-2) income if you actively participate and your MAGI is under $100k (phasing out to $0 by $150k); unused losses carry forward. On sale, claimed depreciation is recaptured at up to 25%, and gains may owe capital-gains tax (a 1031 exchange can defer both). Figures are a year-1 estimate at your 24.0% rate — not tax advice; consult a CPA.
Schools (NCES district)
No district data.
Livability — New York
- Score
- 75/100
- State rank
- #268
- US rank
- #4188
Category grades
Schools grade is shown separately in the Schools card above.
Census & demographics
- Census place
- New York, NY
- County
- Queens County · 1,914,869 people
- City population
- 7,731,280
- Metro
- New York-Newark-Jersey City, NY-NJ-PA
- Population (ZIP)
- 64,756
- Household income
- $78,606
- Rent vs Own
- Severe rent burden
- 4836.0
Population outlook (Queens County) Hauer SSP2
- Today (2025)
- 2,546,320 people
- By 2030
- 2,643,059 · +3.8%
- By 2040
- 2,815,563 · +10.6%
- By 2050
- 2,944,423 · +15.6%
- By 2075
- 3,123,338 · +22.7%
- By 2100
- 3,098,688 · +21.7%
Race, ethnicity, and origin ACS 2023
- Neighborhood character
- Diverse neighborhood (Simpson 0.62)
- Race & ethnicity
- Hispanic / Latino 55% Asian 21% Two or more races 21% White 18% Black 1%
- Hispanic origin (detail)
- Mexican 11% Puerto Rican 3% Dominican 5%
- Common ancestry
- Romanian 1% Scotch-Irish 1% Lithuanian 1%
- Foreign-born
- 60% · Canada, Jamaica, China
- Languages at home
- 24% English-only · Spanish 51% Other Indo-European 11% Russian/Polish/Slavic 4%
Political lean MEDSL · Queens
- 2024 margin
- Strong D (+24.6) · D 62.3% · R 37.7%
- 2008→2024 swing
- -26.2pp toward R · 2008: 50.8pp · 2024: 24.6pp
- All cycles
- 2024: D+24.6 2020: D+45.2 2016: D+53.4 2012: D+58.5 2008: D+50.8
Not yet ingested
- Civics
- —
Market trends
- HPI YoY
- ▼ -3.57%
- Current HPI
- 239.6404
- Rent YoY
- ▼ -0.59%
- Metro
- New York-Newark-Jersey City, NY-NJ-PA
- State GDP YoY
- ▲ 2.60%
- F500 in state
- 92
Industry mix (Fortune 500 HQ in NY)
| Industry | F500 HQs | Revenue |
|---|---|---|
| Financial Services | 10 | $950B |
|
||
| Consumer Goods | 9 | $162B |
|
||
| Insurance | 4 | $225B |
|
||
| Telecommunications | 2 | $144B |
|
||
| Pharmaceuticals | 2 | $112B |
|
||
| Media / Entertainment | 2 | $69B |
|
||
Price history
-4.2% since first listed2 events — show timeline
- 2026-01-26 Price Changed $229,000 OneKey® MLS as Distributed by MLS Grid
- 2025-12-05 Listed $239,000 OneKey® MLS as Distributed by MLS Grid
Cash-flow waterfall
monthlySold comps — $/sqft
last 12 mo · ≤1 miLoading sold comps…