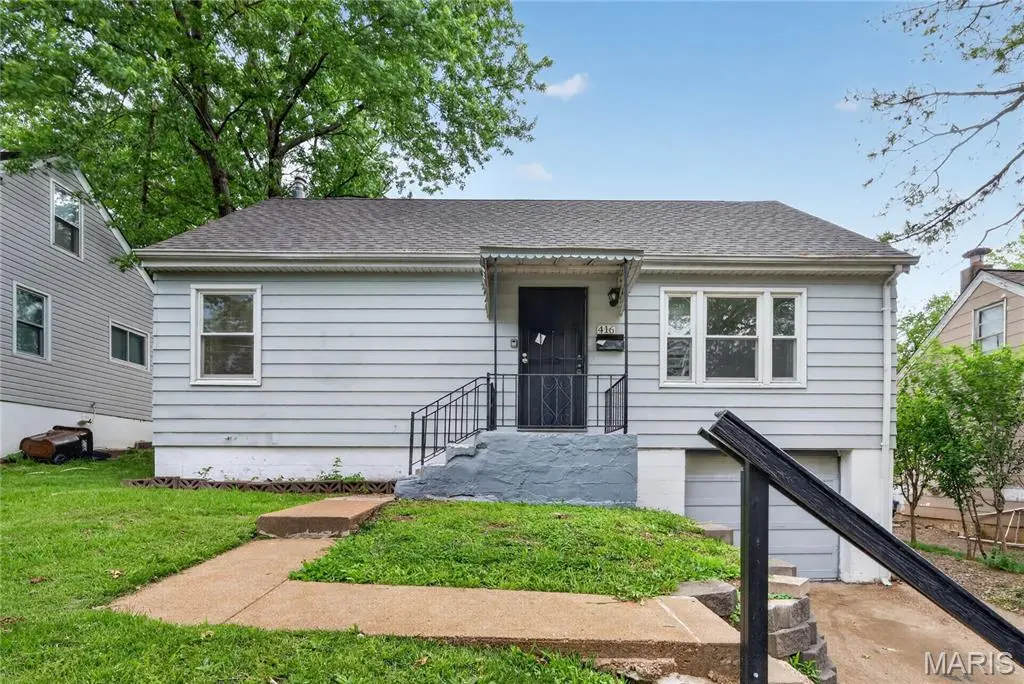
416 Ballman Ave · Ferguson, MO
Flood risk 1/10 · Minimal
- FEMA flood zone
- X (unshaded)
- Chance of flooding over 30 yrs
- 0.0%
- Est. flood insurance / yr
- $473 – $860
Fire risk 1/10 · Minimal
- Est. fire insurance / yr
- $1,054 – $1,958
Heat risk 4/10 · Minor
- Hot days now (above 106°F)
- 7 days/yr
- Hot days in 30 yrs
- 19 days/yr
Wind risk 2/10 · Minimal
- Chance of severe wind over 30 yrs
- 1.0%
Air-quality risk 3/10 · Minor
- Unhealthy air days now
- 3 days/yr
- Unhealthy air days in 30 yrs
- 5 days/yr
Risk factors via First Street. Map © Google.
Why this score? — see what drove the B- grade
The composite is a weighted blend of 9 inputs, each scored 0–100. Each bar is that input's sub-score; the figure is the points it added to the 100-point composite (weight × sub-score).
- Cash flow +29.4/30.0
- DSCR +10.0/10.0
- ARV discount +9.6/15.0
- 1% rule +7.9/10.0
- Rent growth +4.8/5.0
- Livability +2.9/5.0
- Condition / age +2.5/5.0
- Schools +1.2/10.0
- Appreciation +0.0/10.0
$119,900
🖨 Deal sheet 📄 Offer letter ✓ Due diligence
Listing remarks
Welcome to this charming 4-bedroom, 2-bathroom residence in the heart of Ferguson. Spanning 1,210 sq. ft. , this well-maintained home features stunning brown hardwood floors and a fresh, neutral paint palette throughout. The functional kitchen is equipped with sleek black appliances, while the separate laundry area offers convenient washer and dryer connections. Exterior highlights include low-maintenance aluminum/vinyl siding, a newer roof, and a fully fenced backyard perfect for privacy and outdoor gatherings. The property also includes a one-car garage and a paved asphalt driveway. Provide peace of mind in this classic 1954 build. Situated on a level 0.14-acre lot near public transit and
Key facts
- Functional kitchen
- Black appliances
- Newer roof
Tags
Property features AI
Finance
- Other: Living area reported as 1,210 (source: public records); Lot size approximately 0.1435 acres
- Financial info: Lease not considered
- HOA & community: No HOA information provided
Exterior
- Parking: Attached garage (1 garage space, total parking for 1 vehicle)
- Security: No security features provided
- Utilities: Public water; Public sewer; Electric service: Other
- Home design: Single-family house; One-and-a-half stories; Residential property
- Construction: Composition roof; Other construction materials; Built-in foundation details not provided
- Exterior features: Fenced yard; Level lot; Lot dimensions approximately 125 x 50
Interior
- Kitchen: No kitchen appliance list provided
- Bedrooms: 4 bedrooms (all on the main level)
- Flooring: Hardwood floors
- Bathrooms: 2 full bathrooms (on the main level)
- Heating & cooling: Other heating; Other cooling
- Interior features: Gas water heater; Full basement
- Laundry & utility: No washer/dryer or utility room details provided
Neighborhood map
What this means for you Summary
Snapshot
- This is a 4-bed/1.5-bath single-family listed at $120k.
Deal economics
- At list price, monthly cash flow is $426 ($5k/yr) — positive.
- The deal already cash-flows at list — no discount required.
- Meets the 1% rule at list price ($2k rent vs $120k).
- Recommended offer: $118k (1.5% below list) — sets the bar for market timing.
Location & tenants
- Location reads 58/100 on livability (#586 in MO) — a working-class tenant base; expect higher turnover. Strengths: cost of living A+, housing B+; Watch: health & safety C-, crime F, amenities F.
- Ferguson-Florissant R-II (suburban): math 7% / reading 20% proficiency, ranked #311 of 324 in MO (top 96%) — low school quality limits family demand, transient renter base, plan for 1-2y turnover; 70% free/reduced lunch — lower-income household profile, screen leases tightly.
- Zoned schools: Central Elementary (180 students, 98% FRL); Mccluer High (math 0% / reading 17%, grade F, #511 of 521 statewide, top 98%, 1,181 students, 100% FRL) — zoned schools average 99% FRL vs 70% district-wide (30 pts higher); higher-poverty schools than district average — tighter screening recommended.
- Market conditions: Rents rising fast (+9.0%/yr); 162 active listings in the ZIP; 40 comparable units currently listed for rent nearby; rentals at typical pace (median 24d on market — plan ~3-4 weeks tenant-placement turnaround); 48% of comp listings sitting > 30 days — soft ceiling on asking rent; 920 units permitted in St. Louis County in 2024 (250 in 5+ unit buildings).
- This rent runs 35% of the median local income ($52k/yr) — at the standard rent-burdened threshold; future hikes will face affordability resistance.
Forward outlook
- Local home prices are declining (-3.0%/yr); year-one equity from $829 of loan paydown is wiped out by about $4k of value loss. Plan a longer hold.
- At projected returns (-3.0% appreciation + 8.0% rent growth), your $34k cash investment doubles in ~6 years — after that, you're playing with house money.
Negotiation context
- It's been on market 20 days — a 2% lower offer ($118k) is reasonable based on typical stale-listing flexibility.
- Current owner paid $30k; list at $120k implies a 304% gain — meaningful room to come down on a strong offer.
Risks & watch-outs
- Watch-outs: built in 1954 — expect roof / HVAC / electrical / plumbing capex.
Questions for the listing agent
- Built in 1954 — when were the roof, HVAC, electrical panel, plumbing, and water heater last replaced?
- Is there a deadline driving the sale (1031 exchange, divorce, estate, relocation)? That informs how much negotiation room exists.
- Schools are F-rated, which usually means shorter tenancies and higher turnover. Who's the typical renter profile here, and what's been the actual vacancy rate?
- Crime grade is F in this area — have there been break-ins, vandalism, or insurance claims at this property in the last 3 years? What carrier currently insures it and at what premium?
- What's the average days-on-market for RENTAL listings here right now (not sales)? A rising rental-DOM trend means longer vacancies and softer asking-rent achievability than the comps imply.
- What's the recent tenant-quality profile in this submarket — average credit score on applications, eviction rate, late-payment / NSF rate, and stable-employment percentage? A property-management company in the area should have these aggregated.
- How much new for-sale + rental construction is in the pipeline within 1–3 miles? Heavy new supply typically softens prices + rents 12–24 months out; constrained supply supports both.
Investment metrics
- 1% rule
- 1.29% ✓
- Cap rate
- 10.56%
- Cash-on-cash
- 15.22%
- DSCR
- 1.68
- GRM
- 6.5
CMA / ARV
- ARV (on-the-fly)
- $125,840
- Comps found
- 12
Show comp detail 12 sales within ~0.75 mi
| Address | Dist | Beds/Ba | Sqft | Sold | Price | $/sf | Match |
|---|---|---|---|---|---|---|---|
| 315 Royal Ave | 0.26mi | 3/1.0 (-1) | 1,176 (-3%) | 3mo | $95,000 | $81 | 74 |
| 536 Ames Pl | 0.16mi | 3/1.5 (-1) | 1,304 (+8%) | 5mo | $69,900 | $54 | 70 |
| 406 Teston Dr | 0.10mi | 3/1.0 (-1) | 1,320 (+9%) | 4mo | $89,900 | $68 | 70 |
| 818 Robert Ave | 0.25mi | 3/1.0 (-1) | 1,137 (-6%) | 5mo | $120,000 | $106 | 67 |
| 206 Thoroughman Ave | 0.36mi | 4/2.5 | 1,112 (-8%) | 3mo | $180,000 | $162 | 63 |
| 127 Thoroughman Ave | 0.48mi | 4/2.0 | 1,132 (-6%) | 2mo | $219,999 | $194 | 63 |
| 509 Royal Ave | 0.16mi | 3/1.5 (-1) | 1,375 (+14%) | 3mo | $110,000 | $80 | 62 |
| 716 Nancy Pl | 0.48mi | 3/1.5 (-1) | 1,334 (+10%) | 4mo | $149,000 | $112 | 52 |
| 7 Bromley Dr | 0.60mi | 3/2.0 (-1) | 1,060 (-12%) | 2mo | $192,500 | $182 | 43 |
| 945 Edgehill Dr | 0.74mi | 3/1.0 (-1) | 1,110 (-8%) | 3mo | $114,900 | $104 | 42 |
| 1330 Chambers Rd | 0.68mi | 3/2.0 (-1) | 1,339 (+11%) | 3mo | $139,900 | $104 | 41 |
| 125 Forestwood Dr | 0.70mi | 3/1.0 (-1) | 1,032 (-15%) | 3mo | $77,900 | $75 | 34 |
Match score weights: distance 35% · size 25% · config 20% · recency 20%. Top-matched comps best support the ARV.
Projected returns pro-forma
-3.0% appreciation · 8.0% rent growth · sell at horizon
- IRR
- 11.3%
- Equity multiple
- 1.47×
- Total profit
- $15,881
- Equity at exit
- $17,877
- IRR
- 23.9%
- Equity multiple
- 3.56×
- Total profit
- $86,003
- Equity at exit
- $10,367
Cash invested: $33,572 (down + closing). Projections, not guarantees.
Landlord ↔ Tenant lean methodology
- Overall (STATE)
- 81 Strongly Landlord-Friendly
- State Missouri
- 81 Strongly Landlord-Friendly · R+10
- County
- — inherits STATE
- City
- — inherits STATE
ZIP-level market 63135
- Rents YoY
- 9.0%
- Active inventory
- 162
- Price-to-rent
- 6.5×
Monthly cashflow live
- Estimated rent
- $1,548 high interval (Pro) →
- Mortgage (P&I)
- −$629
- Tax from tax record
- −$118 /mo · $1,416/yr
- Insurance
- −$50
- HOA
- −$0
- Vacancy / Maint / Mgmt
- −$325
- Net cashflow
- $426
Break-even live
UW: 25.0% down · 7.5% · 30yr · 1.5% tax · 5.0% vac · 8.0% maint · 8.0% mgmt
Financing live
Cash to close
- Down payment
- $29,975
- Closing costs
- $3,597
- Reserves months
- —
- Total cash needed
- —
Loan-product check · same deal, 3 products live
Conventional
25% down · 7.5% · 30yr
- Down + closing
- —
- Monthly P&I
- —
- Monthly cashflow
- —
- DSCR
- —
- Eligible?
- —
Personal DTI + credit; lowest rate.
DSCR
20% down · 8.5% · 30yr
- Down + closing
- —
- Monthly P&I
- —
- Monthly cashflow
- —
- DSCR
- —
- Eligible?
- —
No personal income docs; deal must DSCR.
Hard money
10% down · 12.0% · 12mo
- Down + closing
- —
- Monthly P&I
- —
- Monthly cashflow
- —
- DSCR
- —
- Eligible?
- —
Short-term bridge; refi at stabilization.
Rent comps 40 comps
| Address | Beds | Baths | Sqft | Rent | $/sqft | DOM | Units | Dist |
|---|---|---|---|---|---|---|---|---|
| 401 Millman Dr Saint Louis, MO | 3.0 | 1.0 | 1008 | $1,450 | $1.44 | 16d | 1 | 0.09mi |
| 415 Ames Pl Saint Louis, MO | 3.0 | 1.0 | 816 | $1,400 | $1.72 | 43d | 1 | 0.10mi |
| 650 Robert Ave Ferguson, MO | 3.0 | 1.0 | 816 | $1,224 | $1.50 | 43d | 1 | 0.14mi |
| 536 Ames Pl Saint Louis, MO | 4.0 | 1.5 | 1305 | $1,750 | $1.34 | 1d | 1 | 0.15mi |
| 307 Coppinger Dr Saint Louis, MO | 3.0 | 1.0 | 960 | $1,095 | $1.14 | 17d | 1 | 0.20mi |
| 410 Robert Ave Ferguson, MO | 4.0 | 2.0 | 1471 | $2,000 | $1.36 | 11d | 1 | 0.26mi |
| 920 Hutton Pl Saint Louis, MO | 3.0 | 1.0 | 912 | $1,195 | $1.31 | 43d | 1 | 0.32mi |
| 13 N Hartnett Ave Saint Louis, MO | 3.0 | 1.0 | 1140 | $1,400 | $1.23 | 10d | 1 | 0.39mi |
| 104 Fenwick Dr Saint Louis, MO | 3.0 | 1.0 | 960 | $1,250 | $1.30 | 23d | 1 | 0.68mi |
| 227 Meadowcrest Dr Saint Louis, MO | 3.0 | 1.0 | 960 | $1,500 | $1.56 | 43d | 1 | 0.72mi |
| 945 Edgehill Dr Saint Louis, MO | 3.0 | 1.0 | 1110 | $1,575 | $1.42 | 43d | 1 | 0.77mi |
| 249 S Hartnett Ave Saint Louis, MO | 3.0 | 1.0 | 960 | $1,220 | $1.27 | 23d | 1 | 0.77mi |
| 324 Emmett Ave Saint Louis, MO | 3.0 | 2.0 | 1357 | $1,650 | $1.22 | 23d | 1 | 0.81mi |
| 338 Saint Louis Ave Saint Louis, MO | 3.0 | 1.0 | 1200 | $1,200 | $1.00 | 43d | 1 | 0.85mi |
| 296 Meadowcrest Dr Saint Louis, MO | 3.0 | 1.0 | 960 | $1,550 | $1.61 | 14d | 1 | 0.90mi |
| 110 Paul Ave Saint Louis, MO | 3.0 | 1.0 | 875 | $1,050 | $1.20 | 7d | 1 | 0.94mi |
| 246 Louisa Ave Saint Louis, MO | 3.0 | 1.0 | 1036 | $1,600 | $1.54 | 43d | 1 | 1.07mi |
| 10329 Chesley Dr Saint Louis, MO | 3.0 | 1.0 | 1014 | $1,350 | $1.33 | 23d | 1 | 1.15mi |
| 9845 Dennis Dr Saint Louis, MO | 3.0 | 1.0 | 960 | $1,550 | $1.61 | 12d | 1 | 1.16mi |
| 60 Mayme Dr Saint Louis, MO | 3.0 | 1.0 | 960 | $1,285 | $1.34 | 43d | 1 | 1.17mi |
| 1547 Babcock Dr Saint Louis, MO | 3.0 | 1.0 | 1014 | $1,480 | $1.46 | 43d | 1 | 1.18mi |
| 910 Disco Dr Saint Louis, MO | 3.0 | 1.0 | 924 | $1,260 | $1.36 | 16d | 1 | 1.22mi |
| 6156 Wulff Dr Saint Louis, MO | 3.0 | 2.0 | 960 | $1,425 | $1.48 | 10d | 1 | 1.22mi |
| 1654 Mowbry Ln Saint Louis, MO | 3.0 | 1.0 | 936 | $1,300 | $1.39 | 23d | 1 | 1.22mi |
| 223 Wiegel Dr Saint Louis, MO | 3.0 | 1.0 | 864 | $1,560 | $1.81 | 12d | 1 | 1.24mi |
| 9868 Lorna Ln Saint Louis, MO | 3.0 | 1.0 | 1032 | $1,175 | $1.14 | 43d | 1 | 1.26mi |
| 265 S Harvey Ave Saint Louis, MO | 3.0 | 1.5 | 1240 | $1,350 | $1.09 | 43d | 1 | 1.27mi |
| 6170 Emerald Ave Saint Louis, MO | 3.0 | 1.0 | 1286 | $1,500 | $1.17 | 14d | 1 | 1.30mi |
| 6170 Emerald Ave Saint Louis, MO | 3.0 | 1.0 | 1286 | $1,425 | $1.11 | 1d | 1 | 1.30mi |
| 6188 Dupree Ave Saint Louis, MO | 3.0 | 1.5 | 972 | $1,300 | $1.34 | 43d | 1 | 1.31mi |
| 9839 Medford Dr Saint Louis, MO | 3.0 | 1.0 | 912 | $1,095 | $1.20 | 43d | 1 | 1.33mi |
| 9717 Dennis Dr Saint Louis, MO | 3.0 | 1.0 | 1056 | $1,323 | $1.25 | 43d | 1 | 1.33mi |
| 846 Elsworth Pl Saint Louis, MO | 4.0 | 1.0 | 1352 | $1,600 | $1.18 | 4d | 1 | 1.33mi |
| 9840 Medford Dr Saint Louis, MO | 3.0 | 1.0 | 912 | $1,095 | $1.20 | 43d | 1 | 1.34mi |
| 9750 Lorna Ln Saint Louis, MO | 3.0 | 1.0 | 1032 | $1,100 | $1.07 | 43d | 1 | 1.37mi |
| 6333 Peurifoy Ave Saint Louis, MO | 3.0 | 2.0 | 840 | $1,295 | $1.54 | 23d | 1 | 1.39mi |
| 801 Thomas Ave Saint Louis, MO | 3.0 | 1.0 | 864 | $1,350 | $1.56 | 43d | 1 | 1.39mi |
| 519 Graf Ave Saint Louis, MO | 3.0 | 2.0 | 887 | $1,297 | $1.46 | 20d | 1 | 1.40mi |
| 6867 Thurston Ave Saint Louis, MO | 3.0 | 2.0 | 1243 | $1,580 | $1.27 | 43d | 1 | 1.42mi |
| 9725 Medford Dr Saint Louis, MO | 3.0 | 1.0 | 912 | $1,485 | $1.63 | 43d | 1 | 1.42mi |
Listing history 15 events
-
2026-06-19price $119,900 Active 20 DOM
-
2026-06-18days on market $124,900 Active 20 DOM
-
2026-06-17days on market $124,900 Active 19 DOM
-
2026-06-16days on market $124,900 Active 18 DOM
-
2026-06-15days on market $124,900 Active 17 DOM
-
2026-06-13days on market $124,900 Active 15 DOM
-
2026-06-13days on market $124,900 Active 14 DOM
-
2026-06-09days on market $124,900 Active 11 DOM
-
2026-06-08days on market $124,900 Active 10 DOM
-
2026-06-07days on market $124,900 Active 9 DOM
-
2026-06-05days on market $124,900 Active 6 DOM
-
2026-06-03days on market $124,900 Active 5 DOM
-
2026-06-02days on market $124,900 Active 4 DOM
-
2026-06-01days on market $124,900 Active 3 DOM
-
2026-05-31days on market $124,900 Active 2 DOM
ⓘ Source: listings_history table (triggers on properties + properties_extension) + one-shot
backfill from property_details.listing_events for pre-trigger history.
Tax reassessment forecast MO · Resets to sale price
- Current annual tax
- $1,416 · $118/mo
- Projected year-2 tax
- $1,416 · $118/mo
- Expected delta
- $0/yr ($0/mo · 0.0%)
ⓘ Screening estimate from a state-policy table — verify with the county assessor before closing.
Climate risk First Street
- Flood 1/10 Low FEMA zone X (unshaded) · 0% chance over 30 yrs
- Wildfire 1/10 Low
- Heat 4/10 Moderate 7 d/yr ≥106°F today · 19 d/yr by 30 yrs out
- Wind 2/10 Low 100% chance of damaging wind over 30 yrs
- Air quality 3/10 Moderate 3 unhealthy d/yr today · 5 by 30 yrs out
Nearby sold comps map
Loading sold comps map…
Walkable amenities ~0.75 mi
Loading nearby amenities…
Taxation est. · year 1
- Rental income
- $18,573
- − Mortgage interest
- −$6,716
- − Property taxes
- −$1,416
- − Insurance
- −$600
- − Repairs & maintenance
- −$1,486
- − Management
- −$1,486
- − Depreciation
- −$3,488
- Taxable income
- $3,381
- Est. tax owed @ 24.0%
- −$811
- After-tax cash flow
- $4,300/yr
For passive investors: Depreciation is non-cash, so a rental often shows a tax loss while cash-flowing — sheltering income. Rental losses are passive: they offset passive income freely, and up to $25,000/yr can offset ordinary (W-2) income if you actively participate and your MAGI is under $100k (phasing out to $0 by $150k); unused losses carry forward. On sale, claimed depreciation is recaptured at up to 25%, and gains may owe capital-gains tax (a 1031 exchange can defer both). Figures are a year-1 estimate at your 24.0% rate — not tax advice; consult a CPA.
Schools (NCES district)
- District
- Ferguson-Florissant R-II
- NCES district ID
- 2912010
- Math proficiency
- 7% ▼ -9.00%
- Reading proficiency
- 20% ▼ -6.00%
- Median HH income
- $44,610
- Composite
- 11.96/100
- National rank
- #9666
- State rank
- #311 of 324 in MO
Livability — Ferguson
- Score
- 58/100
- State rank
- #586
- US rank
- #20809
Category grades
Schools grade is shown separately in the Schools card above.
Census & demographics
- Census place
- Ferguson, MO
- County
- Saint Louis County · 888,823 people
- City population
- 18,381
- Metro
- St. Louis, MO-IL
- Population (ZIP)
- 18,381
- Household income
- $52,328
- Rent vs Own
- Severe rent burden
- 957.0
Population outlook (St. Louis County) Hauer SSP2
- Today (2025)
- 1,025,227 people
- By 2030
- 1,028,023 · +0.3%
- By 2040
- 1,020,940 · -0.4%
- By 2050
- 1,007,280 · -1.8%
- By 2075
- 987,277 · -3.7%
- By 2100
- 921,984 · -10.1%
Race, ethnicity, and origin ACS 2023
- Neighborhood character
- Predominantly Black (66%)
- Race & ethnicity
- Black 66% White 28% Two or more races 3% Hispanic / Latino 2%
- Common ancestry
- Lithuanian 1% Iranian 1% Romanian 1%
- Foreign-born
- 1% · Canada
- Languages at home
- 95% English-only · Spanish 4%
Political lean MEDSL · St. Louis
- 2024 margin
- Strong D (+23.4) · D 60.8% · R 37.4% · Other 1.7%
- 2008→2024 swing
- +3.5pp toward D · 2008: 19.9pp · 2024: 23.4pp
- All cycles
- 2024: D+23.4 2020: D+24.0 2016: D+16.2 2012: D+13.7 2008: D+19.9
Not yet ingested
- Civics
- —
Market trends
- HPI YoY
- ▼ -152.56%
- Current HPI
- 138.6781
- Rent YoY
- ▲ 9.03%
- Metro
- St. Louis, MO-IL
- State GDP YoY
- ▲ 1.84%
- F500 in state
- 20
Industry mix (Fortune 500 HQ in MO)
| Industry | F500 HQs | Revenue |
|---|---|---|
| Healthcare | 1 | $163B |
|
||
| Insurance | 1 | $21B |
|
||
| Industrial Technology | 1 | $17B |
|
||
| Retail | 1 | $16B |
|
||
| Industrial Distribution | 1 | $10B |
|
||
| Utilities | 1 | $9B |
|
||
Price history
+132.4% since first listed7 events — show timeline
- 2026-05-29 Listed $124,900 MARIS as Distributed by MLS Grid
- 2019-12-05 Sold (Public Records) $29,672 Public Records
- 2016-03-15 Sold (Public Records) $1,231,000 Public Records
- 2005-05-16 Sold (Public Records) $89,900 Public Records
- 2004-01-08 Sold (Public Records) $53,750 Public Records
- 1994-12-30 Sold (Public Records) — Public Records
- 1994-12-30 Sold (Public Records) — Public Records
Property tax history
+7.2%/yrLatest (2022): $1,416 · +3.3% YoY. Source: county tax records.
Cash-flow waterfall
monthlySold comps — $/sqft
last 12 mo · ≤1 miLoading sold comps…