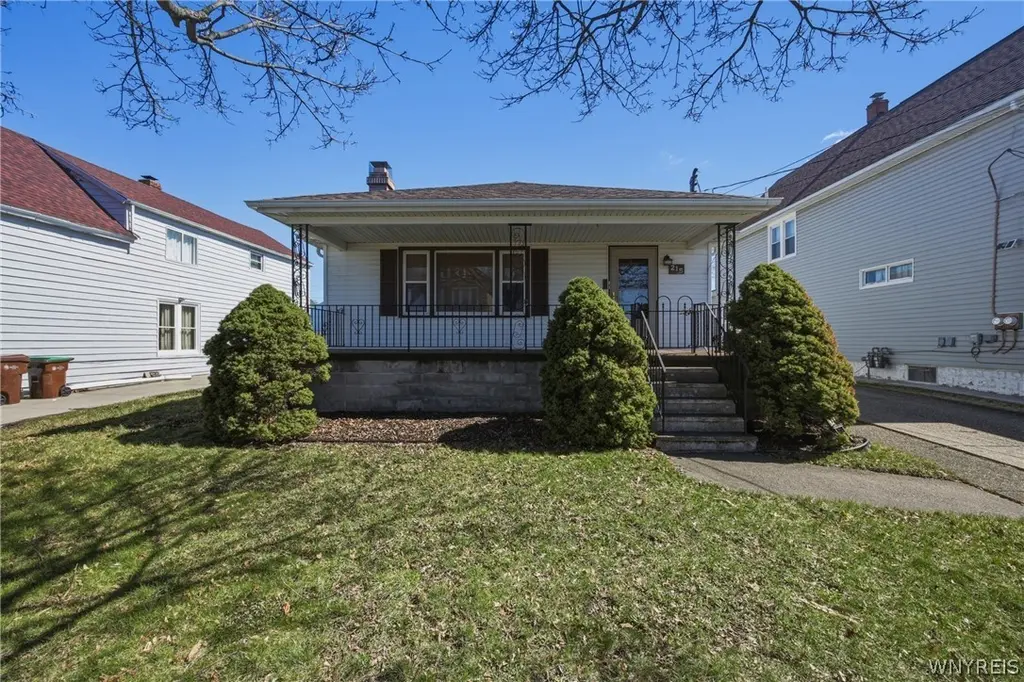
215 Halstead Ave · Sloan, NY
Flood risk 1/10 · Minimal
- FEMA flood zone
- X (unshaded)
- Chance of flooding over 30 yrs
- 0.0%
- Est. flood insurance / yr
- $473 – $860
Fire risk 1/10 · Minimal
- Est. fire insurance / yr
- $691 – $1,283
Heat risk 3/10 · Minor
- Hot days now (above 92°F)
- 7 days/yr
- Hot days in 30 yrs
- 15 days/yr
Wind risk 1/10 · Minimal
- Chance of severe wind over 30 yrs
- —
Air-quality risk 3/10 · Minor
- Unhealthy air days now
- 2 days/yr
- Unhealthy air days in 30 yrs
- 3 days/yr
Risk factors via First Street. Map © Google.
Why this score? — see what drove the C+ grade
The composite is a weighted blend of 9 inputs, each scored 0–100. Each bar is that input's sub-score; the figure is the points it added to the 100-point composite (weight × sub-score).
- ARV discount +15.0/15.0
- Cash flow +14.5/30.0
- Appreciation +10.0/10.0
- 1% rule +5.8/10.0
- DSCR +4.4/10.0
- Livability +3.8/5.0
- Schools +3.0/10.0
- Rent growth +2.5/5.0
- Condition / age +2.5/5.0
$139,900
🖨 Deal sheet (PDF) 📄 Offer letter ✓ Due diligence
Listing remarks
Welcome to 215 Halstead. , a well maintained, Ranch that has been in the same family since it was built with only two owners! This 3 bedroom, 2 FULL bath home has plenty to offer. The spacious living room/dining room combo has recessed lighting throughout, a gas fireplace and gorgeous wood built ins. The large kitchen comes with appliances. All 3 bedrooms have original hardwood floors and updated windows. Additional interior features include fresh paint, new vinyl flooring in the front entranceway (2026), and replacement vinyl windows (2012). The full dry basement is partially finished with the second full bathroom. Outside the large fully fenced in backyard has a 2 car detached garage (roo
Key facts
- Fresh paint
- Updated windows
- Gas fireplace
Tags
Neighborhood map
What this means for you Summary
Snapshot
- This is a 3-bed/1.0-bath single-family listed at $140k.
Deal economics
- At list price, monthly cash flow is $30 ($358/yr) — positive.
- The deal already cash-flows at list — no discount required.
- Meets the 1% rule at list price ($2k rent vs $140k).
Location & tenants
- Location reads 76/100 on livability (#215 in NY, #3,348 nationally) — a middle-class / working-renter tenant base. Strengths: cost of living A+, housing A+, health & safety A+; Watch: employment C-, amenities F.
- Cheektowaga-Sloan Union Free School District (urban): math 33% / reading 38% proficiency, ranked #555 of 590 in NY (top 94%) — families likely to look elsewhere, expect single-tenant / working-renter base with shorter leases.
- Zoned schools: Theodore Roosevelt School (328 students, 47% FRL); John F Kennedy Middle School (math 17% / reading 42%, grade F, #550 of 729 statewide, top 77%, 279 students, 54% FRL); John F Kennedy Senior High School (math 82% / reading 24%, grade C-, #934 of 1,100 statewide, top 86%, 370 students, 49% FRL).
- Market conditions: 84 active listings in the ZIP; 9 comparable units currently listed for rent nearby; rentals at typical pace (median 25d on market — plan ~3-4 weeks tenant-placement turnaround); 1,244 units permitted in Erie County in 2024 (563 in 5+ unit buildings).
Forward outlook
- In year one you build about $15k of equity ($967 loan paydown + $14k appreciation (10.0% local appreciation)).
- At projected returns (10.0% appreciation + 3.0% rent growth), your $39k cash investment doubles in ~3 years — after that, you're playing with house money.
- By year 3, paydown + projected appreciation supports a ~$38k cash-out refi (75% LTV) — recoverable capital for the next deal without selling this one.
Negotiation context
- Only 6 days on market — expect competitive offers; lowballing is unlikely to land.
- Current owner paid $64k; list at $140k implies a 119% gain — meaningful room to come down on a strong offer.
Risks & watch-outs
- Watch-outs: property tax is 3.2% of price; built in 1950 — expect roof / HVAC / electrical / plumbing capex.
Questions for the listing agent
- Built in 1950 — when were the roof, HVAC, electrical panel, plumbing, and water heater last replaced?
- Property tax is high relative to price — has the assessment been appealed recently, and will the sale trigger a re-assessment?
- Is there a deadline driving the sale (1031 exchange, divorce, estate, relocation)? That informs how much negotiation room exists.
- Schools are D-rated, which usually means shorter tenancies and higher turnover. Who's the typical renter profile here, and what's been the actual vacancy rate?
- What's the average days-on-market for RENTAL listings here right now (not sales)? A rising rental-DOM trend means longer vacancies and softer asking-rent achievability than the comps imply.
- What's the recent tenant-quality profile in this submarket — average credit score on applications, eviction rate, late-payment / NSF rate, and stable-employment percentage? A property-management company in the area should have these aggregated.
- How much new for-sale + rental construction is in the pipeline within 1–3 miles? Heavy new supply typically softens prices + rents 12–24 months out; constrained supply supports both.
Investment metrics
- 1% rule
- 1.08% ✓
- Cap rate
- 6.55%
- Cash-on-cash
- 0.91%
- DSCR
- 1.04
- GRM
- 7.7
CMA / ARV
- ARV (on-the-fly)
- $180,432
- Comps found
- 12
Show comp detail 12 sales within ~0.75 mi
| Address | Dist | Beds/Ba | Sqft | Sold | Price | $/sf | Match |
|---|---|---|---|---|---|---|---|
| 232 Roland St | 0.25mi | 3/2.0 | 1,048 (+4%) | 3mo | $92,700 | $88 | 75 |
| 317 Atlantic Ave | 0.19mi | 3/1.0 | 1,095 (+9%) | 3mo | $174,900 | $160 | 74 |
| 269 Michael Ave | 0.10mi | 3/1.5 | 940 (-7%) | 9mo | $165,000 | $176 | 74 |
| 109 Currier Ave | 0.23mi | 3/1.0 | 1,088 (+8%) | 8mo | $200,000 | $184 | 69 |
| 185 Wagner Ave | 0.33mi | 3/1.5 | 971 (-4%) | 12mo | $197,500 | $203 | 66 |
| 379 N Ogden St Unit E | 0.42mi | 3/1.0 | 1,083 (+7%) | 3mo | $160,000 | $148 | 65 |
| 169 Lackawanna Ave | 0.18mi | 3/1.5 | 1,116 (+11%) | 10mo | $220,000 | $197 | 64 |
| 102 Francis Ave | 0.32mi | 3/1.0 | 1,130 (+12%) | 4mo | $165,000 | $146 | 61 |
| 249 Crocker St | 0.34mi | 4/1.5 (+1) | 1,071 (+6%) | 10mo | $220,000 | $205 | 58 |
| 66 Gierlach St | 0.38mi | 2/1.0 (-1) | 1,113 (+10%) | 7mo | $203,000 | $182 | 54 |
| 74 Vanderbilt St | 0.71mi | 3/1.0 | 1,136 (+13%) | 3mo | $105,000 | $92 | 44 |
| 324 Ideal St | 0.73mi | 4/2.0 (+1) | 1,092 (+8%) | 6mo | $195,000 | $179 | 38 |
Match score weights: distance 35% · size 25% · config 20% · recency 20%. Top-matched comps best support the ARV.
Projected returns pro-forma
10.0% appreciation · 3.0% rent growth · sell at horizon
- IRR
- 25.0%
- Equity multiple
- 3.00×
- Total profit
- $78,237
- Equity at exit
- $126,033
- IRR
- 22.1%
- Equity multiple
- 6.85×
- Total profit
- $229,191
- Equity at exit
- $271,795
Cash invested: $39,172 (down + closing). Projections, not guarantees.
Landlord ↔ Tenant lean methodology
- Overall (STATE)
- 15 Strongly Tenant-Friendly
- State New York
- 15 Strongly Tenant-Friendly · D+10
- County
- — inherits STATE
- City
- — inherits STATE
ZIP-level market 14212
- Home prices YoY
- 20.4%
- Active inventory
- 84
- Price-to-rent
- 7.7×
Monthly cashflow live
- Estimated rent
- $1,513 high interval (Pro) →
- Mortgage (P&I)
- −$734
- Tax from tax record
- −$373 /mo · $4,482/yr
- Insurance
- −$58
- HOA
- −$0
- Vacancy / Maint / Mgmt
- −$318
- Net cashflow
- $30
Break-even live
Sensitivity live
| Price | -10% $109 | -5% $69 | +0% $30 | +5% $-10 | +10% $-49 |
|---|---|---|---|---|---|
| Rent | -10% $-90 | -5% $-30 | +0% $30 | +5% $90 | +10% $149 |
| Rate | -1.0pp $100 | -0.5pp $65 | base $30 | +0.5pp $-6 | +1.0pp $-43 |
UW: 25.0% down · 7.5% · 30yr · 1.5% tax · 5.0% vac · 8.0% maint · 8.0% mgmt
Financing live
Cash to close
- Down payment
- $34,975
- Closing costs
- $4,197
- Reserves months
- —
- Total cash needed
- —
Loan-product check · same deal, 3 products live
Conventional
25% down · 7.5% · 30yr
- Down + closing
- —
- Monthly P&I
- —
- Monthly cashflow
- —
- DSCR
- —
- Eligible?
- —
Personal DTI + credit; lowest rate.
DSCR
20% down · 8.5% · 30yr
- Down + closing
- —
- Monthly P&I
- —
- Monthly cashflow
- —
- DSCR
- —
- Eligible?
- —
No personal income docs; deal must DSCR.
Hard money
10% down · 12.0% · 12mo
- Down + closing
- —
- Monthly P&I
- —
- Monthly cashflow
- —
- DSCR
- —
- Eligible?
- —
Short-term bridge; refi at stabilization.
Rent comps 9 comps
| Address | Beds | Baths | Sqft | Rent | $/sqft | DOM | Units | Dist |
|---|---|---|---|---|---|---|---|---|
| 14 Rutland Ave Buffalo, NY | 4.0 | 1.0 | 1430 | $2,200 | $1.54 | 12d | 1 | 0.43mi |
| 1777 Broadway Unit 2 Buffalo, NY | 3.0 | 1.0 | 1300 | $1,200 | $0.92 | 45d | 1 | 0.77mi |
| 1202 Walden Ave Unit 2 Buffalo, NY | 3.0 | 1.0 | 800 | $1,350 | $1.69 | 45d | 1 | 0.80mi |
| 1202 Walden Ave Unit 3 Buffalo, NY | 3.0 | 1.0 | 1500 | $1,400 | $0.93 | 18d | 1 | 0.80mi |
| 24 Euclid Ave Buffalo, NY | 3.0 | 2.0 | 1150 | $1,700 | $1.48 | 45d | 1 | 0.84mi |
| 143 Reo Ave Buffalo, NY | 3.0 | 2.0 | 1143 | $1,600 | $1.40 | 13d | 1 | 1.11mi |
| 1150 Bailey Ave Buffalo, NY | 4.0 | 1.5 | 1100 | $1,200 | $1.09 | 25d | 1 | 1.27mi |
| 67 Moeller St Unit UPPER Buffalo, NY | 3.0 | 1.0 | 960 | $1,000 | $1.04 | 4d | 1 | 1.32mi |
| 67 Moeller St Unit LOWER Buffalo, NY | 3.0 | 1.0 | 960 | $1,200 | $1.25 | 25d | 1 | 1.32mi |
Listing history 3 events
-
2026-04-06status Pending
-
2026-03-31$139,900 Active
-
2010-11-18soldstatus $64,000
ⓘ Source: listings_history table (triggers on properties + properties_extension) + one-shot
backfill from property_details.listing_events for pre-trigger history.
Tax reassessment forecast NY · Partial reset (capped growth)
- Current annual tax
- $4,482 · $373/mo
- Projected year-2 tax
- $4,482 · $373/mo
- Expected delta
- $0/yr ($0/mo · 0.0%)
ⓘ Screening estimate from a state-policy table — verify with the county assessor before closing.
Climate risk First Street
- Flood 1/10 Low FEMA zone X (unshaded) · 0% chance over 30 yrs
- Wildfire 1/10 Low
- Heat 3/10 Moderate 7 d/yr ≥92°F today · 15 d/yr by 30 yrs out
- Wind 1/10 Low
- Air quality 3/10 Moderate 2 unhealthy d/yr today · 3 by 30 yrs out
Nearby sold comps map
Loading sold comps map…
Walkable amenities ~0.75 mi
Loading nearby amenities…
Taxation est. · year 1
- Rental income
- $18,156
- − Mortgage interest
- −$7,837
- − Property taxes
- −$4,482
- − Insurance
- −$700
- − Repairs & maintenance
- −$1,452
- − Management
- −$1,452
- − Depreciation
- −$4,070
- Taxable loss
- −$1,837
- Est. tax savings @ 24.0%
- +$441
- After-tax cash flow
- $799/yr
For passive investors: Depreciation is non-cash, so a rental often shows a tax loss while cash-flowing — sheltering income. Rental losses are passive: they offset passive income freely, and up to $25,000/yr can offset ordinary (W-2) income if you actively participate and your MAGI is under $100k (phasing out to $0 by $150k); unused losses carry forward. On sale, claimed depreciation is recaptured at up to 25%, and gains may owe capital-gains tax (a 1031 exchange can defer both). Figures are a year-1 estimate at your 24.0% rate — not tax advice; consult a CPA.
Schools (NCES district)
- District
- Cheektowaga-Sloan Union Free School District
- NCES district ID
- 3627000
- Math proficiency
- 33% ▼ -16.00%
- Reading proficiency
- 38% ▼ -6.00%
- Median HH income
- $45,810
- Composite
- 30.35/100
- National rank
- #6263
- State rank
- #555 of 590 in NY
Livability — Sloan
- Score
- 76/100
- State rank
- #215
- US rank
- #3348
Category grades
Schools grade is shown separately in the Schools card above.
Census & demographics
- Census place
- Sloan, NY
- Population (ZIP)
- 13,603
Population outlook (Erie County) Hauer SSP2
- Today (2025)
- 933,037 people
- By 2030
- 935,181 · +0.2%
- By 2040
- 928,531 · -0.5%
- By 2050
- 905,725 · -2.9%
- By 2075
- 834,037 · -10.6%
- By 2100
- 708,033 · -24.1%
Race, ethnicity, and origin ACS 2023
- Neighborhood character
- Highly diverse neighborhood (Simpson 0.75)
- Race & ethnicity
- White 32% Black 27% Asian 25% Hispanic / Latino 9% Two or more races 8%
- Hispanic origin (detail)
- Puerto Rican 8%
- Common ancestry
- Romanian 12% Serbian 1% Lithuanian 1%
- Foreign-born
- 20% · Philippines, Canada, China
- Languages at home
- 68% English-only · Other Indo-European 18% Spanish 4% Other Asian/Pacific 2%
Political lean MEDSL · Erie
- 2024 margin
- Lean D (+9.7) · D 54.8% · R 45.2%
- 2008→2024 swing
- -7.9pp toward R · 2008: 17.5pp · 2024: 9.7pp
- All cycles
- 2024: D+9.7 2020: D+14.7 2016: D+4.8 2012: D+15.6 2008: D+17.5
Not yet ingested
- Civics
- —
Market trends
- HPI YoY
- ▲ 79.80%
- Current HPI
- 471.6399
- Rent YoY
- —
- Metro
- —
- State GDP YoY
- ▲ 2.60%
- F500 in state
- 92
Industry mix (Fortune 500 HQ in NY)
| Industry | F500 HQs | Revenue |
|---|---|---|
| Financial Services | 10 | $950B |
|
||
| Consumer Goods | 9 | $162B |
|
||
| Insurance | 4 | $225B |
|
||
| Telecommunications | 2 | $144B |
|
||
| Pharmaceuticals | 2 | $112B |
|
||
| Media / Entertainment | 2 | $69B |
|
||
Price history
+118.6% since first listed3 events — show timeline
- 2026-04-06 Pending — WNYREIS
- 2026-03-31 Listed $139,900 WNYREIS
- 2010-11-18 Sold (Public Records) $64,000 Public Records
Property tax history
+8.0%/yrLatest (2025): $4,482 · +0.9% YoY. Source: county tax records.
Cash-flow waterfall
monthlySold comps — $/sqft
last 12 mo · ≤1 miLoading sold comps…