2810 Southside Rd · Utica, NY
Flood risk 1/10 · Minimal
- FEMA flood zone
- X
- Chance of flooding over 30 yrs
- 0.0%
- Est. flood insurance / yr
- $473 – $860
Fire risk 3/10 · Minor
- Est. fire insurance / yr
- $691 – $1,283
Heat risk 2/10 · Minimal
- Hot days now (above 96°F)
- 7 days/yr
- Hot days in 30 yrs
- 17 days/yr
Wind risk 1/10 · Minimal
- Chance of severe wind over 30 yrs
- 1.0%
Air-quality risk 2/10 · Minimal
- Unhealthy air days now
- 0 days/yr
- Unhealthy air days in 30 yrs
- 1 days/yr
Risk factors via First Street. Map © Google.
Why this score? — see what drove the C grade
The composite is a weighted blend of 9 inputs, each scored 0–100. Each bar is that input's sub-score; the figure is the points it added to the 100-point composite (weight × sub-score).
- Cash flow +16.3/30.0
- Appreciation +10.0/10.0
- ARV discount +7.5/15.0
- 1% rule +5.4/10.0
- DSCR +5.0/10.0
- Livability +4.0/5.0
- Schools +3.3/10.0
- Rent growth +2.5/5.0
- Condition / age +2.5/5.0
$189,900
🖨 Deal sheet 📄 Offer letter ✓ Due diligence
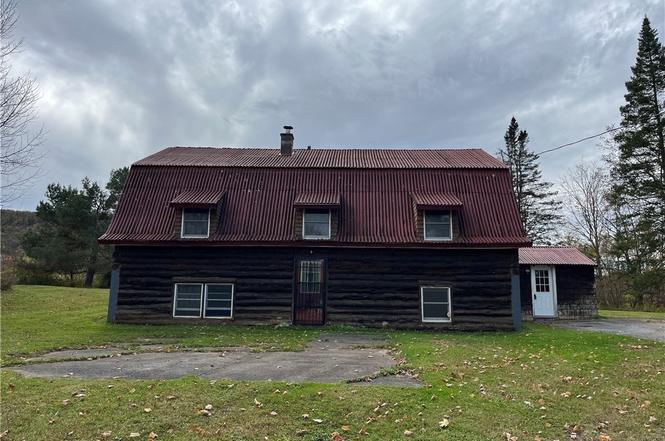
Listing remarks
Spacious & Flexible Layout! 4-bedrooms, 2-bath home in a convenient location in the Frankfort area. 2,400 sq/ft of living space. Home offers large room sizes throughout, generous bedrooms, a large open kitchen with eating/dining area, along with front and back stairways leading to the upstairs for easy access. The living room features a pellet stove, which is primarily used to heat the home. Exterior features include an enclosed three-season porch and a 1.37-acre lot offering tons of privacy. Home is in need of some TLC and finishing touches. Home has the potential to become a comfortable and expansive home tailored to your vision. Home is being sold "as is". Come take a loo
Key facts
- 1.37-acre lot
- Pellet stove
- Large open kitchen
Tags
Neighborhood map
What this means for you Summary
Snapshot
- This is a 4-bed/2.0-bath single-family listed at $190k.
Deal economics
- At list price, monthly cash flow is $104 ($1k/yr) — positive.
- The deal already cash-flows at list — no discount required.
- Meets the 1% rule at list price ($2k rent vs $190k).
- Recommended offer: $184k (3.0% below list) — sets the bar for market timing.
Location & tenants
- Location reads 80/100 on livability (#104 in NY, #1,589 nationally) — a professional / high-income tenant draw. Strengths: commute A+, cost of living A+, housing A+; Watch: employment D, schools D-, crime F.
- Frankfort-Schuyler Central School District (town): math 32% / reading 45% proficiency, ranked #538 of 590 in NY (top 91%) — families likely to look elsewhere, expect single-tenant / working-renter base with shorter leases.
- Market conditions: 40 active listings in the ZIP; 54 units permitted in Herkimer County in 2024 (0 in 5+ unit buildings).
Forward outlook
- In year one you build about $20k of equity ($1k loan paydown + $19k appreciation (10.0% local appreciation)).
- Herkimer County population projected at -24% by 2050 — secular population decline; favor cash flow + early exit over multi-decade hold.
- At projected returns (10.0% appreciation + 3.0% rent growth), your $53k cash investment doubles in ~3 years — after that, you're playing with house money.
- By year 2, paydown + projected appreciation supports a ~$33k cash-out refi (75% LTV) — recoverable capital for the next deal without selling this one.
Negotiation context
- It's been on market 58 days — a 3% lower offer ($184k) is reasonable based on typical stale-listing flexibility.
- 2 sale attempts with the ask held roughly flat each time — persistent listings suggest the price (not the market) is what's stuck; bring a comps-based counter.
Questions for the listing agent
- It's been on market 58 days. Have you received any prior offers? Is the seller open to a 3% concession, seller financing, or rate buy-down credit?
- Is there a deadline driving the sale (1031 exchange, divorce, estate, relocation)? That informs how much negotiation room exists.
- Schools are D-rated, which usually means shorter tenancies and higher turnover. Who's the typical renter profile here, and what's been the actual vacancy rate?
- Crime grade is F in this area — have there been break-ins, vandalism, or insurance claims at this property in the last 3 years? What carrier currently insures it and at what premium?
- What's the average days-on-market for RENTAL listings here right now (not sales)? A rising rental-DOM trend means longer vacancies and softer asking-rent achievability than the comps imply.
- What's the recent tenant-quality profile in this submarket — average credit score on applications, eviction rate, late-payment / NSF rate, and stable-employment percentage? A property-management company in the area should have these aggregated.
- How much new for-sale + rental construction is in the pipeline within 1–3 miles? Heavy new supply typically softens prices + rents 12–24 months out; constrained supply supports both.
Investment metrics
- 1% rule
- 1.04% ✓
- Cap rate
- 6.95%
- Cash-on-cash
- 2.35%
- DSCR
- 1.10
- GRM
- 8.0
CMA / ARV
No comps found within radius.
Projected returns pro-forma
10.0% appreciation · 3.0% rent growth · sell at horizon
- IRR
- 26.0%
- Equity multiple
- 3.07×
- Total profit
- $110,173
- Equity at exit
- $171,077
- IRR
- 22.8%
- Equity multiple
- 7.01×
- Total profit
- $319,468
- Equity at exit
- $368,934
Cash invested: $53,172 (down + closing). Projections, not guarantees.
Landlord ↔ Tenant lean methodology
- Overall (STATE)
- 15 Strongly Tenant-Friendly
- State New York
- 15 Strongly Tenant-Friendly · D+10
- County
- — inherits STATE
- City
- — inherits STATE
ZIP-level market 13340
- Home prices YoY
- 8.1%
- Active inventory
- 40
- Price-to-rent
- 8.0×
Monthly cashflow live
- Estimated rent
- $1,979 medium interval (Pro) →
- Mortgage (P&I)
- −$996
- Tax from tax record
- −$384 /mo · $4,610/yr
- Insurance
- −$79
- HOA
- −$0
- Vacancy / Maint / Mgmt
- −$416
- Net cashflow
- $104
Break-even live
UW: 25.0% down · 7.5% · 30yr · 1.5% tax · 5.0% vac · 8.0% maint · 8.0% mgmt
Financing live
Cash to close
- Down payment
- $47,475
- Closing costs
- $5,697
- Reserves months
- —
- Total cash needed
- —
Loan-product check · same deal, 3 products live
Conventional
25% down · 7.5% · 30yr
- Down + closing
- —
- Monthly P&I
- —
- Monthly cashflow
- —
- DSCR
- —
- Eligible?
- —
Personal DTI + credit; lowest rate.
DSCR
20% down · 8.5% · 30yr
- Down + closing
- —
- Monthly P&I
- —
- Monthly cashflow
- —
- DSCR
- —
- Eligible?
- —
No personal income docs; deal must DSCR.
Hard money
10% down · 12.0% · 12mo
- Down + closing
- —
- Monthly P&I
- —
- Monthly cashflow
- —
- DSCR
- —
- Eligible?
- —
Short-term bridge; refi at stabilization.
Listing history 8 events
-
2026-03-31status Pending
-
2026-03-13historical Active Under Contract
-
2026-02-01$189,900 Active
-
2026-01-18historical
-
2026-01-17historical
-
2025-11-25price $210,000
-
2025-10-30price $219,900
-
2025-10-08$224,900 Active
ⓘ Source: listings_history table (triggers on properties + properties_extension) + one-shot
backfill from property_details.listing_events for pre-trigger history.
Tax reassessment forecast NY · Partial reset (capped growth)
- Current annual tax
- $4,610 · $384/mo
- Projected year-2 tax
- $4,610 · $384/mo
- Expected delta
- $0/yr ($0/mo · 0.0%)
ⓘ Screening estimate from a state-policy table — verify with the county assessor before closing.
Climate risk First Street
- Flood 1/10 Low FEMA zone X · 0% chance over 30 yrs
- Wildfire 3/10 Moderate
- Heat 2/10 Low 7 d/yr ≥96°F today · 17 d/yr by 30 yrs out
- Wind 1/10 Low 100% chance of damaging wind over 30 yrs
- Air quality 2/10 Low 0 unhealthy d/yr today · 1 by 30 yrs out
Nearby sold comps map
Loading sold comps map…
Walkable amenities ~0.75 mi
Loading nearby amenities…
Taxation est. · year 1
- Rental income
- $23,746
- − Mortgage interest
- −$10,637
- − Property taxes
- −$4,610
- − Insurance
- −$950
- − Repairs & maintenance
- −$1,900
- − Management
- −$1,900
- − Depreciation
- −$5,524
- Taxable loss
- −$1,775
- Est. tax savings @ 24.0%
- +$426
- After-tax cash flow
- $1,675/yr
For passive investors: Depreciation is non-cash, so a rental often shows a tax loss while cash-flowing — sheltering income. Rental losses are passive: they offset passive income freely, and up to $25,000/yr can offset ordinary (W-2) income if you actively participate and your MAGI is under $100k (phasing out to $0 by $150k); unused losses carry forward. On sale, claimed depreciation is recaptured at up to 25%, and gains may owe capital-gains tax (a 1031 exchange can defer both). Figures are a year-1 estimate at your 24.0% rate — not tax advice; consult a CPA.
Schools (NCES district)
- District
- Frankfort-Schuyler Central School District
- NCES district ID
- 3611400
- Math proficiency
- 32% ▼ -12.00%
- Reading proficiency
- 45% ▲ 3.00%
- Median HH income
- $46,499
- Composite
- 32.87/100
- National rank
- #5610
- State rank
- #538 of 590 in NY
Livability — Utica
- Score
- 80/100
- State rank
- #104
- US rank
- #1589
Category grades
Schools grade is shown separately in the Schools card above.
Census & demographics
- City population
- 72,968
- Population (ZIP)
- 7,322
Population outlook (Herkimer County) Hauer SSP2
- Today (2025)
- 59,340 people
- By 2030
- 56,838 · -4.2%
- By 2040
- 51,098 · -13.9%
- By 2050
- 45,080 · -24.0%
- By 2075
- 32,648 · -45.0%
- By 2100
- 22,266 · -62.5%
Race, ethnicity, and origin ACS 2023
- Neighborhood character
- Predominantly White (91%)
- Race & ethnicity
- White 91% Two or more races 4% Black 2% Hispanic / Latino 1%
- Common ancestry
- Romanian 7% Lithuanian 3% American 2%
- Foreign-born
- 8% · Canada
- Languages at home
- 90% English-only · Russian/Polish/Slavic 6% Other Indo-European 2% Spanish 1%
Political lean MEDSL · Herkimer
- 2024 margin
- Solid R (+36.4) · D 31.8% · R 68.2%
- 2008→2024 swing
- -27.1pp toward R · 2008: -9.3pp · 2024: -36.4pp
- All cycles
- 2024: R+36.4 2020: R+30.5 2016: R+34.5 2012: R+8.4 2008: R+9.3
Not yet ingested
- Civics
- —
Market trends
- HPI YoY
- ▲ 25.15%
- Current HPI
- 336.077
- Rent YoY
- —
- Metro
- —
- State GDP YoY
- ▲ 2.60%
- F500 in state
- 92
Industry mix (Fortune 500 HQ in NY)
| Industry | F500 HQs | Revenue |
|---|---|---|
| Financial Services | 10 | $950B |
|
||
| Consumer Goods | 9 | $162B |
|
||
| Insurance | 4 | $225B |
|
||
| Telecommunications | 2 | $144B |
|
||
| Pharmaceuticals | 2 | $112B |
|
||
| Media / Entertainment | 2 | $69B |
|
||
Price history
-15.6% since first listed8 events — show timeline
- 2026-03-31 Pending — CNYIS
- 2026-03-13 Contingent — CNYIS
- 2026-02-01 Listed $189,900 CNYIS
- 2026-01-18 Listing Removed — CNYIS
- 2026-01-17 Listing Removed — CNYIS
- 2025-11-25 Price Changed $210,000 CNYIS
- 2025-10-30 Price Changed $219,900 CNYIS
- 2025-10-08 Listed $224,900 CNYIS
Property tax history
+2.9%/yrLatest (2025): $4,610 · +0.5% YoY. Source: county tax records.
Cash-flow waterfall
monthlySold comps — $/sqft
last 12 mo · ≤1 miLoading sold comps…