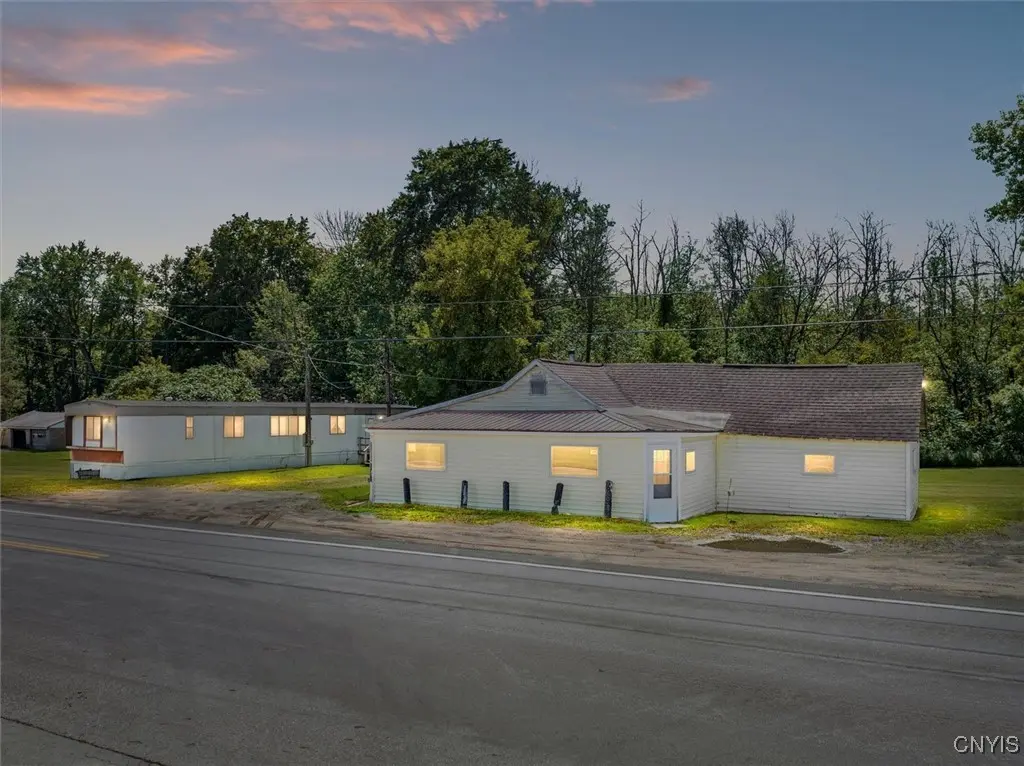
8460 Old River Rd · Rome, NY
Flood risk No data
- FEMA flood zone
- —
- Chance of flooding over 30 yrs
- —
- Est. flood insurance / yr
- —
Fire risk No data
- Est. fire insurance / yr
- —
Heat risk No data
- Hot days now (above threshold)
- —
- Hot days in 30 yrs
- —
Wind risk No data
- Chance of severe wind over 30 yrs
- —
Air-quality risk No data
- Unhealthy air days now
- —
- Unhealthy air days in 30 yrs
- —
Risk factors via First Street. Map © Google.
Why this score? — see what drove the B grade
The composite is a weighted blend of 9 inputs, each scored 0–100. Each bar is that input's sub-score; the figure is the points it added to the 100-point composite (weight × sub-score).
- Cash flow +26.4/30.0
- Appreciation +10.0/10.0
- DSCR +9.0/10.0
- ARV discount +7.5/15.0
- 1% rule +7.0/10.0
- Schools +4.7/10.0
- Livability +3.2/5.0
- Rent growth +2.5/5.0
- Condition / age +2.2/5.0
$139,000
🖨 Deal sheet 📄 Offer letter ✓ Due diligence
Listing remarks MLS
Unlock the Potential of this Multi-Income Opportunity! Perfectly situated at the high-visibility corner of Old River Road and Ritchie Road, this unique property offers a rare "Live-Work" configuration with unmatched flexibility. Formerly the site of the well-known Merrill’s Bar & Restaurant, the main structure features a spacious layout with ample parking—ideal for a home-based business, professional studio, or creative conversion. Includes a fully furnished 3-bed, 2-bath mobile home, perfect for immediate rental income or on-site living while you build your dream venture. The sale includes an additional bordering lot (100 x 205.24), providing plenty of space for expansion, outdoor seating, or additional structures. Currently zoned residential, this property is a "blank slate" for the visionary buyer. Whether you envision a grand single-family estate with a massive workshop or wish to bring your business dreams to the planning board for approval, the infrastructure is already in place. Priced to move and packed with value, this is an incredible chance for entrepreneurs or investors to secure a prime corner location with multiple revenue streams. Bring your vision and make it a reality—call today!
Key facts
- Ample parking
- Live work setup
- 1.2 acre lot
Tags
Neighborhood map
What this means for you Summary
Snapshot
- This is a 3-bed/1.5-bath manufactured listed at $139k. Condition is rated fair.
Deal economics
- At list price, monthly cash flow is $362 ($4k/yr) — positive.
- The deal already cash-flows at list — no discount required.
- Meets the 1% rule at list price ($2k rent vs $139k).
- Recommended offer: $122k (12.0% below list) — sets the bar for market timing.
- Cap rate 9.4% vs local median 5.6% in Rome — top-decile yield for the area; either an underpriced asset or a hidden risk that comps aren't pricing in. Stress-test before assuming the spread holds.
Location & tenants
- Location reads 64/100 on livability (#722 in NY) — a middle-class / working-renter tenant base. Strengths: cost of living A+, housing A+; Watch: health & safety C-, schools F, amenities F.
- Oriskany Central School District (suburban): math 52% / reading 56% proficiency, ranked #314 of 590 in NY (top 53%) — acceptable for families but not a draw, mixed tenant base, ~2y average lease.
- Market conditions: 23 active listings in the ZIP; 204 units permitted in Oneida County in 2024 (68 in 5+ unit buildings).
Forward outlook
- In year one you build about $15k of equity ($961 loan paydown + $14k appreciation (10.0% local appreciation)).
- Oneida County population projected at -12% by 2050 — secular population decline; favor cash flow + early exit over multi-decade hold.
- At projected returns (10.0% appreciation + 3.0% rent growth), your $39k cash investment doubles in ~2 years — after that, you're playing with house money.
- By year 3, paydown + projected appreciation supports a ~$38k cash-out refi (75% LTV) — recoverable capital for the next deal without selling this one.
Negotiation context
- It's been on market 481 days — a 12% lower offer ($122k) is reasonable based on typical stale-listing flexibility.
Risks & watch-outs
- Watch-outs: built in 1950 — expect roof / HVAC / electrical / plumbing capex.
Questions for the listing agent
- It's been on market 481 days. Have you received any prior offers? Is the seller open to a 12% concession, seller financing, or rate buy-down credit?
- Have any recent inspections been done? Can we get a copy of the seller's disclosures and any deferred-maintenance estimates?
- Built in 1950 — when were the roof, HVAC, electrical panel, plumbing, and water heater last replaced?
- Why hasn't it sold? Are there any deal-killer items the seller is aware of (foundation, flood, title, zoning, code violations)?
- Is there a deadline driving the sale (1031 exchange, divorce, estate, relocation)? That informs how much negotiation room exists.
- Schools are F-rated, which usually means shorter tenancies and higher turnover. Who's the typical renter profile here, and what's been the actual vacancy rate?
- What's the average days-on-market for RENTAL listings here right now (not sales)? A rising rental-DOM trend means longer vacancies and softer asking-rent achievability than the comps imply.
- What's the recent tenant-quality profile in this submarket — average credit score on applications, eviction rate, late-payment / NSF rate, and stable-employment percentage? A property-management company in the area should have these aggregated.
- How much new for-sale + rental construction is in the pipeline within 1–3 miles? Heavy new supply typically softens prices + rents 12–24 months out; constrained supply supports both.
Investment metrics
- 1% rule
- 1.20% ✓
- Cap rate
- 9.42%
- Cash-on-cash
- 11.17%
- DSCR
- 1.50
- GRM
- 6.9
CMA / ARV
No comps found within radius.
Projected returns pro-forma
10.0% appreciation · 3.0% rent growth · sell at horizon
- IRR
- 32.5%
- Equity multiple
- 3.54×
- Total profit
- $98,803
- Equity at exit
- $125,222
- IRR
- 28.0%
- Equity multiple
- 8.01×
- Total profit
- $272,862
- Equity at exit
- $270,046
Cash invested: $38,920 (down + closing). Projections, not guarantees.
Landlord ↔ Tenant lean methodology
- Overall (STATE)
- 15 Strongly Tenant-Friendly
- State New York
- 15 Strongly Tenant-Friendly · D+10
- County
- — inherits STATE
- City
- — inherits STATE
ZIP-level market 13403
- Home prices YoY
- 21.3%
- Active inventory
- 23
- Price-to-rent
- 6.9×
Monthly cashflow live
- Estimated rent
- $1,675 medium interval (Pro) →
- Mortgage (P&I)
- −$729
- Tax est. 1.5%
- −$174 /mo · $2,085/yr
- Insurance
- −$58
- HOA
- −$0
- Vacancy / Maint / Mgmt
- −$352
- Net cashflow
- $362
Break-even live
UW: 25.0% down · 7.5% · 30yr · 1.5% tax · 5.0% vac · 8.0% maint · 8.0% mgmt
Financing live
Cash to close
- Down payment
- $34,750
- Closing costs
- $4,170
- Reserves months
- —
- Total cash needed
- —
Loan-product check · same deal, 3 products live
Conventional
25% down · 7.5% · 30yr
- Down + closing
- —
- Monthly P&I
- —
- Monthly cashflow
- —
- DSCR
- —
- Eligible?
- —
Personal DTI + credit; lowest rate.
DSCR
20% down · 8.5% · 30yr
- Down + closing
- —
- Monthly P&I
- —
- Monthly cashflow
- —
- DSCR
- —
- Eligible?
- —
No personal income docs; deal must DSCR.
Hard money
10% down · 12.0% · 12mo
- Down + closing
- —
- Monthly P&I
- —
- Monthly cashflow
- —
- DSCR
- —
- Eligible?
- —
Short-term bridge; refi at stabilization.
Listing history 15 events
-
2026-06-18days on market $139,000 Active 481 DOM
-
2026-06-17days on market $139,000 Active 480 DOM
-
2026-06-16days on market $139,000 Active 479 DOM
-
2026-06-15days on market $139,000 Active 478 DOM
-
2026-06-13days on market $139,000 Active 476 DOM
-
2026-06-12days on market $139,000 Active 475 DOM
-
2026-06-09days on market $139,000 Active 472 DOM
-
2026-06-08days on market $139,000 Active 471 DOM
-
2026-06-07days on market $139,000 Active 470 DOM
-
2026-06-07days on market $139,000 Active 469 DOM
-
2026-06-04days on market $139,000 Active 466 DOM
-
2026-06-02days on market $139,000 Active 465 DOM
-
2026-06-01days on market $139,000 Active 464 DOM
-
2026-05-31days on market $139,000 Active 463 DOM
-
2025-02-22$139,000 Active 1259-char remark
Show marketing remark (1259 chars)
Unlock the Potential of this Multi-Income Opportunity! Perfectly situated at the high-visibility corner of Old River Road and Ritchie Road, this unique property offers a rare "Live-Work" configuration with unmatched flexibility. Formerly the site of the well-known Merrill’s Bar & Restaurant, the main structure features a spacious layout with ample parking—ideal for a home-based business, professional studio, or creative conversion. Includes a fully furnished 3-bed, 2-bath mobile home, perfect for immediate rental income or on-site living while you build your dream venture. The sale includes an additional bordering lot (100 x 205.24), providing plenty of space for expansion, outdoor seating, or additional structures. Currently zoned residential, this property is a "blank slate" for the visionary buyer. Whether you envision a grand single-family estate with a massive workshop or wish to bring your business dreams to the planning board for approval, the infrastructure is already in place. Priced to move and packed with value, this is an incredible chance for entrepreneurs or investors to secure a prime corner location with multiple revenue streams. Bring your vision and make it a reality—call today!
ⓘ Source: listings_history table (triggers on properties + properties_extension) + one-shot
backfill from property_details.listing_events for pre-trigger history.
Nearby sold comps map
Loading sold comps map…
Walkable amenities ~0.75 mi
Loading nearby amenities…
Taxation est. · year 1
- Rental income
- $20,094
- − Mortgage interest
- −$7,786
- − Property taxes
- −$2,085
- − Insurance
- −$695
- − Repairs & maintenance
- −$1,608
- − Management
- −$1,608
- − Depreciation
- −$4,044
- Taxable income
- $2,270
- Est. tax owed @ 24.0%
- −$545
- After-tax cash flow
- $3,803/yr
For passive investors: Depreciation is non-cash, so a rental often shows a tax loss while cash-flowing — sheltering income. Rental losses are passive: they offset passive income freely, and up to $25,000/yr can offset ordinary (W-2) income if you actively participate and your MAGI is under $100k (phasing out to $0 by $150k); unused losses carry forward. On sale, claimed depreciation is recaptured at up to 25%, and gains may owe capital-gains tax (a 1031 exchange can defer both). Figures are a year-1 estimate at your 24.0% rate — not tax advice; consult a CPA.
Condition & rehab AI · 1 photo
This multi-income opportunity requires significant repairs and updates to improve its condition and value. Potential investors should consider the extensive work needed to bring the property up to a livable and marketable standard.
Repairs flagged
- Major kitchen — No photos of kitchen
- Major bath — No photos of bathrooms
- Major flooring — No photos of flooring
- Major interior walls/paint — No photos of interior walls
- Major windows — No photos of windows
- Major HVAC/mechanicals — No photos of HVAC
- Major landscaping — No photos of landscaping
Value-add opportunities
- Both paint interior walls — Enhances curb appeal and interior aesthetics
- Both repair flooring — Improves living conditions and resale value
- Both replace windows — Enhances energy efficiency and curb appeal
- Both update HVAC — Improves comfort and energy efficiency
Renovation cost estimate screening
| Repair item | Severity | Est. cost |
|---|---|---|
| kitchen · No photos of kitchen | Major | $15,000–50,000 |
| bath · No photos of bathrooms | Major | $15,000–50,000 |
| flooring · No photos of flooring | Major | $15,000–50,000 |
| interior walls/paint · No photos of interior walls | Major | $15,000–50,000 |
| windows · No photos of windows | Major | $15,000–50,000 |
| HVAC/mechanicals · No photos of HVAC | Major | $15,000–50,000 |
| landscaping · No photos of landscaping | Major | $15,000–50,000 |
| Total estimated repair cost · 7 items | $105,000–350,000 |
Value-add ROI direction
- Both paint interior walls — Enhances curb appeal and interior aesthetics ↑
- Both repair flooring — Improves living conditions and resale value ↑
- Both replace windows — Enhances energy efficiency and curb appeal ↑
- Both update HVAC — Improves comfort and energy efficiency ↑
ⓘ Cost ranges are severity-bucket heuristics (US national rule-of-thumb). Get contractor quotes + a written scope before underwriting a rehab budget.
Schools (NCES district)
- District
- Oriskany Central School District
- NCES district ID
- 3621960
- Math proficiency
- 52% ▼ -10.00%
- Reading proficiency
- 56% ▲ 4.00%
- Median HH income
- $55,286
- Composite
- 46.6/100
- National rank
- #2419
- State rank
- #314 of 590 in NY
Livability — Rome
- Score
- 64/100
- State rank
- #722
- US rank
- #13676
Category grades
Schools grade is shown separately in the Schools card above.
Census & demographics
- City population
- 41,418
- Population (ZIP)
- 7,133
Population outlook (Oneida County) Hauer SSP2
- Today (2025)
- 225,223 people
- By 2030
- 220,384 · -2.1%
- By 2040
- 209,071 · -7.2%
- By 2050
- 197,920 · -12.1%
- By 2075
- 175,541 · -22.1%
- By 2100
- 148,491 · -34.1%
Race, ethnicity, and origin ACS 2023
- Neighborhood character
- Predominantly White (80%)
- Race & ethnicity
- White 80% Black 11% Hispanic / Latino 7% Two or more races 2% Asian 1%
- Hispanic origin (detail)
- Puerto Rican 1%
- Common ancestry
- Romanian 24% Lithuanian 3% Slovak 1%
- Foreign-born
- 5% · Canada
- Languages at home
- 90% English-only · Spanish 4% Russian/Polish/Slavic 4% Other Asian/Pacific 1%
Political lean MEDSL · Oneida
- 2024 margin
- Strong R (+21.3) · D 39.4% · R 60.6%
- 2008→2024 swing
- -15.2pp toward R · 2008: -6.1pp · 2024: -21.3pp
- All cycles
- 2024: R+21.3 2020: R+15.5 2016: R+21.1 2012: R+5.3 2008: R+6.1
Not yet ingested
- Civics
- —
Market trends
- HPI YoY
- ▲ 54.39%
- Current HPI
- 309.4119
- Rent YoY
- —
- Metro
- —
- State GDP YoY
- ▲ 2.60%
- F500 in state
- 92
Industry mix (Fortune 500 HQ in NY)
| Industry | F500 HQs | Revenue |
|---|---|---|
| Financial Services | 10 | $950B |
|
||
| Consumer Goods | 9 | $162B |
|
||
| Insurance | 4 | $225B |
|
||
| Telecommunications | 2 | $144B |
|
||
| Pharmaceuticals | 2 | $112B |
|
||
| Media / Entertainment | 2 | $69B |
|
||
Price history
1 event — show timeline
- 2025-02-22 Listed $139,000 CNYIS
Cash-flow waterfall
monthlySold comps — $/sqft
last 12 mo · ≤1 miLoading sold comps…