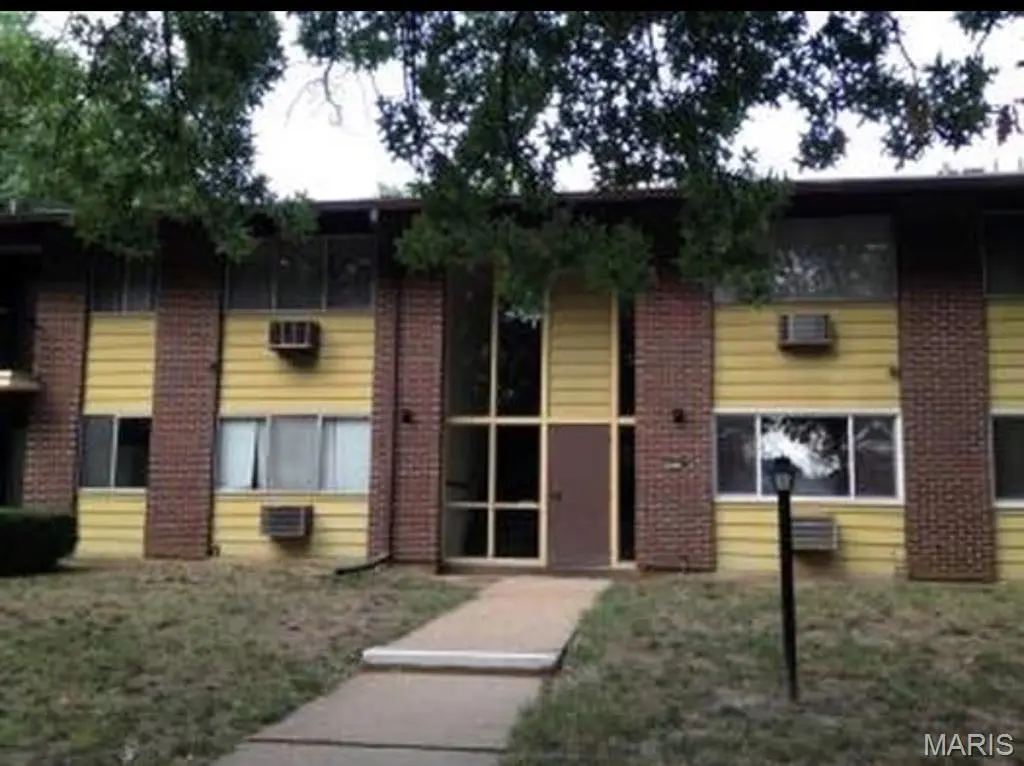
7411 Sieloff Dr Unit A · Hazelwood, MO
Flood risk 1/10 · Minimal
- FEMA flood zone
- X (unshaded)
- Chance of flooding over 30 yrs
- 0.0%
- Est. flood insurance / yr
- $507 – $1,088
Fire risk 1/10 · Minimal
- Est. fire insurance / yr
- $1,054 – $1,958
Heat risk 5/10 · Moderate
- Hot days now (above 105°F)
- 7 days/yr
- Hot days in 30 yrs
- 21 days/yr
Wind risk 2/10 · Minimal
- Chance of severe wind over 30 yrs
- 1.0%
Air-quality risk 3/10 · Minor
- Unhealthy air days now
- 3 days/yr
- Unhealthy air days in 30 yrs
- 5 days/yr
Risk factors via First Street. Map © Google.
Why this score? — see what drove the B- grade
The composite is a weighted blend of 9 inputs, each scored 0–100. Each bar is that input's sub-score; the figure is the points it added to the 100-point composite (weight × sub-score).
- Cash flow +30.0/30.0
- 1% rule +10.0/10.0
- DSCR +10.0/10.0
- ARV discount +7.5/15.0
- Rent growth +3.6/5.0
- Livability +3.1/5.0
- Condition / age +2.5/5.0
- Schools +1.2/10.0
- Appreciation +0.0/10.0
$39,500
🖨 Deal sheet (PDF) 📄 Offer letter ✓ Due diligence
Listing remarks
Nice Hazelcrest Condo with 1 bedroom 2 ac units, fridge and stove, good sized bathroom. Sliding Patio door. New Water heater replaced in 2025. Very quite neighborhood. Private assigned Parking. First Floor Unit with First Floor onsite Laundry. Hurry at this Price it wont last.
Key facts
- $191 HOA
- Built 1966
- Listed 3 days
Property features AI
Finance
- HOA & community: HOA: Hazelcrest III Condo; Monthly association fee of $191; HOA includes: maintenance of grounds, parking fee, sewer, snow removal, trash, water; Community amenities: clubhouse, common ground, parking
Exterior
- Parking: Association provides parking
- Utilities: Public water; Public sewer; Electric service includes 220 volts; other; Electricity available
- Home design: Residential condominium; One story
- Construction: Wood siding construction
- Exterior features: Wood siding
Interior
- Bedrooms: One bedroom on the main level
- Bathrooms: One full bathroom on the main level
- Heating & cooling: Baseboard heating; Window air conditioning unit(s)
- Interior features: Adjoins common ground
Neighborhood map
What this means for you Summary
Snapshot
- This is a 1-bed/1.0-bath condo listed at $40k.
Deal economics
- At list price, monthly cash flow is $411 ($5k/yr) — positive.
- The deal already cash-flows at list — no discount required.
- Meets the 1% rule at list price ($1k rent vs $40k).
- Cap rate 18.8% vs local median 7.2% in Hazelwood — top-decile yield for the area; either an underpriced asset or a hidden risk that comps aren't pricing in. Stress-test before assuming the spread holds.
Location & tenants
- Location reads 62/100 on livability (#395 in MO) — a middle-class / working-renter tenant base. Strengths: cost of living A+, housing A+; Watch: crime F, amenities F, commute F.
- Ferguson-Florissant R-II (suburban): math 7% / reading 20% proficiency, ranked #311 of 324 in MO (top 96%) — low school quality limits family demand, transient renter base, plan for 1-2y turnover; 70% free/reduced lunch — lower-income household profile, screen leases tightly.
- Zoned schools: Duchesne Elementary (248 students, 99% FRL); Mccluer North High (math 5% / reading 28%, grade F, #487 of 521 statewide, top 93%, 1,136 students, 100% FRL) — zoned schools average 99% FRL vs 70% district-wide (30 pts higher); higher-poverty schools than district average — tighter screening recommended.
- Market conditions: Rents rising fast (+4.5%/yr); 68 active listings in the ZIP; 4 comparable units currently listed for rent nearby; rentals at typical pace (median 25d on market — plan ~3-4 weeks tenant-placement turnaround); 920 units permitted in St. Louis County in 2024 (250 in 5+ unit buildings).
Forward outlook
- Local home prices are declining (-3.0%/yr); year-one equity from $273 of loan paydown is wiped out by about $1k of value loss. Plan a longer hold.
- At projected returns (-3.0% appreciation + 4.5% rent growth), your $11k cash investment doubles in ~3 years — after that, you're playing with house money.
Negotiation context
- Only 4 days on market — expect competitive offers; lowballing is unlikely to land.
- Current owner paid $32k; 23% above their basis — modest negotiation headroom, anchor on the comps not their cost.
Risks & watch-outs
- Climate carrying-cost: extreme-heat days projected 7→21/yr by 2055 (HVAC capex compounding) — expect insurance premiums to compound above CPI over the hold.
Questions for the listing agent
- Built in 1966 — when were the roof, HVAC, electrical panel, plumbing, and water heater last replaced?
- What does the HOA fee cover, when was the last increase, and are there any pending special assessments or reserve-fund shortfalls?
- Any open or pending special assessments — roof, HVAC, plumbing, elevator, façade? What's the per-unit balance and payoff schedule, and is the seller paying it off at close or rolling it to the buyer?
- Is there a deadline driving the sale (1031 exchange, divorce, estate, relocation)? That informs how much negotiation room exists.
- Schools are D-rated, which usually means shorter tenancies and higher turnover. Who's the typical renter profile here, and what's been the actual vacancy rate?
- Crime grade is F in this area — have there been break-ins, vandalism, or insurance claims at this property in the last 3 years? What carrier currently insures it and at what premium?
- What's the average days-on-market for RENTAL listings here right now (not sales)? A rising rental-DOM trend means longer vacancies and softer asking-rent achievability than the comps imply.
- What's the recent tenant-quality profile in this submarket — average credit score on applications, eviction rate, late-payment / NSF rate, and stable-employment percentage? A property-management company in the area should have these aggregated.
- How much new apartment / multifamily construction is in the pipeline within 1–3 miles? Heavy new supply (>2% of stock underway) typically softens rents 12–24 months out; light construction supports rent growth.
Investment metrics
- 1% rule
- 2.78% ✓
- Cap rate
- 18.78%
- Cash-on-cash
- 44.58%
- DSCR
- 2.98
- GRM
- 3.0
CMA / ARV
No comps found within radius.
Projected returns pro-forma
-3.0% appreciation · 4.45% rent growth · sell at horizon
- IRR
- 43.8%
- Equity multiple
- 2.95×
- Total profit
- $21,521
- Equity at exit
- $5,890
- IRR
- 50.7%
- Equity multiple
- 6.41×
- Total profit
- $59,822
- Equity at exit
- $3,415
Cash invested: $11,060 (down + closing). Projections, not guarantees.
Landlord ↔ Tenant lean methodology
- Overall (STATE)
- 81 Strongly Landlord-Friendly
- State Missouri
- 81 Strongly Landlord-Friendly · R+10
- County
- — inherits STATE
- City
- — inherits STATE
ZIP-level market 63042
- Rents YoY
- 4.5%
- Active inventory
- 68
- Price-to-rent
- 3.0×
Monthly cashflow live
- Estimated rent
- $1,097 medium interval (Pro) →
- Mortgage (P&I)
- −$207
- Tax from tax record
- −$41 /mo · $492/yr
- Insurance
- −$16
- HOA
- −$191
- Vacancy / Maint / Mgmt
- −$230
- Net cashflow
- $411
Break-even live
Sensitivity live
| Price | -10% $433 | -5% $422 | +0% $411 | +5% $400 | +10% $389 |
|---|---|---|---|---|---|
| Rent | -10% $324 | -5% $368 | +0% $411 | +5% $454 | +10% $498 |
| Rate | -1.0pp $431 | -0.5pp $421 | base $411 | +0.5pp $401 | +1.0pp $390 |
UW: 25.0% down · 7.5% · 30yr · 1.5% tax · 5.0% vac · 8.0% maint · 8.0% mgmt
Financing live
Cash to close
- Down payment
- $9,875
- Closing costs
- $1,185
- Reserves months
- —
- Total cash needed
- —
Loan-product check · same deal, 3 products live
Conventional
25% down · 7.5% · 30yr
- Down + closing
- —
- Monthly P&I
- —
- Monthly cashflow
- —
- DSCR
- —
- Eligible?
- —
Personal DTI + credit; lowest rate.
DSCR
20% down · 8.5% · 30yr
- Down + closing
- —
- Monthly P&I
- —
- Monthly cashflow
- —
- DSCR
- —
- Eligible?
- —
No personal income docs; deal must DSCR.
Hard money
10% down · 12.0% · 12mo
- Down + closing
- —
- Monthly P&I
- —
- Monthly cashflow
- —
- DSCR
- —
- Eligible?
- —
Short-term bridge; refi at stabilization.
Rent comps 4 comps
| Address | Beds | Baths | Sqft | Rent | $/sqft | DOM | Units | Dist |
|---|---|---|---|---|---|---|---|---|
| 651 Southwell Ln Florissant, MO | 2.0 | 1.0 | 694 | $1,100 | $1.59 | 18d | 1 | 0.97mi |
| 241 Flora Dr Saint Louis, MO | 2.0 | 1.0 | 703 | $1,075 | $1.53 | 24d | 1 | 1.04mi |
| 7410 Olian Dr Hazelwood, MO | 1.0 | 1.0 | 540 | $800 | $1.48 | 22d | 1 | 1.04mi |
| 1004 N New Florissant Rd Florissant, MO | 2.0 | 1.0 | 719 | $1,375 | $1.91 | 24d | 1 | 1.49mi |
HOA detail condo
- Monthly dues
- $191 · $2,292/yr
- Likely covers
- waterparking
- Assessments
- None detected in remarks — confirm with the listing agent.
Listing history 20 events
-
2026-06-18remarks 277-char remark
-
2026-06-18days on market $39,500 Active 4 DOM
-
2026-06-17days on market $39,500 Active 3 DOM
-
2026-06-16days on market $39,500 Active 2 DOM
-
2026-06-15statusdays on market $39,500 Active 1 DOM
-
2026-06-13days on market $39,500 Coming Soon 18 DOM
-
2026-06-13days on market $39,500 Coming Soon 17 DOM
-
2026-06-09days on market $39,500 Coming Soon 14 DOM
-
2026-06-08days on market $39,500 Coming Soon 13 DOM
-
2026-06-07days on market $39,500 Coming Soon 12 DOM
-
2026-06-05days on market $39,500 Coming Soon 9 DOM
-
2026-06-03days on market $39,500 Coming Soon 8 DOM
-
2026-06-02days on market $39,500 Coming Soon 7 DOM
-
2026-06-01days on market $39,500 Coming Soon 6 DOM
-
2026-05-31days on market $39,500 Coming Soon 5 DOM
-
2026-05-26historical $39,500
-
2023-06-07soldstatus
-
1996-12-04soldstatus
-
1993-11-05soldstatus $32,000
-
1990-12-04soldstatus $27,000
ⓘ Source: listings_history table (triggers on properties + properties_extension) + one-shot
backfill from property_details.listing_events for pre-trigger history.
Tax reassessment forecast MO · Resets to sale price
- Current annual tax
- $492 · $41/mo
- Projected year-2 tax
- $492 · $41/mo
- Expected delta
- $0/yr ($0/mo · 0.0%)
ⓘ Screening estimate from a state-policy table — verify with the county assessor before closing.
Climate risk First Street
- Flood 1/10 Low FEMA zone X (unshaded) · 0% chance over 30 yrs
- Wildfire 1/10 Low
- Heat 5/10 Major 7 d/yr ≥105°F today · 21 d/yr by 30 yrs out
- Wind 2/10 Low 100% chance of damaging wind over 30 yrs
- Air quality 3/10 Moderate 3 unhealthy d/yr today · 5 by 30 yrs out
Nearby sold comps map
Loading sold comps map…
Walkable amenities ~0.75 mi
Loading nearby amenities…
Taxation est. · year 1
- Rental income
- $13,161
- − Mortgage interest
- −$2,213
- − Property taxes
- −$492
- − Insurance
- −$198
- − Repairs & maintenance
- −$1,053
- − Management
- −$1,053
- − HOA
- −$2,292
- − Depreciation
- −$1,149
- Taxable income
- $4,713
- Est. tax owed @ 24.0%
- −$1,131
- After-tax cash flow
- $3,800/yr
For passive investors: Depreciation is non-cash, so a rental often shows a tax loss while cash-flowing — sheltering income. Rental losses are passive: they offset passive income freely, and up to $25,000/yr can offset ordinary (W-2) income if you actively participate and your MAGI is under $100k (phasing out to $0 by $150k); unused losses carry forward. On sale, claimed depreciation is recaptured at up to 25%, and gains may owe capital-gains tax (a 1031 exchange can defer both). Figures are a year-1 estimate at your 24.0% rate — not tax advice; consult a CPA.
Schools (NCES district)
- District
- Ferguson-Florissant R-II
- NCES district ID
- 2912010
- Math proficiency
- 7% ▼ -9.00%
- Reading proficiency
- 20% ▼ -6.00%
- Median HH income
- $44,610
- Composite
- 11.96/100
- National rank
- #9666
- State rank
- #311 of 324 in MO
Livability — Hazelwood
- Score
- 62/100
- State rank
- #395
- US rank
- #16956
Category grades
Schools grade is shown separately in the Schools card above.
Census & demographics
- Census place
- Hazelwood, MO
- County
- Saint Louis County · 888,823 people
- City population
- 17,813
- Metro
- St. Louis, MO-IL
- Population (ZIP)
- 17,813
- Household income
- $49,453
- Rent vs Own
- Severe rent burden
- 766.0
Population outlook (St. Louis County) Hauer SSP2
- Today (2025)
- 1,025,227 people
- By 2030
- 1,028,023 · +0.3%
- By 2040
- 1,020,940 · -0.4%
- By 2050
- 1,007,280 · -1.8%
- By 2075
- 987,277 · -3.7%
- By 2100
- 921,984 · -10.1%
Race, ethnicity, and origin ACS 2023
- Neighborhood character
- Diverse neighborhood (Simpson 0.64)
- Race & ethnicity
- White 46% Black 38% Two or more races 10% Hispanic / Latino 4% Asian 2%
- Common ancestry
- Lithuanian 3% Romanian 1% Italian 1%
- Foreign-born
- 5% · Canada, Vietnam
- Languages at home
- 94% English-only · Spanish 3% Vietnamese 1% Tagalog/Filipino 1%
Political lean MEDSL · St. Louis
- 2024 margin
- Strong D (+23.4) · D 60.8% · R 37.4% · Other 1.7%
- 2008→2024 swing
- +3.5pp toward D · 2008: 19.9pp · 2024: 23.4pp
- All cycles
- 2024: D+23.4 2020: D+24.0 2016: D+16.2 2012: D+13.7 2008: D+19.9
Not yet ingested
- Civics
- —
Market trends
- HPI YoY
- ▼ -204.48%
- Current HPI
- 234.7353
- Rent YoY
- ▲ 4.45%
- Metro
- St. Louis, MO-IL
- State GDP YoY
- ▲ 1.84%
- F500 in state
- 20
Industry mix (Fortune 500 HQ in MO)
| Industry | F500 HQs | Revenue |
|---|---|---|
| Healthcare | 1 | $163B |
|
||
| Insurance | 1 | $21B |
|
||
| Industrial Technology | 1 | $17B |
|
||
| Retail | 1 | $16B |
|
||
| Industrial Distribution | 1 | $10B |
|
||
| Utilities | 1 | $9B |
|
||
Price history
+46.3% since first listed5 events — show timeline
- 2026-05-26 Coming Soon $39,500 MARIS as Distributed by MLS Grid
- 2023-06-07 Sold (Public Records) — Public Records
- 1996-12-04 Sold (Public Records) — Public Records
- 1993-11-05 Sold (Public Records) $32,000 Public Records
- 1990-12-04 Sold (Public Records) $27,000 Public Records
Property tax history
+3.4%/yrLatest (2022): $492 · +0.6% YoY. Source: county tax records.
Cash-flow waterfall
monthlySold comps — $/sqft
last 12 mo · ≤1 miLoading sold comps…