424 Seymour St · Valdosta, GA
Flood risk 1/10 · Minimal
- FEMA flood zone
- X (unshaded)
- Chance of flooding over 30 yrs
- 0.0%
- Est. flood insurance / yr
- $507 – $1,088
Fire risk 1/10 · Minimal
- Est. fire insurance / yr
- $963 – $1,789
Heat risk 7/10 · Major
- Hot days now (above 108°F)
- 7 days/yr
- Hot days in 30 yrs
- 18 days/yr
Wind risk 8/10 · Major
- Chance of severe wind over 30 yrs
- 99.0%
Air-quality risk 6/10 · Moderate
- Unhealthy air days now
- 10 days/yr
- Unhealthy air days in 30 yrs
- 11 days/yr
Risk factors via First Street. Map © Google.
Why this score? — see what drove the D grade
The composite is a weighted blend of 9 inputs, each scored 0–100. Each bar is that input's sub-score; the figure is the points it added to the 100-point composite (weight × sub-score).
- Cash flow +15.0/30.0
- ARV discount +7.5/15.0
- 1% rule +5.0/10.0
- DSCR +5.0/10.0
- Rent growth +4.6/5.0
- Livability +3.0/5.0
- Condition / age +2.5/5.0
- Schools +1.5/10.0
- Appreciation +0.0/10.0
$25,000
🖨 Deal sheet 📄 Offer letter ✓ Due diligence
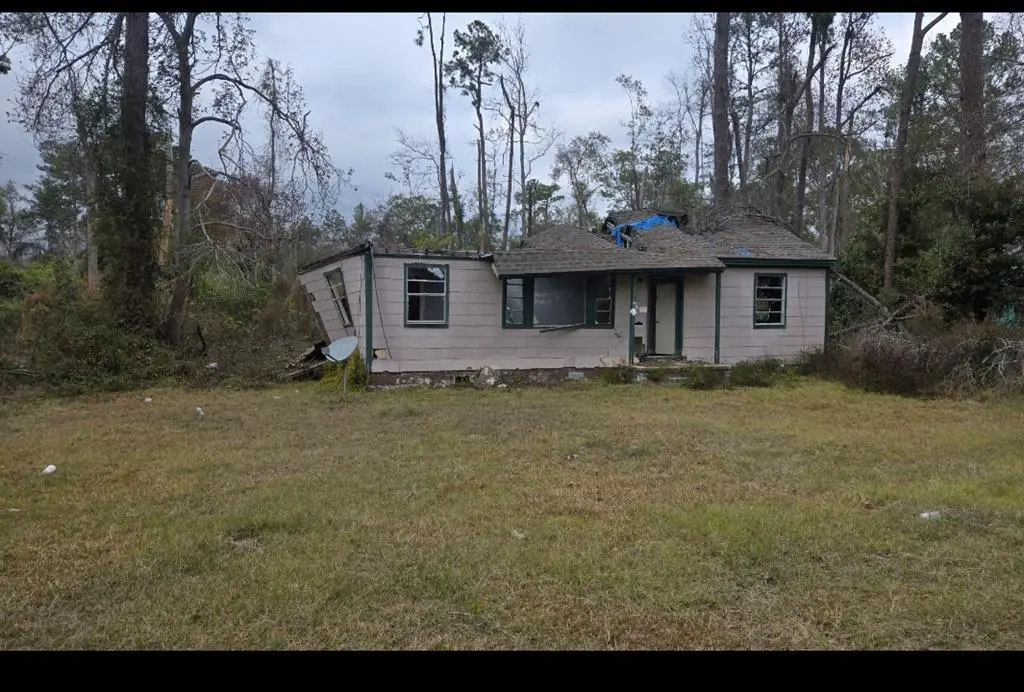
Listing remarks MLS
Property has major storm damage multiple trees fell on the home. Being sold as is price based on current condition a major renovation is needed,
Key facts
- 0.31 acre lot
- Built 1950
- Listed 149 days
Neighborhood map
What this means for you Summary
Snapshot
- This is a 2-bed/1.0-bath single-family listed at $25k.
Deal economics
- At list price, monthly cash flow is $703 ($8k/yr) — positive.
- The deal already cash-flows at list — no discount required.
- Meets the 1% rule at list price ($1k rent vs $25k).
- Recommended offer: $22k (12.0% below list) — sets the bar for market timing.
- Cap rate 40.0% vs local median 4.3% in Valdosta — top-decile yield for the area; either an underpriced asset or a hidden risk that comps aren't pricing in. Stress-test before assuming the spread holds.
Location & tenants
- Location reads 60/100 on livability (#392 in GA) — a middle-class / working-renter tenant base. Strengths: cost of living A+, health & safety A+, housing A-; Watch: schools F, crime F, amenities F.
- Valdosta City (urban): math 15% / reading 22% proficiency, ranked #149 of 174 in GA (top 86%) — low school quality limits family demand, transient renter base, plan for 1-2y turnover; 74% free/reduced lunch — lower-income household profile, screen leases tightly.
- Market conditions: Rents rising fast (+8.3%/yr); 198 active listings in the ZIP; 40 comparable units currently listed for rent nearby; rentals lingering (median 44d on market — plan ~5-8 weeks vacancy on turnover, expect pricing pressure); 60% of comp listings sitting > 30 days — soft ceiling on asking rent; lower-income renter base — watch delinquency; 896 units permitted in Lowndes County in 2024 (0 in 5+ unit buildings).
- This rent runs 36% of the median local income ($36k/yr) — at the standard rent-burdened threshold; future hikes will face affordability resistance.
Forward outlook
- Local home prices are declining (-3.0%/yr); year-one equity from $173 of loan paydown is wiped out by about $750 of value loss. Plan a longer hold.
- Lowndes County population projected at +10% by 2050 — modest demand growth; plan on rents tracking national, not racing it.
- At projected returns (-3.0% appreciation + 8.0% rent growth), your $7k cash investment doubles in ~1 year — after that, you're playing with house money.
Negotiation context
- It's been on market 149 days — a 12% lower offer ($22k) is reasonable based on typical stale-listing flexibility.
Risks & watch-outs
- Watch-outs: built in 1950 — expect roof / HVAC / electrical / plumbing capex.
- Climate carrying-cost: severe wind risk, 99% chance of damaging wind over 30y; extreme-heat days projected 7→18/yr by 2055 (HVAC capex compounding) — expect insurance premiums to compound above CPI over the hold.
Questions for the listing agent
- It's been on market 149 days. Have you received any prior offers? Is the seller open to a 12% concession, seller financing, or rate buy-down credit?
- Built in 1950 — when were the roof, HVAC, electrical panel, plumbing, and water heater last replaced?
- Why hasn't it sold? Are there any deal-killer items the seller is aware of (foundation, flood, title, zoning, code violations)?
- Is there a deadline driving the sale (1031 exchange, divorce, estate, relocation)? That informs how much negotiation room exists.
- Schools are F-rated, which usually means shorter tenancies and higher turnover. Who's the typical renter profile here, and what's been the actual vacancy rate?
- Crime grade is F in this area — have there been break-ins, vandalism, or insurance claims at this property in the last 3 years? What carrier currently insures it and at what premium?
- The area grade is low — what's the realistic commute time and amenity access for the typical tenant pool here? Any planned neighborhood developments (good or bad) we should know about?
- What's the average days-on-market for RENTAL listings here right now (not sales)? A rising rental-DOM trend means longer vacancies and softer asking-rent achievability than the comps imply.
- What's the recent tenant-quality profile in this submarket — average credit score on applications, eviction rate, late-payment / NSF rate, and stable-employment percentage? A property-management company in the area should have these aggregated.
- How much new for-sale + rental construction is in the pipeline within 1–3 miles? Heavy new supply typically softens prices + rents 12–24 months out; constrained supply supports both.
Investment metrics
- 1% rule
- 4.33% ✓
- Cap rate
- 40.05%
- Cash-on-cash
- 120.55%
- DSCR
- 6.36
- GRM
- 1.9
CMA / ARV
- ARV (median comp)
- $111,223
- List price
- $25,000
- Delta
- -77.52%
- Verdict
- UNDERPRICED
- Comps
- 20 within 1.0 mi
Show comp detail 12 sales within ~0.75 mi
| Address | Dist | Beds/Ba | Sqft | Sold | Price | $/sf | Match |
|---|---|---|---|---|---|---|---|
| 416 Moody Dr | 0.24mi | 3/1.0 (+1) | 1,025 (0%) | 4mo | $65,450 | $64 | 80 |
| 2406 Oxford Dr | 0.19mi | 3/1.0 (+1) | 1,000 (-2%) | 3mo | $92,750 | $93 | 79 |
| 203 Blue Pool Dr | 0.55mi | 3/2.0 (+1) | 1,123 (+10%) | 1mo | $145,000 | $129 | 49 |
| 725 Pineview Dr | 0.53mi | 2/1.5 | 1,089 (+6%) | 23mo | $105,000 | $96 | 44 |
| 237 Blue Pool Dr | 0.52mi | 3/2.0 (+1) | 1,126 (+10%) | 12mo | $143,000 | $127 | 40 |
| 806 Wilson Ave | 0.71mi | 2/1.0 | 960 (-6%) | 20mo | $106,000 | $110 | 39 |
| 339 Brookfield Rd | 0.55mi | 2/2.5 | 1,139 (+11%) | 13mo | $99,900 | $88 | 39 |
| 2507 Churchill Dr | 0.72mi | 2/1.0 | 1,125 (+10%) | 18mo | $121,500 | $108 | 36 |
| 263 Blue Pool Dr | 0.52mi | 3/2.0 (+1) | 1,150 (+12%) | 20mo | $160,000 | $139 | 30 |
| 3013 Kensington Ln | 0.65mi | 3/2.0 (+1) | 1,177 (+15%) | 8mo | $144,000 | $122 | 30 |
| 2930 Callaway Cir | 0.51mi | 3/2.0 (+1) | 1,175 (+15%) | 16mo | $140,000 | $119 | 29 |
| 257 Blue Pool Dr | 0.52mi | 3/2.0 (+1) | 1,178 (+15%) | 19mo | $147,200 | $125 | 26 |
Match score weights: distance 35% · size 25% · config 20% · recency 20%. Top-matched comps best support the ARV.
Projected returns pro-forma
-3.0% appreciation · 8.0% rent growth · sell at horizon
- IRR
- —
- Equity multiple
- 7.64×
- Total profit
- $46,454
- Equity at exit
- $3,728
- IRR
- —
- Equity multiple
- 18.74×
- Total profit
- $124,148
- Equity at exit
- $2,162
Cash invested: $7,000 (down + closing). Projections, not guarantees.
Landlord ↔ Tenant lean methodology
- Overall (STATE)
- 90 Strongly Landlord-Friendly
- State Georgia
- 90 Strongly Landlord-Friendly · R+3
- County
- — inherits STATE
- City
- — inherits STATE
ZIP-level market 31601
- Home prices YoY
- -31.2%
- Rents YoY
- 8.3%
- Active inventory
- 198
- Price-to-rent
- 1.9×
Monthly cashflow live
- Estimated rent
- $1,082 high interval (Pro) →
- Mortgage (P&I)
- −$131
- Tax from tax record
- −$10 /mo · $116/yr
- Insurance
- −$10
- HOA
- −$0
- Vacancy / Maint / Mgmt
- −$227
- Net cashflow
- $703
Break-even live
UW: 25.0% down · 7.5% · 30yr · 1.5% tax · 5.0% vac · 8.0% maint · 8.0% mgmt
Financing live
Cash to close
- Down payment
- $6,250
- Closing costs
- $750
- Reserves months
- —
- Total cash needed
- —
Loan-product check · same deal, 3 products live
Conventional
25% down · 7.5% · 30yr
- Down + closing
- —
- Monthly P&I
- —
- Monthly cashflow
- —
- DSCR
- —
- Eligible?
- —
Personal DTI + credit; lowest rate.
DSCR
20% down · 8.5% · 30yr
- Down + closing
- —
- Monthly P&I
- —
- Monthly cashflow
- —
- DSCR
- —
- Eligible?
- —
No personal income docs; deal must DSCR.
Hard money
10% down · 12.0% · 12mo
- Down + closing
- —
- Monthly P&I
- —
- Monthly cashflow
- —
- DSCR
- —
- Eligible?
- —
Short-term bridge; refi at stabilization.
Rent comps 40 comps
| Address | Beds | Baths | Sqft | Rent | $/sqft | DOM | Units | Dist |
|---|---|---|---|---|---|---|---|---|
| 2437 University Dr Valdosta, GA | 3.0 | 1.0 | 879 | $1,175 | $1.34 | 43d | 1 | 0.15mi |
| 411 Northside Dr Unit G5 Valdosta, GA | 2.0 | 1.5 | 950 | $795 | $0.84 | 43d | 1 | 0.16mi |
| 411 Northside Dr Valdosta, GA | 2.0 | 2.0 | 950 | $795 | $0.84 | 43d | 1 | 0.16mi |
| 2305 Bemiss Rd Unit T16 Valdosta, GA | 2.0 | 1.5 | 896 | $850 | $0.95 | 43d | 1 | 0.24mi |
| 611 Pineview Dr Valdosta, GA | 1.0–3.0 | 1.0–2.5 | 1204 | $1,300 | $1.08 | 21d | 3 | 0.34mi |
| 420 Connell Rd Valdosta, GA | 1.0–3.0 | 1.0–2.0 | 1051 | $1,195 | $1.14 | 21d | 8 | 0.37mi |
| 422 Connell Rd Valdosta, GA | 2.0 | 3.0 | 1125 | $1,050 | $0.93 | 21d | 1 | 0.41mi |
| 422 Connell Rd Valdosta, GA | 1.0 | 1.0 | 890 | $1,120 | $1.26 | 43d | 1 | 0.41mi |
| 439 Heritage Pl Valdosta, GA | 2.0 | 1.0 | 983 | $1,025 | $1.04 | 21d | 1 | 0.47mi |
| 100 Garden Dr Valdosta, GA | 1.0–3.0 | 1.0–3.0 | 885 | $1,702 | $1.92 | 21d | 13 | 0.48mi |
| 522 Heritage Pl Valdosta, GA | 2.0 | 1.0 | 979 | $1,050 | $1.07 | 43d | 1 | 0.51mi |
| 2205 Bemiss Rd Valdosta, GA | 2.0 | 1.0 | 880 | $1,095 | $1.24 | 43d | 3 | 0.55mi |
| 141 Blue Pool Dr Valdosta, GA | 3.0 | 2.0 | 1109 | $1,200 | $1.08 | 21d | 1 | 0.55mi |
| 334 Sawgrass Dr Valdosta, GA | 3.0 | 2.0 | 1150 | $1,595 | $1.39 | 21d | 1 | 0.58mi |
| 5 Kensington Cir Valdosta, GA | 3.0 | 2.0 | 1150 | $1,495 | $1.30 | 21d | 1 | 0.61mi |
| 360 Brookfield Rd Valdosta, GA | 3.0 | 2.5 | 1278 | $1,100 | $0.86 | 43d | 1 | 0.62mi |
| 3024 Will Dr Valdosta, GA | 3.0 | 2.0 | 1200 | $1,295 | $1.08 | 43d | 1 | 0.66mi |
| 2808 Walmar Pl Valdosta, GA | 2.0 | 1.0 | 825 | $1,000 | $1.21 | 43d | 1 | 0.70mi |
| 3027 Schroer Dr Valdosta, GA | 3.0 | 2.0 | 1184 | $1,295 | $1.09 | 43d | 1 | 0.71mi |
| 6 Meadow Run Cir Unit F Valdosta, GA | 2.0 | 1.0 | 920 | $895 | $0.97 | 43d | 1 | 0.74mi |
| 3 Meadow Run Cir Unit F Valdosta, GA | 2.0 | 1.0 | 920 | $895 | $0.97 | 43d | 1 | 0.74mi |
| 413 Georgetown Cir Valdosta, GA | 2.0 | 2.0 | 1178 | $1,400 | $1.19 | 43d | 1 | 0.77mi |
| 713 Lakeland Ave Valdosta, GA | 2.0 | 1.0 | 1047 | $895 | $0.85 | 43d | 1 | 0.79mi |
| 1005 Langdale Dr Unit B Valdosta, GA | 2.0 | 1.0 | 879 | $700 | $0.80 | 21d | 1 | 0.80mi |
| 2324 Sterling Pl Valdosta, GA | 3.0 | 1.0 | 1124 | $1,095 | $0.97 | 21d | 1 | 0.84mi |
| 2600 Deborah Dr Valdosta, GA | 3.0 | 1.0 | 1333 | $1,495 | $1.12 | 43d | 1 | 0.85mi |
| 720 E Park Ave Unit 6 Valdosta, GA | 2.0 | 1.0 | 850 | $650 | $0.76 | 21d | 1 | 0.85mi |
| 2878 Fawnwood Cir Valdosta, GA | 3.0 | 2.0 | 1400 | $3,000 | $2.14 | 43d | 1 | 0.86mi |
| 2859 Fawnwood Cir Valdosta, GA | 2.0 | 2.0 | 1173 | $1,400 | $1.19 | 21d | 1 | 0.87mi |
| 304 E Cranford Ave Valdosta, GA | 2.0 | 1.0 | 980 | $850 | $0.87 | 43d | 1 | 0.91mi |
| 1109 Timber Line Dr Valdosta, GA | 3.0 | 2.0 | 1436 | $1,300 | $0.91 | 43d | 1 | 0.94mi |
| 1716 Charlton St Valdosta, GA | 2.0 | 1.0 | 833 | $825 | $0.99 | 43d | 1 | 1.05mi |
| 200 W Cranford Ave Valdosta, GA | 2.0 | 2.0 | 950 | $1,225 | $1.29 | 21d | 3 | 1.06mi |
| 3000 Ginny Dr Valdosta, GA | 3.0 | 2.0 | 1174 | $1,200 | $1.02 | 43d | 1 | 1.09mi |
| 1425 E Park Ave Valdosta, GA | 1.0–2.0 | 1.0–2.0 | 917 | $1,095 | $1.19 | 21d | 2 | 1.16mi |
| 1701 N Troup St Valdosta, GA | 2.0 | 1.0 | 756 | $750 | $0.99 | 21d | 1 | 1.17mi |
| 1704 N Patterson St Unit 4 Valdosta, GA | 2.0 | 2.0 | 1100 | $950 | $0.86 | 43d | 1 | 1.18mi |
| 207 E Moore St Unit J Valdosta, GA | 1.0 | 1.0 | 850 | $700 | $0.82 | 43d | 1 | 1.19mi |
| 207 E Moore St Unit L Valdosta, GA | 1.0 | 1.0 | 850 | $700 | $0.82 | 21d | 1 | 1.19mi |
| 1632 Lexington Cir Valdosta, GA | 3.0 | 2.0 | 1104 | $1,395 | $1.26 | 43d | 1 | 1.21mi |
Listing history 10 events
-
2026-06-05days on market $25,000 Active 149 DOM
-
2026-06-03days on market $25,000 Active 148 DOM
-
2026-06-02days on market $25,000 Active 147 DOM
-
2026-06-01days on market $25,000 Active 146 DOM
-
2026-05-31days on market $25,000 Active 145 DOM
-
2026-05-30days on market $25,000 Active 144 DOM
-
2026-01-06$25,000 Active 144-char remark
Show marketing remark (144 chars)
Property has major storm damage multiple trees fell on the home. Being sold as is price based on current condition a major renovation is needed,
-
1992-04-08soldstatus $24,000
-
1981-07-01soldstatus $9,300
-
1979-09-01soldstatus $23,300
ⓘ Source: listings_history table (triggers on properties + properties_extension) + one-shot
backfill from property_details.listing_events for pre-trigger history.
Tax reassessment forecast GA · Resets to sale price
- Current annual tax
- $116 · $10/mo
- Projected year-2 tax
- $230 · $19/mo
- Expected delta
- +$114/yr (+$9/mo · 97.6%)
ⓘ Screening estimate from a state-policy table — verify with the county assessor before closing.
Climate risk First Street
- Flood 1/10 Low FEMA zone X (unshaded) · 0% chance over 30 yrs
- Wildfire 1/10 Low
- Heat 7/10 Severe 7 d/yr ≥108°F today · 18 d/yr by 30 yrs out
- Wind 8/10 Severe 99% chance of damaging wind over 30 yrs
- Air quality 6/10 Major 10 unhealthy d/yr today · 11 by 30 yrs out
Nearby sold comps map
Loading sold comps map…
Walkable amenities ~0.75 mi
Loading nearby amenities…
Taxation est. · year 1
- Rental income
- $12,978
- − Mortgage interest
- −$1,400
- − Property taxes
- −$116
- − Insurance
- −$125
- − Repairs & maintenance
- −$1,038
- − Management
- −$1,038
- − Depreciation
- −$727
- Taxable income
- $8,533
- Est. tax owed @ 24.0%
- −$2,048
- After-tax cash flow
- $6,390/yr
For passive investors: Depreciation is non-cash, so a rental often shows a tax loss while cash-flowing — sheltering income. Rental losses are passive: they offset passive income freely, and up to $25,000/yr can offset ordinary (W-2) income if you actively participate and your MAGI is under $100k (phasing out to $0 by $150k); unused losses carry forward. On sale, claimed depreciation is recaptured at up to 25%, and gains may owe capital-gains tax (a 1031 exchange can defer both). Figures are a year-1 estimate at your 24.0% rate — not tax advice; consult a CPA.
Schools (NCES district)
- District
- Valdosta City
- NCES district ID
- 1305310
- Math proficiency
- 15% ▼ -12.00%
- Reading proficiency
- 22% ▼ -7.00%
- Median HH income
- $30,634
- Composite
- 14.79/100
- National rank
- #9388
- State rank
- #149 of 174 in GA
Livability — Valdosta
- Score
- 60/100
- State rank
- #392
- US rank
- #19544
Category grades
Schools grade is shown separately in the Schools card above.
Census & demographics
- Census place
- Valdosta, GA
- County
- Lowndes County · 107,801 people
- City population
- 91,859
- Metro
- Valdosta, GA
- Population (ZIP)
- 31,302
- Household income
- $36,111
- Rent vs Own
- Severe rent burden
- 2016.0
Population outlook (Lowndes County) Hauer SSP2
- Today (2025)
- 120,348 people
- By 2030
- 123,469 · +2.6%
- By 2040
- 128,482 · +6.8%
- By 2050
- 131,907 · +9.6%
- By 2075
- 139,080 · +15.6%
- By 2100
- 133,649 · +11.1%
Race, ethnicity, and origin ACS 2023
- Neighborhood character
- Diverse neighborhood (Simpson 0.57)
- Race & ethnicity
- Black 57% White 31% Hispanic / Latino 8% Two or more races 4% Asian 1%
- Hispanic origin (detail)
- Mexican 4%
- Common ancestry
- Slovak 1% Italian 1%
- Foreign-born
- 4% · Canada, South Korea
- Languages at home
- 92% English-only · Spanish 7% Korean 1%
Political lean MEDSL · Lowndes
- 2024 margin
- R (+18.0) · D 40.8% · R 58.8%
- 2008→2024 swing
- -8.6pp toward R · 2008: -9.4pp · 2024: -18.0pp
- All cycles
- 2024: R+18.0 2020: R+12.0 2016: R+18.2 2012: R+10.5 2008: R+9.4
Not yet ingested
- Civics
- —
Market trends
- HPI YoY
- ▼ -55.12%
- Current HPI
- 121.5948
- Rent YoY
- ▲ 8.34%
- Metro
- Valdosta, GA
- State GDP YoY
- ▲ 2.66%
- F500 in state
- 28
Industry mix (Fortune 500 HQ in GA)
| Industry | F500 HQs | Revenue |
|---|---|---|
| Paper / Packaging | 2 | $29B |
|
||
| Retail | 1 | $160B |
|
||
| Transportation / Logistics | 1 | $91B |
|
||
| Airlines | 1 | $62B |
|
||
| Consumer Goods | 1 | $47B |
|
||
| Utilities | 1 | $25B |
|
||
Price history
+7.3% since first listed4 events — show timeline
- 2026-01-06 Listed $25,000 TBOR
- 1992-04-08 Sold (Public Records) $24,000 Public Records
- 1981-07-01 Sold (Public Records) $9,300 Public Records
- 1979-09-01 Sold (Public Records) $23,300 Public Records
Property tax history
-6.5%/yrLatest (2025): $116 · +4.3% YoY. Source: county tax records.
Cash-flow waterfall
monthlySold comps — $/sqft
last 12 mo · ≤1 miLoading sold comps…