 Multi-family
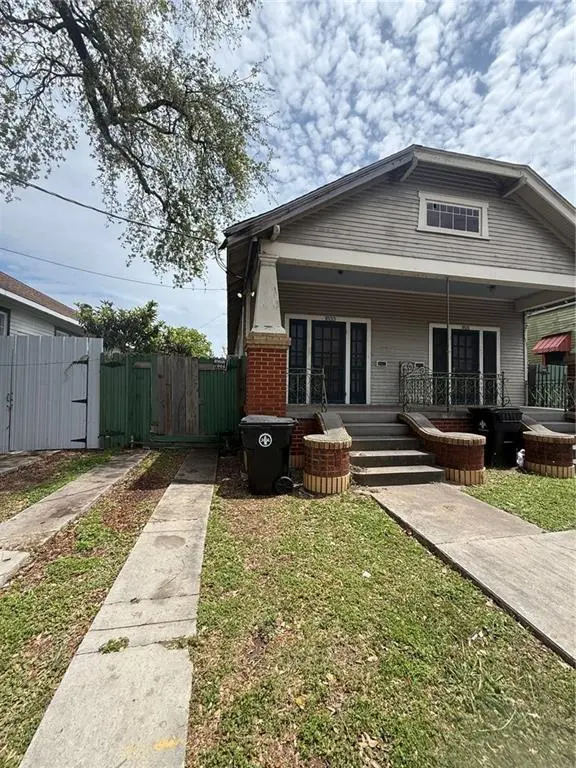
1831 33 Elysian Fields Ave · New Orleans, LA
Flood risk No data
- FEMA flood zone
- —
- Chance of flooding over 30 yrs
- —
- Est. flood insurance / yr
- —
Fire risk No data
- Est. fire insurance / yr
- —
Heat risk No data
- Hot days now (above threshold)
- —
- Hot days in 30 yrs
- —
Wind risk No data
- Chance of severe wind over 30 yrs
- —
Air-quality risk No data
- Unhealthy air days now
- —
- Unhealthy air days in 30 yrs
- —
Risk factors via First Street. Map © Google.
Why this score? — see what drove the C+ grade
The composite is a weighted blend of 9 inputs, each scored 0–100. Each bar is that input's sub-score; the figure is the points it added to the 100-point composite (weight × sub-score).
- Cash flow +28.7/30.0
- DSCR +10.0/10.0
- 1% rule +8.0/10.0
- Livability +4.0/5.0
- ARV discount +3.5/15.0
- Rent growth +3.1/5.0
- Condition / age +2.2/5.0
- Schools +1.6/10.0
- Appreciation +0.0/10.0
$215,000
🖨 Deal sheet 📄 Offer letter ✓ Due diligence
Multi-family units
County records classify this as Multi-Family (2-4 Unit). Listing-text estimate: 1 unit. estimate disagrees with records
Listing remarks
Classic New Orleans shotgun double situated on an oversized 36 x 188 lot, offering incredible potential and flexibility. Each side features 2 bedrooms and 1 full bath, making this property ideal for investors or owner-occupants looking to offset their mortgage. Both units enjoy off-street parking with driveways that run the full length of the home - offering the opportunity to add gates for secure, private parking. The 1833 side showcases beuatiful sold hardwood floors throughout, along with timeless New Orleans architectural details, including decorative stained wood trim around doors. Built-in solid wood butler's pantries add both charm and functionality to each unit. The 1831 side al
Key facts
- Foundation piers
- Oversized lot
- Off-street parking
Tags
Property features AI
Finance
- Financial info: Two-unit property
Exterior
- Parking: Driveway; Off-street parking; Three or more parking spaces; Boat access/parking; RV access/parking
- Utilities: Public water; Public sewer
- Home design: Single-story building; Raised foundation
- Construction: HardiPlank and wood siding exterior; Shingle roof; Built with a raised foundation
- Exterior features: City lot; Irregular lot shape; Oversized lot; Lot dimensions approximately 36 x 188
Interior
- Bedrooms: Two 2-bedroom units (unit 1831 and unit 1833)
- Bathrooms: Each unit has one full bathroom (2 full bathrooms total)
- Heating & cooling: Window unit heating; Window unit cooling
- Interior features: Average condition
Neighborhood map
What this means for you Summary
Snapshot
- This is a 4-bed/2.0-bath multifamily listed at $215k. Condition is rated fair.
Deal economics
- At list price, monthly cash flow is $716 ($9k/yr) — positive.
- The deal already cash-flows at list — no discount required.
- Meets the 1% rule at list price ($3k rent vs $215k).
- Recommended offer: $209k (3.0% below list) — sets the bar for market timing.
- Cap rate 10.3% vs local median 4.4% in New Orleans — top-decile yield for the area; either an underpriced asset or a hidden risk that comps aren't pricing in. Stress-test before assuming the spread holds.
Location & tenants
- Location reads 81/100 on livability (#3 in LA, #1,383 nationally) — a professional / high-income tenant draw. Strengths: amenities A+, commute A+, health & safety A+; Watch: crime C-, employment D.
- Orleans Parish (urban): math 11% / reading 27% proficiency, ranked #69 of 98 in LA (top 70%) — low school quality limits family demand, transient renter base, plan for 1-2y turnover; 68% free/reduced lunch — lower-income household profile, screen leases tightly.
- Market conditions: Rents rising (+2.5%/yr); 581 active listings in the ZIP; 40 comparable units currently listed for rent nearby; rentals at typical pace (median 24d on market — plan ~3-4 weeks tenant-placement turnaround); 710 units permitted in Orleans Parish in 2024 (244 in 5+ unit buildings).
- At $2,787/mo this rent would consume 73% of the median local household income ($46k/yr) (locally 1988% of renters already pay >50% of income on rent) — very limited rent-growth headroom before tenants either downsize or default.
Forward outlook
- Local home prices are declining (-3.0%/yr); year-one equity from $1k of loan paydown is wiped out by about $6k of value loss. Plan a longer hold.
- Orleans County population projected at +61% by 2050 — long-run rental-demand tailwind backs the buy-and-hold thesis.
- At projected returns (-3.0% appreciation + 2.5% rent growth), your $60k cash investment doubles in ~9 years — after that, you're playing with house money.
Negotiation context
- It's been on market 48 days — a 3% lower offer ($209k) is reasonable based on typical stale-listing flexibility.
- 2 sale attempts with the ask held roughly flat each time — persistent listings suggest the price (not the market) is what's stuck; bring a comps-based counter.
Risks & watch-outs
- Watch-outs: built in 1950 — expect roof / HVAC / electrical / plumbing capex.
Questions for the listing agent
- It's been on market 48 days. Have you received any prior offers? Is the seller open to a 3% concession, seller financing, or rate buy-down credit?
- Have any recent inspections been done? Can we get a copy of the seller's disclosures and any deferred-maintenance estimates?
- Built in 1950 — when were the roof, HVAC, electrical panel, plumbing, and water heater last replaced?
- Is there a deadline driving the sale (1031 exchange, divorce, estate, relocation)? That informs how much negotiation room exists.
- What's the average days-on-market for RENTAL listings here right now (not sales)? A rising rental-DOM trend means longer vacancies and softer asking-rent achievability than the comps imply.
- What's the recent tenant-quality profile in this submarket — average credit score on applications, eviction rate, late-payment / NSF rate, and stable-employment percentage? A property-management company in the area should have these aggregated.
- How much new apartment / multifamily construction is in the pipeline within 1–3 miles? Heavy new supply (>2% of stock underway) typically softens rents 12–24 months out; light construction supports rent growth.
Investment metrics
- 1% rule
- 1.30% ✓
- Cap rate
- 10.29%
- Cash-on-cash
- 14.27%
- DSCR
- 1.63
- GRM
- 6.4
CMA / ARV
- ARV (median comp)
- $197,626
- List price
- $215,000
- Delta
- 8.79%
- Verdict
- FAIR
- Comps
- 20 within 1.0 mi
Show comp detail 12 sales within ~0.75 mi
| Address | Dist | Beds/Ba | Sqft | Sold | Price | $/sf | Match |
|---|---|---|---|---|---|---|---|
| 2211 13 Mandeville St | 0.17mi | 4/2.0 | 1,644 (+0%) | 2mo | $195,000 | $119 | 89 |
| 2132 Touro St | 0.15mi | 4/2.0 | 1,550 (-5%) | 6mo | $169,000 | $109 | 79 |
| 1727 29 Marigny St | 0.32mi | 4/2.0 | 1,716 (+5%) | 1mo | $285,000 | $166 | 77 |
| 1834 36 Marigny St | 0.23mi | 4/2.0 | 1,508 (-8%) | 2mo | $215,000 | $143 | 74 |
| 2105 07 Arts St | 0.45mi | 4/3.0 | 1,598 (-2%) | 3mo | $265,000 | $166 | 69 |
| 2467/2469 N Tonti St | 0.36mi | 4/2.0 | 1,475 (-10%) | 2mo | $175,000 | $119 | 65 |
| 2714 16 New Orleans St | 0.67mi | 4/2.0 | 1,623 (-1%) | 4mo | $230,000 | $142 | 64 |
| 2134 Annette St | 0.36mi | 4/4.0 | 1,816 (+11%) | 3mo | $210,000 | $116 | 55 |
| 1552 54 N Derbigny St | 0.73mi | 4/3.0 | 1,681 (+3%) | 5mo | $330,000 | $196 | 54 |
| 2118 20 Onzaga St | 0.75mi | 4/2.0 | 1,526 (-7%) | 1mo | $182,000 | $119 | 53 |
| 1345 Saint Anthony St | 0.68mi | 5/2.5 (+1) | 1,776 (+8%) | 7mo | $60,000 | $34 | 42 |
| 1923-25 Pauger St | 0.69mi | 4/2.0 | 1,879 (+15%) | 4mo | $70,000 | $37 | 40 |
Match score weights: distance 35% · size 25% · config 20% · recency 20%. Top-matched comps best support the ARV.
Projected returns pro-forma
-3.0% appreciation · 2.49% rent growth · sell at horizon
- IRR
- 4.1%
- Equity multiple
- 1.16×
- Total profit
- $9,377
- Equity at exit
- $32,057
- IRR
- 13.1%
- Equity multiple
- 2.02×
- Total profit
- $61,270
- Equity at exit
- $18,589
Cash invested: $60,200 (down + closing). Projections, not guarantees.
Landlord ↔ Tenant lean methodology
- Overall (STATE)
- 90 Strongly Landlord-Friendly
- State Louisiana
- 90 Strongly Landlord-Friendly · R+12
- County
- — inherits STATE
- City
- — inherits STATE
ZIP-level market 70117
- Rents YoY
- 2.5%
- Active inventory
- 581
- Price-to-rent
- 12.9×
Monthly cashflow live
- Estimated rent
- $2,787 high interval (Pro) →
- Mortgage (P&I)
- −$1,127
- Tax est. 1.5%
- −$269 /mo · $3,225/yr
- Insurance
- −$90
- HOA
- −$0
- Vacancy / Maint / Mgmt
- −$585
- Net cashflow
- $716
Break-even live
2-unit breakdown (identical units grouped — click to expand)
| Units | Beds | Baths | Est. rent |
|---|---|---|---|
| 2× units | 2 | 1 | $2,786 |
| #1 | 2 | 1 | $1,393 |
| #2 | 2 | 1 | $1,393 |
| Total (2 units) | $2,787 | ||
UW: 25.0% down · 7.5% · 30yr · 1.5% tax · 5.0% vac · 8.0% maint · 8.0% mgmt
Financing live
Cash to close
- Down payment
- $53,750
- Closing costs
- $6,450
- Reserves months
- —
- Total cash needed
- —
Loan-product check · same deal, 3 products live
Conventional
25% down · 7.5% · 30yr
- Down + closing
- —
- Monthly P&I
- —
- Monthly cashflow
- —
- DSCR
- —
- Eligible?
- —
Personal DTI + credit; lowest rate.
DSCR
20% down · 8.5% · 30yr
- Down + closing
- —
- Monthly P&I
- —
- Monthly cashflow
- —
- DSCR
- —
- Eligible?
- —
No personal income docs; deal must DSCR.
Hard money
10% down · 12.0% · 12mo
- Down + closing
- —
- Monthly P&I
- —
- Monthly cashflow
- —
- DSCR
- —
- Eligible?
- —
Short-term bridge; refi at stabilization.
Rent comps 40 comps
| Address | Beds | Baths | Sqft | Rent | $/sqft | DOM | Units | Dist |
|---|---|---|---|---|---|---|---|---|
| 2115 Elysian Fields Ave Unit 2115 New Orleans, LA | 3.0 | 1.0 | 1100 | $1,450 | $1.32 | 23d | 1 | 0.07mi |
| 2107 Elysian Fields Ave New Orleans, LA | 4.0 | 2.0 | 1794 | $1,650 | $0.92 | 3d | 1 | 0.09mi |
| 2115 Mandeville St New Orleans, LA | 3.0 | 2.0 | 1400 | $1,650 | $1.18 | 23d | 1 | 0.19mi |
| 2920 Pauger St New Orleans, LA | 4.0 | 2.0 | 1882 | $1,995 | $1.06 | 23d | 1 | 0.22mi |
| 2220 N Prieur St New Orleans, LA | 3.0 | 2.0 | 1334 | $2,000 | $1.50 | 23d | 1 | 0.25mi |
| 1837 Touro St New Orleans, LA | 3.0 | 1.0 | 1994 | $2,000 | $1.00 | 23d | 1 | 0.27mi |
| 3228 Pauger St New Orleans, LA | 5.0 | 2.0 | 1600 | $2,100 | $1.31 | 23d | 1 | 0.31mi |
| 1938 N Johnson St Unit 38 New Orleans, LA | 3.0 | 2.0 | 1844 | $2,400 | $1.30 | 23d | 1 | 0.33mi |
| 1936 N Johnson St Unit 36 New Orleans, LA | 3.0 | 2.0 | 1844 | $2,400 | $1.30 | 23d | 1 | 0.33mi |
| 1710 Marigny St New Orleans, LA | 3.0 | 2.0 | 1120 | $1,750 | $1.56 | 23d | 1 | 0.36mi |
| 2338 Annette St Unit 1 New Orleans, LA | 3.0 | 1.0 | 1150 | $1,400 | $1.22 | 20d | 1 | 0.37mi |
| 2556 N Tonti St New Orleans, LA | 3.0 | 2.0 | 1100 | $1,850 | $1.68 | 16d | 1 | 0.46mi |
| 2515 N Galvez St New Orleans, LA | 4.0 | 2.0 | 1200 | $1,200 | $1.00 | 10d | 1 | 0.47mi |
| 2515 N Galvez St Unit 2515 New Orleans, LA | 4.0 | 2.0 | 1200 | $1,900 | $1.58 | 23d | 1 | 0.47mi |
| 2522 N Galvez St New Orleans, LA | 3.0 | 2.0 | 1105 | $1,675 | $1.52 | 23d | 1 | 0.49mi |
| 2524 N Galvez St New Orleans, LA | 3.0 | 2.5 | 1102 | $1,800 | $1.63 | 17d | 1 | 0.49mi |
| 1831 N Miro St New Orleans, LA | 3.0 | 2.0 | 1882 | $2,500 | $1.33 | 43d | 1 | 0.50mi |
| 1923 N Robertson St New Orleans, LA | 3.0 | 2.0 | 1051 | $1,950 | $1.86 | 3d | 1 | 0.53mi |
| 2817 Annette St New Orleans, LA | 3.0 | 1.0 | 1100 | $1,350 | $1.23 | 23d | 1 | 0.55mi |
| 2152 Abundance St Unit 2152 New Orleans, LA | 3.0 | 2.0 | 1100 | $1,599 | $1.45 | 3d | 1 | 0.60mi |
| 1933 Industry St New Orleans, LA | 3.0 | 2.0 | 1400 | $1,595 | $1.14 | 16d | 1 | 0.60mi |
| 2338 40 Annette St New Orleans, LA | 3.0 | 1.0 | 1150 | $1,385 | $1.20 | 20d | 1 | 0.66mi |
| 2310 George Nick Connor Dr New Orleans, LA | 3.0 | 2.0 | 1050 | $1,600 | $1.52 | 23d | 1 | 0.71mi |
| 1735 N Tonti St New Orleans, LA | 3.0 | 1.0 | 1197 | $1,650 | $1.38 | 23d | 1 | 0.72mi |
| 1472 N Claiborne Ave New Orleans, LA | 3.0 | 1.0 | 1312 | $1,900 | $1.45 | 16d | 1 | 0.84mi |
| 3327 Elysian Fields Ave New Orleans, LA | 3.0 | 1.0 | 1200 | $1,300 | $1.08 | 23d | 1 | 0.86mi |
| 2317 N Rampart St Unit 1272378P New Orleans, LA | 3.0–6.0 | 2.0–4.0 | 1581 | $4,154 | $2.63 | 3d | 2 | 0.87mi |
| 1245 Kerlerec St New Orleans, LA | 3.0 | 2.0 | 1500 | $2,500 | $1.67 | 43d | 1 | 0.91mi |
| 1247 Kerlerec St New Orleans, LA | 3.0 | 2.0 | 1500 | $2,500 | $1.67 | 43d | 1 | 0.91mi |
| 1217 Kerlerec St Unit B New Orleans, LA | 3.0 | 1.0 | 1300 | $2,100 | $1.62 | 3d | 1 | 0.92mi |
| 1818 Paul Morphy St Unit B New Orleans, LA | 3.0 | 2.0 | 1065 | $1,800 | $1.69 | 23d | 1 | 0.93mi |
| 2329 Laharpe St New Orleans, LA | 3.0 | 1.0 | 1250 | $1,000 | $0.80 | 20d | 1 | 0.93mi |
| 3021 Republic St New Orleans, LA | 4.0 | 2.0 | 1125 | $2,200 | $1.96 | 23d | 1 | 0.95mi |
| 2322 Burgundy St Unit C New Orleans, LA | 3.0 | 2.0 | 1250 | $2,200 | $1.76 | 23d | 1 | 0.95mi |
| 2114 Feliciana St Unit A New Orleans, LA | 3.0 | 2.0 | 1134 | $1,500 | $1.32 | 16d | 1 | 0.96mi |
| 2114 Feliciana St Unit A New Orleans, LA | 3.0 | 2.0 | 1134 | $1,500 | $1.32 | 23d | 1 | 0.96mi |
| 2910 Bruxelles St New Orleans, LA | 3.0 | 2.0 | 1074 | $1,600 | $1.49 | 3d | 1 | 0.97mi |
| 2331 Columbus St New Orleans, LA | 3.0 | 1.0 | 1976 | $1,850 | $0.94 | 23d | 1 | 0.99mi |
| 3540 Clermont Dr New Orleans, LA | 3.0 | 2.0 | 1248 | $1,975 | $1.58 | 23d | 1 | 1.01mi |
| 928 Kerlerec St New Orleans, LA | 3.0 | 3.5 | 1684 | $2,750 | $1.63 | 3d | 1 | 1.01mi |
Listing history 13 events
-
2026-06-16statusdays on market $215,000 Pending 48 DOM
-
2026-06-15days on market $215,000 Active 47 DOM
-
2026-06-13days on market $215,000 Active 45 DOM
-
2026-06-10days on market $215,000 Active 42 DOM
-
2026-06-09days on market $215,000 Active 41 DOM
-
2026-06-08days on market $215,000 Active 40 DOM
-
2026-06-07days on market $215,000 Active 39 DOM
-
2026-06-05days on market $215,000 Active 36 DOM
-
2026-06-03days on market $215,000 Active 35 DOM
-
2026-06-02days on market $215,000 Active 34 DOM
-
2026-06-01days on market $215,000 Active 33 DOM
-
2026-05-31days on market $215,000 Active 32 DOM
-
2026-04-29$215,000 Active 1343-char remark
ⓘ Source: listings_history table (triggers on properties + properties_extension) + one-shot
backfill from property_details.listing_events for pre-trigger history.
Nearby sold comps map
Loading sold comps map…
Walkable amenities ~0.75 mi
Loading nearby amenities…
Taxation est. · year 1
- Rental income
- $33,444
- − Mortgage interest
- −$12,043
- − Property taxes
- −$3,225
- − Insurance
- −$1,075
- − Repairs & maintenance
- −$2,676
- − Management
- −$2,676
- − Depreciation
- −$6,255
- Taxable income
- $5,495
- Est. tax owed @ 24.0%
- −$1,319
- After-tax cash flow
- $7,272/yr
For passive investors: Depreciation is non-cash, so a rental often shows a tax loss while cash-flowing — sheltering income. Rental losses are passive: they offset passive income freely, and up to $25,000/yr can offset ordinary (W-2) income if you actively participate and your MAGI is under $100k (phasing out to $0 by $150k); unused losses carry forward. On sale, claimed depreciation is recaptured at up to 25%, and gains may owe capital-gains tax (a 1031 exchange can defer both). Figures are a year-1 estimate at your 24.0% rate — not tax advice; consult a CPA.
Condition & rehab AI · 12 photos
This property requires moderate rehabilitation, focusing on exterior repairs, HVAC updates, and landscaping to improve its resale and rental value.
Repairs flagged
- Major siding — Significant damage and wear
- Major HVAC/mechanicals — No visible units
Value-add opportunities
- Both Landscaping and yard maintenance — Improves curb appeal and property value
- Both HVAC and mechanical updates — Enhances comfort and energy efficiency
- Both Exterior painting and repairs — Enhances curb appeal and property value
Renovation cost estimate screening
| Repair item | Severity | Est. cost |
|---|---|---|
| siding · Significant damage and wear | Major | $15,000–50,000 |
| HVAC/mechanicals · No visible units | Major | $15,000–50,000 |
| Total estimated repair cost · 2 items | $30,000–100,000 |
Value-add ROI direction
- Both Landscaping and yard maintenance — Improves curb appeal and property value ↑
- Both HVAC and mechanical updates — Enhances comfort and energy efficiency ↑
- Both Exterior painting and repairs — Enhances curb appeal and property value ↑
ⓘ Cost ranges are severity-bucket heuristics (US national rule-of-thumb). Get contractor quotes + a written scope before underwriting a rehab budget.
Schools (NCES district)
- District
- Orleans Parish
- NCES district ID
- 2201170
- Math proficiency
- 11% ▼ -52.00%
- Reading proficiency
- 27% ▼ -46.00%
- Median HH income
- $37,011
- Composite
- 15.78/100
- National rank
- #9271
- State rank
- #69 of 98 in LA
Livability — New Orleans
- Score
- 81/100
- State rank
- #3
- US rank
- #1383
Category grades
Schools grade is shown separately in the Schools card above.
Census & demographics
- Census place
- New Orleans, LA
- County
- Orleans Parish · 338,817 people
- City population
- 338,817
- Metro
- New Orleans-Metairie, LA
- Population (ZIP)
- 25,652
- Household income
- $45,764
- Rent vs Own
- Severe rent burden
- 1988.0
Population outlook (Orleans County) Hauer SSP2
- Today (2025)
- 513,025 people
- By 2030
- 575,781 · +12.2%
- By 2040
- 700,174 · +36.5%
- By 2050
- 826,541 · +61.1%
- By 2075
- 1,123,374 · +119.0%
- By 2100
- 1,355,609 · +164.2%
Race, ethnicity, and origin ACS 2023
- Neighborhood character
- Majority Black (60%)
- Race & ethnicity
- Black 60% White 30% Two or more races 6% Hispanic / Latino 5%
- Common ancestry
- Lithuanian 5% Italian 1% Romanian 1%
- Foreign-born
- 5% · Canada, South Korea
- Languages at home
- 93% English-only · Spanish 3% Other Indo-European 1% French/Haitian/Cajun 1%
Political lean MEDSL · Orleans
- 2024 margin
- Solid D (+67.0) · D 82.2% · R 15.2% · Other 2.7%
- 2008→2024 swing
- +6.7pp toward D · 2008: 60.3pp · 2024: 67.0pp
- All cycles
- 2024: D+67.0 2020: D+68.2 2016: D+66.2 2012: D+62.5 2008: D+60.3
Not yet ingested
- Civics
- —
Market trends
- HPI YoY
- ▼ -177.22%
- Current HPI
- 184.6061
- Rent YoY
- ▲ 2.49%
- Metro
- New Orleans-Metairie, LA
- State GDP YoY
- ▲ 3.29%
- F500 in state
- 10
Industry mix (Fortune 500 HQ in LA)
| Industry | F500 HQs | Revenue |
|---|---|---|
| Telecommunications | 2 | $23B |
|
||
| Utilities | 1 | $12B |
|
||
| Wholesale / Distribution | 1 | $5B |
|
||
| Advertising | 1 | $2B |
|
||
Price history
4 events — show timeline
- 2026-06-16 Pending — GSREIN
- 2026-05-29 Relisted — GSREIN
- 2026-05-19 Contingent — GSREIN
- 2026-04-29 Listed $215,000 GSREIN
Cash-flow waterfall
monthlySold comps — $/sqft
last 12 mo · ≤1 miLoading sold comps…