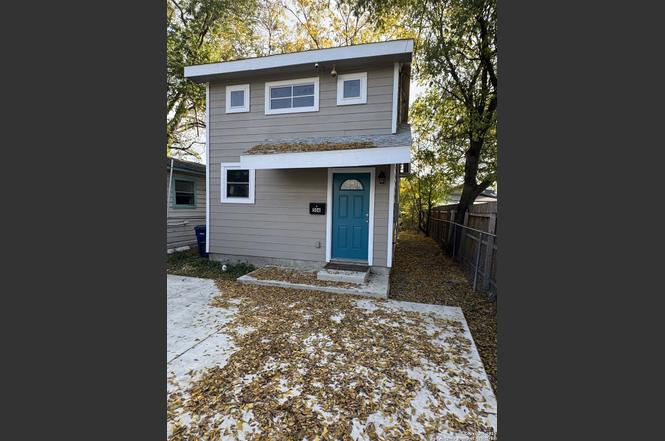
506 Elvira St · San Antonio, TX
Flood risk 1/10 · Minimal
- FEMA flood zone
- X (unshaded)
- Chance of flooding over 30 yrs
- 0.0%
- Est. flood insurance / yr
- $507 – $1,088
Fire risk 1/10 · Minimal
- Est. fire insurance / yr
- $1,222 – $2,270
Heat risk 8/10 · Major
- Hot days now (above 109°F)
- 7 days/yr
- Hot days in 30 yrs
- 21 days/yr
Wind risk 8/10 · Major
- Chance of severe wind over 30 yrs
- 80.0%
Air-quality risk 2/10 · Minimal
- Unhealthy air days now
- 1 days/yr
- Unhealthy air days in 30 yrs
- 2 days/yr
Risk factors via First Street. Map © Google.
Why this score? — see what drove the C grade
The composite is a weighted blend of 9 inputs, each scored 0–100. Each bar is that input's sub-score; the figure is the points it added to the 100-point composite (weight × sub-score).
- Cash flow +13.6/30.0
- ARV discount +12.2/15.0
- Appreciation +10.0/10.0
- 1% rule +5.7/10.0
- Rent growth +4.4/5.0
- DSCR +4.1/10.0
- Livability +4.0/5.0
- Condition / age +2.5/5.0
- Schools +1.4/10.0
$98,900
🖨 Deal sheet (PDF) 📄 Offer letter ✓ Due diligence
Listing remarks
Beautifully Updated Home - Priced at Only $100,000 This recently updated home offers exceptional value with a modern open floor plan and the reliability of a slab foundation. With a potential monthly payment likely lower than typical rent, it presents an excellent opportunity for both first-time buyers and investors. The main floor features an inviting living area that flows seamlessly into the updated kitchen with a comfortable dining space, as well as a convenient half bath. Upstairs, the air-conditioned primary bedroom is separated by double doors from a large adjoining sitting room that can easily serve as a nursery, office, guest space, or even a spacious walk-in closet. Additional hi
Key facts
- Slab foundation
- Open floor plan
- Convenient half bath
Tags
Property features AI
Finance
- Financial info: Down payment resources available
- HOA & community: Subdivision: COMMERCE S. TO GUADALUPE SA
Exterior
- Utilities: Water and sewer service provided; Electricity supplied by CPS; Water and sewer supplied by SAWS; Garbage service by COSA
- Home design: Pre-owned property; Approximate age: 9 years
- Construction: Slab foundation; Composition roof; Built by Marex Solutions
- Exterior features: Siding exterior; City garbage service
Interior
- Kitchen: Cooktop (smooth); Microwave; Refrigerator; Dishwasher; Garbage disposal
- Bedrooms: Master bedroom with sitting room on the upper level (14 x 9); Additional master bedroom on 2nd level (11 x 11)
- Flooring: Ceramic tile; Laminate
- Bathrooms: One full bathroom with tub/shower combination and single vanity (master bath 8 x 5); One half bathroom
- Heating & cooling: Electric heating (1 unit); Other air conditioning (see remarks)
- Interior features: Open floor plan; Eat-in kitchen; One living area; All window coverings remain; All bedrooms on upper level
- Laundry & utility: Electric water heater
Neighborhood map
What this means for you Summary
Snapshot
- This is a 1-bed/1.5-bath single-family listed at $99k.
Deal economics
- At list price, monthly cash flow is $5 ($57/yr) — positive.
- The deal already cash-flows at list — no discount required.
- Meets the 1% rule at list price ($1k rent vs $99k).
- Recommended offer: $87k (12.0% below list) — sets the bar for market timing.
- Cap rate 6.4% vs local median 3.8% in San Antonio — top-decile yield for the area; either an underpriced asset or a hidden risk that comps aren't pricing in. Stress-test before assuming the spread holds.
Location & tenants
- Location reads 80/100 on livability (#31 in TX, #1,616 nationally) — a professional / high-income tenant draw. Strengths: amenities A+, commute A+, cost of living A+; Watch: crime F.
- San Antonio ISD (urban): math 12% / reading 22% proficiency, ranked #805 of 826 in TX (top 98%) — low school quality limits family demand, transient renter base, plan for 1-2y turnover; 80% free/reduced lunch — lower-income household profile, screen leases tightly.
- Zoned schools: De Zavala El (math 17% / reading 19%, grade F, #3,785 of 4,322 statewide, top 88%, 418 students, 98% FRL); Tafolla Middle (math 6% / reading 16%, grade F, #1,634 of 1,662 statewide, top 99%, 697 students, 97% FRL); Lanier H S (math 9% / reading 15%, grade F, #1,554 of 1,632 statewide, top 95%, 1,547 students, 97% FRL) — zoned schools average 97% FRL vs 80% district-wide (17 pts higher); higher-poverty schools than district average — tighter screening recommended.
- Market conditions: Rents rising fast (+7.7%/yr); 164 active listings in the ZIP; 37 comparable units currently listed for rent nearby; rentals at typical pace (median 18d on market — plan ~3-4 weeks tenant-placement turnaround); lower-income renter base — watch delinquency; 8,308 units permitted in Bexar County in 2024 (2,506 in 5+ unit buildings).
Forward outlook
- In year one you build about $11k of equity ($684 loan paydown + $10k appreciation (10.0% local appreciation)).
- Bexar County population projected at +50% by 2050 — long-run rental-demand tailwind backs the buy-and-hold thesis.
- At projected returns (10.0% appreciation + 7.7% rent growth), your $28k cash investment doubles in ~3 years — after that, you're playing with house money.
- By year 4, paydown + projected appreciation supports a ~$37k cash-out refi (75% LTV) — recoverable capital for the next deal without selling this one.
Negotiation context
- It's been on market 178 days — a 12% lower offer ($87k) is reasonable based on typical stale-listing flexibility.
- 2 sale attempts with the ask held roughly flat each time — persistent listings suggest the price (not the market) is what's stuck; bring a comps-based counter.
Risks & watch-outs
- Watch-outs: property tax is 3.3% of price.
- Climate carrying-cost: severe wind risk, 80% chance of damaging wind over 30y; extreme-heat days projected 7→21/yr by 2055 (HVAC capex compounding) — expect insurance premiums to compound above CPI over the hold.
Questions for the listing agent
- It's been on market 178 days. Have you received any prior offers? Is the seller open to a 12% concession, seller financing, or rate buy-down credit?
- Property tax is high relative to price — has the assessment been appealed recently, and will the sale trigger a re-assessment?
- Why hasn't it sold? Are there any deal-killer items the seller is aware of (foundation, flood, title, zoning, code violations)?
- Is there a deadline driving the sale (1031 exchange, divorce, estate, relocation)? That informs how much negotiation room exists.
- Crime grade is F in this area — have there been break-ins, vandalism, or insurance claims at this property in the last 3 years? What carrier currently insures it and at what premium?
- What's the average days-on-market for RENTAL listings here right now (not sales)? A rising rental-DOM trend means longer vacancies and softer asking-rent achievability than the comps imply.
- What's the recent tenant-quality profile in this submarket — average credit score on applications, eviction rate, late-payment / NSF rate, and stable-employment percentage? A property-management company in the area should have these aggregated.
- How much new for-sale + rental construction is in the pipeline within 1–3 miles? Heavy new supply typically softens prices + rents 12–24 months out; constrained supply supports both.
Investment metrics
- 1% rule
- 1.07% ✓
- Cap rate
- 6.35%
- Cash-on-cash
- 0.21%
- DSCR
- 1.01
- GRM
- 7.8
CMA / ARV
- ARV (on-the-fly)
- $110,396
- Comps found
- 12
Show comp detail 12 sales within ~0.75 mi
| Address | Dist | Beds/Ba | Sqft | Sold | Price | $/sf | Match |
|---|---|---|---|---|---|---|---|
| 506 Elvira St | 0.00mi | 1/1.5 | 772 (0%) | 1mo | $98,900 | $128 | 99 |
| 1815 Vera Cruz | 0.18mi | 2/1.0 (+1) | 768 (-0%) | 17mo | $109,900 | $143 | 70 |
| 1804 San Fernando St | 0.13mi | 2/1.0 (+1) | 718 (-7%) | 18mo | $120,000 | $167 | 60 |
| 602 Chihuahua St | 0.63mi | 2/1.0 (+1) | 783 (+1%) | 3mo | $125,000 | $160 | 59 |
| 605 Torreon | 0.17mi | 2/1.0 (+1) | 668 (-14%) | 10mo | $34,999 | $52 | 55 |
| 1922 San Luis St | 0.19mi | 2/1.0 (+1) | 660 (-14%) | 17mo | $150,000 | $227 | 46 |
| 924 Montezuma | 0.19mi | 2/1.0 (+1) | 870 (+13%) | 23mo | $120,000 | $138 | 44 |
| 2106 W Cesar E Chavez Blvd | 0.26mi | 2/1.0 (+1) | 870 (+13%) | 23mo | $110,000 | $126 | 40 |
| 1710 Montezuma St | 0.70mi | 2/2.0 (+1) | 732 (-5%) | 21mo | $159,000 | $217 | 34 |
| 1528 Santiago St | 0.50mi | 2/1.0 (+1) | 675 (-13%) | 19mo | $100,000 | $148 | 33 |
| 2926 El Paso | 0.72mi | 2/1.0 (+1) | 672 (-13%) | 6mo | $39,999 | $60 | 32 |
| 2721 Colima | 0.73mi | 2/1.0 (+1) | 672 (-13%) | 14mo | $75,000 | $112 | 26 |
Match score weights: distance 35% · size 25% · config 20% · recency 20%. Top-matched comps best support the ARV.
Projected returns pro-forma
10.0% appreciation · 7.73% rent growth · sell at horizon
- IRR
- 26.5%
- Equity multiple
- 3.15×
- Total profit
- $59,577
- Equity at exit
- $89,097
- IRR
- 24.8%
- Equity multiple
- 7.80×
- Total profit
- $188,416
- Equity at exit
- $192,141
Cash invested: $27,692 (down + closing). Projections, not guarantees.
Landlord ↔ Tenant lean methodology
- Overall (STATE)
- 87 Strongly Landlord-Friendly
- State Texas
- 87 Strongly Landlord-Friendly · R+5
- County
- — inherits STATE
- City
- — inherits STATE
ZIP-level market 78207
- Home prices YoY
- 15.2%
- Rents YoY
- 7.7%
- Active inventory
- 164
- Price-to-rent
- 7.8×
Monthly cashflow live
- Estimated rent
- $1,063 high interval (Pro) →
- Mortgage (P&I)
- −$519
- Tax from tax record
- −$275 /mo · $3,302/yr
- Insurance
- −$41
- HOA
- −$0
- Vacancy / Maint / Mgmt
- −$223
- Net cashflow
- $5
Break-even live
Sensitivity live
| Price | -10% $61 | -5% $33 | +0% $5 | +5% $-23 | +10% $-51 |
|---|---|---|---|---|---|
| Rent | -10% $-79 | -5% $-37 | +0% $5 | +5% $47 | +10% $89 |
| Rate | -1.0pp $55 | -0.5pp $30 | base $5 | +0.5pp $-21 | +1.0pp $-47 |
UW: 25.0% down · 7.5% · 30yr · 1.5% tax · 5.0% vac · 8.0% maint · 8.0% mgmt
Financing live
Cash to close
- Down payment
- $24,725
- Closing costs
- $2,967
- Reserves months
- —
- Total cash needed
- —
Loan-product check · same deal, 3 products live
Conventional
25% down · 7.5% · 30yr
- Down + closing
- —
- Monthly P&I
- —
- Monthly cashflow
- —
- DSCR
- —
- Eligible?
- —
Personal DTI + credit; lowest rate.
DSCR
20% down · 8.5% · 30yr
- Down + closing
- —
- Monthly P&I
- —
- Monthly cashflow
- —
- DSCR
- —
- Eligible?
- —
No personal income docs; deal must DSCR.
Hard money
10% down · 12.0% · 12mo
- Down + closing
- —
- Monthly P&I
- —
- Monthly cashflow
- —
- DSCR
- —
- Eligible?
- —
Short-term bridge; refi at stabilization.
Rent comps 37 comps
| Address | Beds | Baths | Sqft | Rent | $/sqft | DOM | Units | Dist |
|---|---|---|---|---|---|---|---|---|
| 1209 El Paso St San Antonio, TX | 2.0 | 1.0 | 966 | $975 | $1.01 | 25d | 1 | 0.51mi |
| 1102 El Paso St San Antonio, TX | 1.0–3.0 | 1.0–2.0 | 888 | $795 | $0.90 | 5d | 1 | 0.59mi |
| 602 Chihuahua St San Antonio, TX | 2.0 | 1.0 | 783 | $1,150 | $1.47 | 45d | 1 | 0.64mi |
| 2721 Colima St San Antonio, TX | 2.0 | 1.0 | 700 | $1,250 | $1.79 | 16d | 1 | 0.70mi |
| 2812 Vera Cruz San Antonio, TX | 1.0 | 2.0 | 1060 | $1,200 | $1.13 | 6d | 1 | 0.76mi |
| 107 Beso Ln Unit 107-BL San Antonio, TX | 1.0 | 1.0 | 528 | $850 | $1.61 | 25d | 1 | 0.85mi |
| 218 Tampico St San Antonio, TX | 2.0 | 1.0–2.0 | 808 | $1,214 | $1.50 | 0d | 29 | 0.94mi |
| 234 Gould St Unit 102 San Antonio, TX | 2.0 | 1.5 | 948 | $1,195 | $1.26 | 6d | 1 | 0.97mi |
| 939 S Frio St Unit 294 San Antonio, TX | 1.0 | 1.0 | 664 | $979 | $1.47 | 0d | 1 | 0.98mi |
| 939 S Frio St Unit 2294 San Antonio, TX | 2.0 | 2.0 | 931 | $1,459 | $1.57 | 0d | 1 | 0.98mi |
| 939 S Frio St Unit 1294 San Antonio, TX | 1.0 | 1.0 | 630 | $969 | $1.54 | 0d | 1 | 0.98mi |
| 1011 S Frio St San Antonio, TX | 3.0 | 1.0–3.0 | 1121 | $1,445 | $1.29 | 0d | 31 | 0.99mi |
| 1938 S Zarzamora St Unit 610 San Antonio, TX | 1.0 | 1.0 | 744 | $907 | $1.22 | 0d | 1 | 1.02mi |
| 1938 S Zarzamora St Unit 710 San Antonio, TX | 2.0 | 2.0 | 955 | $1,094 | $1.15 | 0d | 1 | 1.02mi |
| 711 S Frio St San Antonio, TX | 2.0 | 1.0–2.0 | 885 | $1,183 | $1.34 | 19d | 2 | 1.03mi |
| 711 S Frio St Unit 2101 San Antonio, TX | 2.0 | 2.0 | 980 | $1,400 | $1.43 | 4d | 1 | 1.03mi |
| 711 S Frio St San Antonio, TX | 2.0 | 1.0–2.0 | 885 | $1,183 | $1.34 | 4d | 2 | 1.03mi |
| 2003 S Zarzamora St San Antonio, TX | 1.0–4.0 | 1.0–2.0 | 1028 | $982 | $0.96 | 25d | 1 | 1.06mi |
| 1901 S San Marcos Unit 610 San Antonio, TX | 1.0 | 1.0 | 750 | $954 | $1.27 | 0d | 1 | 1.10mi |
| 1901 S San Marcos Unit 710 San Antonio, TX | 2.0 | 2.0 | 985 | $1,139 | $1.16 | 0d | 1 | 1.10mi |
| 703 N San Marcos San Antonio, TX | 1.0 | 1.0 | 700 | $716 | $1.02 | 45d | 1 | 1.26mi |
| 1545 Ruiz St San Antonio, TX | 2.0 | 2.0 | 1020 | $935 | $0.92 | 45d | 1 | 1.28mi |
| 310 Finton Unit A San Antonio, TX | 1.0 | 1.0 | 960 | $850 | $0.89 | 45d | 1 | 1.30mi |
| 711 N Frio St Unit 2303 San Antonio, TX | 2.0 | 1.0 | 790 | $966 | $1.22 | 19d | 1 | 1.34mi |
| 711 N Frio St Unit 1302 San Antonio, TX | 2.0 | 2.0 | 980 | $1,400 | $1.43 | 19d | 1 | 1.34mi |
| 711 N Frio St Unit 1203 San Antonio, TX | 2.0 | 1.0 | 790 | $966 | $1.22 | 12d | 1 | 1.34mi |
| 711 N Frio St Unit 2204 San Antonio, TX | 2.0 | 1.0 | 790 | $966 | $1.22 | 4d | 1 | 1.34mi |
| 816 Rivas St Unit A San Antonio, TX | 2.0 | 1.0 | 650 | $799 | $1.23 | 25d | 1 | 1.37mi |
| 1401 S Flores St #300 San Antonio, TX | 1.0 | 1.0 | 728 | $1,750 | $2.40 | 18d | 1 | 1.38mi |
| 831 S Flores St San Antonio, TX | 1.0 | 1.0 | 760 | $850 | $1.12 | 25d | 1 | 1.39mi |
| 831 S Flores St San Antonio, TX | 1.0 | 1.0 | 796 | $1,305 | $1.64 | 45d | 1 | 1.39mi |
| 222 Glass Ave San Antonio, TX | 2.0 | 2.0 | 1007 | $2,400 | $2.38 | 45d | 1 | 1.43mi |
| 1033 Rivas St #301 San Antonio, TX | 2.0 | 1.0 | 640 | $925 | $1.45 | 45d | 1 | 1.46mi |
| 1033 Rivas St #301 San Antonio, TX | 2.0 | 1.0 | 640 | $895 | $1.40 | 11d | 1 | 1.46mi |
| 910 N Frio St San Antonio, TX | 1.0 | 1.0 | 700 | $1,043 | $1.49 | 45d | 1 | 1.48mi |
| 205 Mockert San Antonio, TX | 2.0 | 1.0 | 864 | $1,050 | $1.22 | 25d | 1 | 1.48mi |
| 205 W Lambert St San Antonio, TX | 2.0 | 1.0 | 550 | $995 | $1.81 | 19d | 1 | 1.49mi |
Listing history 7 events
-
2026-05-17status Pending
-
2026-04-30historical Active Option
-
2026-04-02price $98,900
-
2026-02-20price $99,500
-
2026-01-13status Back on Market
-
2026-01-02historical Active Option
-
2025-11-20$99,999 New
ⓘ Source: listings_history table (triggers on properties + properties_extension) + one-shot
backfill from property_details.listing_events for pre-trigger history.
Tax reassessment forecast TX · Resets to sale price
- Current annual tax
- $3,302 · $275/mo
- Projected year-2 tax
- $3,302 · $275/mo
- Expected delta
- $0/yr ($0/mo · -0.0%)
ⓘ Screening estimate from a state-policy table — verify with the county assessor before closing.
Climate risk First Street
- Flood 1/10 Low FEMA zone X (unshaded) · 0% chance over 30 yrs
- Wildfire 1/10 Low
- Heat 8/10 Severe 7 d/yr ≥109°F today · 21 d/yr by 30 yrs out
- Wind 8/10 Severe 80% chance of damaging wind over 30 yrs
- Air quality 2/10 Low 1 unhealthy d/yr today · 2 by 30 yrs out
Nearby sold comps map
Loading sold comps map…
Walkable amenities ~0.75 mi
Loading nearby amenities…
Taxation est. · year 1
- Rental income
- $12,756
- − Mortgage interest
- −$5,540
- − Property taxes
- −$3,302
- − Insurance
- −$494
- − Repairs & maintenance
- −$1,021
- − Management
- −$1,021
- − Depreciation
- −$2,877
- Taxable loss
- −$1,498
- Est. tax savings @ 24.0%
- +$360
- After-tax cash flow
- $417/yr
For passive investors: Depreciation is non-cash, so a rental often shows a tax loss while cash-flowing — sheltering income. Rental losses are passive: they offset passive income freely, and up to $25,000/yr can offset ordinary (W-2) income if you actively participate and your MAGI is under $100k (phasing out to $0 by $150k); unused losses carry forward. On sale, claimed depreciation is recaptured at up to 25%, and gains may owe capital-gains tax (a 1031 exchange can defer both). Figures are a year-1 estimate at your 24.0% rate — not tax advice; consult a CPA.
Schools (NCES district)
- District
- San Antonio ISD
- NCES district ID
- 4838730
- Math proficiency
- 12% ▼ -21.00%
- Reading proficiency
- 22% ▼ -7.00%
- Median HH income
- $30,952
- Composite
- 13.57/100
- National rank
- #9512
- State rank
- #805 of 826 in TX
Livability — San Antonio
- Score
- 80/100
- State rank
- #31
- US rank
- #1616
Category grades
Schools grade is shown separately in the Schools card above.
Census & demographics
- Census place
- San Antonio, TX
- County
- Bexar County · 1,990,555 people
- City population
- 1,806,925
- Metro
- San Antonio-New Braunfels, TX
- Population (ZIP)
- 55,474
- Household income
- $32,472
- Rent vs Own
- Severe rent burden
- 2789.0
Population outlook (Bexar County) Hauer SSP2
- Today (2025)
- 2,336,851 people
- By 2030
- 2,560,728 · +9.6%
- By 2040
- 3,020,569 · +29.3%
- By 2050
- 3,493,522 · +49.5%
- By 2075
- 4,668,459 · +99.8%
- By 2100
- 5,533,242 · +136.8%
Race, ethnicity, and origin ACS 2023
- Neighborhood character
- Predominantly Hispanic (88%)
- Race & ethnicity
- Hispanic / Latino 88% Two or more races 41% White 6% Black 5% Native American 2%
- Hispanic origin (detail)
- Mexican 79%
- Foreign-born
- 19% · Canada
- Languages at home
- 39% English-only · Spanish 60%
Political lean MEDSL · Bexar
- 2024 margin
- Lean D (+9.8) · D 54.3% · R 44.6% · Other 1.1%
- 2008→2024 swing
- +4.2pp toward D · 2008: 5.6pp · 2024: 9.8pp
- All cycles
- 2024: D+9.8 2020: D+18.2 2016: D+13.5 2012: D+4.6 2008: D+5.6
Not yet ingested
- Civics
- —
Market trends
- HPI YoY
- ▲ 34.92%
- Current HPI
- 264.7559
- Rent YoY
- ▲ 7.73%
- Metro
- San Antonio-New Braunfels, TX
- State GDP YoY
- ▲ 3.95%
- F500 in state
- 110
Industry mix (Fortune 500 HQ in TX)
| Industry | F500 HQs | Revenue |
|---|---|---|
| Energy | 16 | $1,198B |
|
||
| Technology | 5 | $198B |
|
||
| Engineering / Construction | 4 | $72B |
|
||
| Energy Services | 3 | $60B |
|
||
| Utilities | 3 | $41B |
|
||
| Healthcare | 2 | $330B |
|
||
Price history
-1.1% since first listed7 events — show timeline
- 2026-05-17 Pending — LERA
- 2026-04-30 Contingent — LERA
- 2026-04-02 Price Changed $98,900 LERA
- 2026-02-20 Price Changed $99,500 LERA
- 2026-01-13 Relisted — LERA
- 2026-01-02 Contingent — LERA
- 2025-11-20 Listed $99,999 LERA
Property tax history
+24.1%/yrLatest (2025): $3,302 · -5.5% YoY. Source: county tax records.
Cash-flow waterfall
monthlySold comps — $/sqft
last 12 mo · ≤1 miLoading sold comps…