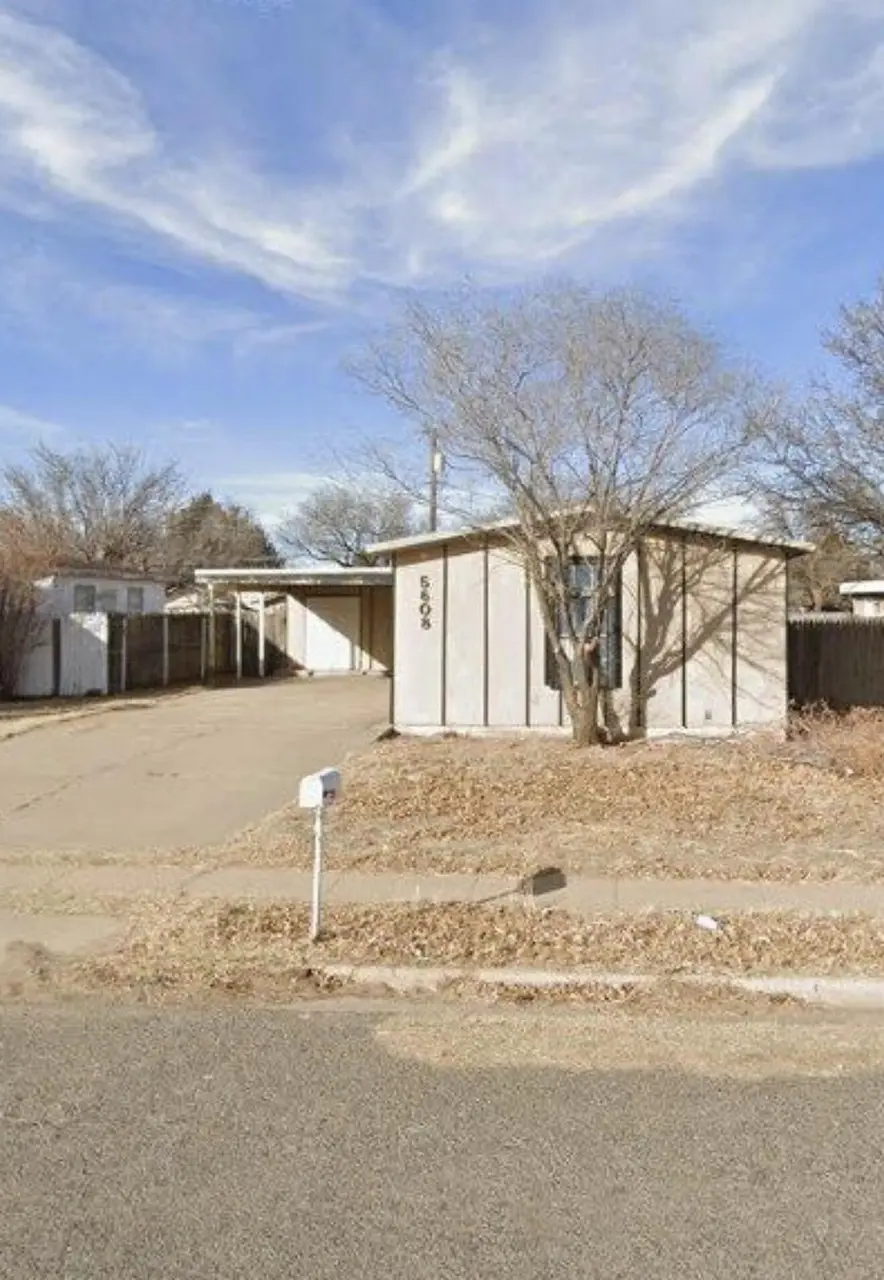
5608 46th St · Lubbock, TX
Flood risk 1/10 · Minimal
- FEMA flood zone
- X (unshaded)
- Chance of flooding over 30 yrs
- 0.0%
- Est. flood insurance / yr
- $507 – $1,088
Fire risk 1/10 · Minimal
- Est. fire insurance / yr
- $1,222 – $2,270
Heat risk 5/10 · Moderate
- Hot days now (above 99°F)
- 7 days/yr
- Hot days in 30 yrs
- 21 days/yr
Wind risk 2/10 · Minimal
- Chance of severe wind over 30 yrs
- —
Air-quality risk 2/10 · Minimal
- Unhealthy air days now
- 1 days/yr
- Unhealthy air days in 30 yrs
- 1 days/yr
Risk factors via First Street. Map © Google.
Why this score? — see what drove the C grade
The composite is a weighted blend of 9 inputs, each scored 0–100. Each bar is that input's sub-score; the figure is the points it added to the 100-point composite (weight × sub-score).
- Cash flow +22.1/30.0
- ARV discount +7.5/15.0
- DSCR +7.1/10.0
- 1% rule +6.2/10.0
- Livability +4.0/5.0
- Schools +3.1/10.0
- Rent growth +2.6/5.0
- Condition / age +2.5/5.0
- Appreciation +0.0/10.0
$95,000
🖨 Deal sheet 📄 Offer letter ✓ Due diligence
Listing remarks MLS
This 3-bedroom, 1-bath property is a classic fix-and-flip or value-add project with strong potential. The home is being sold as-is and will require repairs and updates throughout, making it an ideal option for investors, contractors, or buyers looking to customize and add value. Conveniently located in an established area next to Marsha Sharp and Loop 289, the property offers solid upside potential for those ready to take on a renovation project.
Key facts
- Established area
- Require repairs
- Sold as-is
Tags
Neighborhood map
What this means for you Summary
Snapshot
- This is a 3-bed/1.0-bath single-family listed at $95k.
Deal economics
- At list price, monthly cash flow is $154 ($2k/yr) — positive.
- The deal already cash-flows at list — no discount required.
- Meets the 1% rule at list price ($1k rent vs $95k).
- Recommended offer: $89k (6.0% below list) — sets the bar for market timing.
Location & tenants
- Location reads 80/100 on livability (#37 in TX, #1,749 nationally) — a professional / high-income tenant draw. Strengths: commute A+, cost of living A+, housing A+; Watch: employment C-, schools D+, crime F.
- Lubbock ISD (urban): math 36% / reading 39% proficiency, ranked #481 of 826 in TX (top 58%) — families likely to look elsewhere, expect single-tenant / working-renter base with shorter leases; 60% free/reduced lunch — lower-income household profile, screen leases tightly.
- Market conditions: Rents flat; 89 active listings in the ZIP; 40 comparable units currently listed for rent nearby; rentals at typical pace (median 21d on market — plan ~3-4 weeks tenant-placement turnaround); 2,219 units permitted in Lubbock County in 2024 (252 in 5+ unit buildings).
Forward outlook
- Local home prices are declining (-3.0%/yr); year-one equity from $657 of loan paydown is wiped out by about $3k of value loss. Plan a longer hold.
- Lubbock County population projected at +39% by 2050 — long-run rental-demand tailwind backs the buy-and-hold thesis.
Negotiation context
- It's been on market 62 days — a 6% lower offer ($89k) is reasonable based on typical stale-listing flexibility.
Risks & watch-outs
- Climate carrying-cost: extreme-heat days projected 7→21/yr by 2055 (HVAC capex compounding) — expect insurance premiums to compound above CPI over the hold.
Questions for the listing agent
- It's been on market 62 days. Have you received any prior offers? Is the seller open to a 6% concession, seller financing, or rate buy-down credit?
- Built in 1971 — when were the roof, HVAC, electrical panel, plumbing, and water heater last replaced?
- Why hasn't it sold? Are there any deal-killer items the seller is aware of (foundation, flood, title, zoning, code violations)?
- Is there a deadline driving the sale (1031 exchange, divorce, estate, relocation)? That informs how much negotiation room exists.
- Schools are D-rated, which usually means shorter tenancies and higher turnover. Who's the typical renter profile here, and what's been the actual vacancy rate?
- Crime grade is F in this area — have there been break-ins, vandalism, or insurance claims at this property in the last 3 years? What carrier currently insures it and at what premium?
- What's the average days-on-market for RENTAL listings here right now (not sales)? A rising rental-DOM trend means longer vacancies and softer asking-rent achievability than the comps imply.
- What's the recent tenant-quality profile in this submarket — average credit score on applications, eviction rate, late-payment / NSF rate, and stable-employment percentage? A property-management company in the area should have these aggregated.
- How much new for-sale + rental construction is in the pipeline within 1–3 miles? Heavy new supply typically softens prices + rents 12–24 months out; constrained supply supports both.
Investment metrics
- 1% rule
- 1.12% ✓
- Cap rate
- 8.23%
- Cash-on-cash
- 6.93%
- DSCR
- 1.31
- GRM
- 7.4
CMA / ARV
No comps found within radius.
Projected returns pro-forma
-3.0% appreciation · 0.56% rent growth · sell at horizon
- IRR
- -8.5%
- Equity multiple
- 0.69×
- Total profit
- $-8,128
- Equity at exit
- $14,165
- IRR
- -2.7%
- Equity multiple
- 0.84×
- Total profit
- $-4,327
- Equity at exit
- $8,214
Cash invested: $26,600 (down + closing). Projections, not guarantees.
Landlord ↔ Tenant lean methodology
- Overall (STATE)
- 87 Strongly Landlord-Friendly
- State Texas
- 87 Strongly Landlord-Friendly · R+5
- County
- — inherits STATE
- City
- — inherits STATE
ZIP-level market 79414
- Home prices YoY
- -27.8%
- Rents YoY
- 0.6%
- Active inventory
- 89
- Price-to-rent
- 7.4×
Monthly cashflow live
- Estimated rent
- $1,068 high interval (Pro) →
- Mortgage (P&I)
- −$498
- Tax from tax record
- −$152 /mo · $1,830/yr
- Insurance
- −$40
- HOA
- −$0
- Vacancy / Maint / Mgmt
- −$224
- Net cashflow
- $154
Break-even live
UW: 25.0% down · 7.5% · 30yr · 1.5% tax · 5.0% vac · 8.0% maint · 8.0% mgmt
Financing live
Cash to close
- Down payment
- $23,750
- Closing costs
- $2,850
- Reserves months
- —
- Total cash needed
- —
Loan-product check · same deal, 3 products live
Conventional
25% down · 7.5% · 30yr
- Down + closing
- —
- Monthly P&I
- —
- Monthly cashflow
- —
- DSCR
- —
- Eligible?
- —
Personal DTI + credit; lowest rate.
DSCR
20% down · 8.5% · 30yr
- Down + closing
- —
- Monthly P&I
- —
- Monthly cashflow
- —
- DSCR
- —
- Eligible?
- —
No personal income docs; deal must DSCR.
Hard money
10% down · 12.0% · 12mo
- Down + closing
- —
- Monthly P&I
- —
- Monthly cashflow
- —
- DSCR
- —
- Eligible?
- —
Short-term bridge; refi at stabilization.
Rent comps 40 comps
| Address | Beds | Baths | Sqft | Rent | $/sqft | DOM | Units | Dist |
|---|---|---|---|---|---|---|---|---|
| 5714 Brownfield Dr Lubbock, TX | 2.0 | 1.0 | 748 | $699 | $0.93 | 43d | 1 | 0.13mi |
| 5716 Brownfield Dr Lubbock, TX | 2.0 | 1.0 | 748 | $649 | $0.87 | 13d | 1 | 0.14mi |
| 5716 Brownfield Dr Lubbock, TX | 2.0 | 1.0 | 748 | $699 | $0.93 | 21d | 1 | 0.14mi |
| 5718 Brownfield Dr Lubbock, TX | 2.0 | 1.0 | 748 | $649 | $0.87 | 21d | 1 | 0.14mi |
| 5722 Brownfield Dr Unit C Lubbock, TX | 2.0 | 1.0 | 800 | $750 | $0.94 | 44d | 1 | 0.15mi |
| 5702 50th St Lubbock, TX | 1.0–3.0 | 1.0–2.0 | 809 | $1,069 | $1.32 | 13d | 27 | 0.19mi |
| 5430 50th St Lubbock, TX | 1.0–2.0 | 1.0–1.5 | 730 | $975 | $1.34 | 13d | 8 | 0.32mi |
| 5501 50th St Lubbock, TX | 1.0–3.0 | 1.0–2.0 | 1125 | $1,549 | $1.38 | 13d | 7 | 0.36mi |
| 5415 42nd St Lubbock, TX | 3.0 | 2.0 | 1417 | $1,450 | $1.02 | 21d | 1 | 0.38mi |
| 5433 40th St Unit A Lubbock, TX | 2.0 | 1.5 | 978 | $800 | $0.82 | 43d | 1 | 0.38mi |
| 5001 Chicago Ave Lubbock, TX | 1.0–2.0 | 1.0–2.0 | 715 | $1,019 | $1.43 | 13d | 15 | 0.44mi |
| 5401 50th St Lubbock, TX | 1.0–3.0 | 1.0–2.0 | 1018 | $1,099 | $1.08 | 13d | 11 | 0.45mi |
| 5604 38th St Lubbock, TX | 3.0 | 2.0 | 1442 | $1,400 | $0.97 | 21d | 1 | 0.51mi |
| 5202 Bangor Ave Lubbock, TX | 2.0 | 1.5 | 1080 | $987 | $0.91 | 13d | 11 | 0.51mi |
| 5302 48th St Lubbock, TX | 3.0 | 2.0 | 1368 | $1,450 | $1.06 | 21d | 1 | 0.55mi |
| 5550 56th St Lubbock, TX | 1.0–3.0 | 1.0–2.0 | 958 | $1,260 | $1.31 | 13d | 21 | 0.59mi |
| 4705 Albany Ave Lubbock, TX | 2.0 | 2.0 | 926 | $742 | $0.80 | 13d | 5 | 0.59mi |
| 5204 50th St Lubbock, TX | 2.0–3.0 | 2.0 | 1050 | $1,150 | $1.10 | 13d | 2 | 0.60mi |
| 5416 36th St Lubbock, TX | 3.0 | 2.0 | 1375 | $1,295 | $0.94 | 43d | 1 | 0.64mi |
| 5406 36th St Lubbock, TX | 3.0 | 2.0 | 1400 | $695 | $0.50 | 43d | 1 | 0.66mi |
| 5306 38th St Lubbock, TX | 2.0 | 1.0 | 922 | $825 | $0.89 | 43d | 1 | 0.73mi |
| 5304 38th St Lubbock, TX | 2.0 | 1.0 | 922 | $825 | $0.89 | 43d | 1 | 0.74mi |
| 5214 38th St Lubbock, TX | 2.0 | 1.0 | 922 | $825 | $0.89 | 43d | 1 | 0.75mi |
| 5128 Aberdeen Ave Unit 206 Lubbock, TX | 2.0 | 1.5 | 1100 | $915 | $0.83 | 21d | 1 | 0.75mi |
| 5128 Aberdeen Ave Lubbock, TX | 1.0–2.0 | 1.0–1.5 | 925 | $915 | $0.99 | 21d | 9 | 0.75mi |
| 5101 44th St Lubbock, TX | 3.0 | 2.0 | 1160 | $1,350 | $1.16 | 21d | 1 | 0.78mi |
| 5002 46th St Lubbock, TX | 3.0 | 2.0 | 1369 | $1,450 | $1.06 | 43d | 1 | 0.91mi |
| 3201 W Loop 289 Lubbock, TX | 1.0–2.0 | 1.0–2.0 | 771 | $1,095 | $1.42 | 43d | 1 | 0.93mi |
| 5105 36th St Lubbock, TX | 2.0 | 1.0 | 788 | $900 | $1.14 | 21d | 1 | 0.95mi |
| 4916 46th St Lubbock, TX | 3.0 | 2.0 | 1377 | $1,450 | $1.05 | 13d | 1 | 0.95mi |
| 5011 52nd St Lubbock, TX | 3.0 | 2.0 | 1292 | $1,500 | $1.16 | 21d | 1 | 0.95mi |
| 4926 48th St Lubbock, TX | 3.0 | 2.0 | 1354 | $1,500 | $1.11 | 21d | 1 | 0.96mi |
| 6104 37th St Unit A Lubbock, TX | 2.0 | 1.5 | 950 | $780 | $0.82 | 43d | 1 | 0.97mi |
| 6108 37th St Unit B Lubbock, TX | 2.0 | 1.5 | 894 | $799 | $0.89 | 43d | 1 | 0.99mi |
| 5106 35th St Lubbock, TX | 2.0 | 1.0 | 840 | $900 | $1.07 | 21d | 1 | 1.01mi |
| 4907 41st St Lubbock, TX | 3.0 | 2.0 | 1196 | $1,200 | $1.00 | 43d | 1 | 1.03mi |
| 5024 35th St Lubbock, TX | 3.0 | 2.0 | 1364 | $1,300 | $0.95 | 21d | 1 | 1.04mi |
| 4819 44th St Lubbock, TX | 3.0 | 2.0 | 1412 | $1,300 | $0.92 | 43d | 1 | 1.05mi |
| 4815 43rd St Lubbock, TX | 3.0 | 2.0 | 1282 | $1,500 | $1.17 | 21d | 1 | 1.08mi |
| 4817 40th St Lubbock, TX | 3.0 | 2.0 | 1254 | $1,300 | $1.04 | 13d | 1 | 1.11mi |
Listing history 18 events
-
2026-06-18days on market $95,000 Active 62 DOM
-
2026-06-17days on market $95,000 Active 61 DOM
-
2026-06-16days on market $95,000 Active 60 DOM
-
2026-06-15days on market $95,000 Active 59 DOM
-
2026-06-14days on market $95,000 Active 57 DOM
-
2026-06-13days on market $95,000 Active 56 DOM
-
2026-06-10days on market $95,000 Active 54 DOM
-
2026-06-09days on market $95,000 Active 53 DOM
-
2026-06-08days on market $95,000 Active 52 DOM
-
2026-06-07days on market $95,000 Active 51 DOM
-
2026-06-05days on market $95,000 Active 48 DOM
-
2026-06-03days on market $95,000 Active 47 DOM
-
2026-06-02days on market $95,000 Active 46 DOM
-
2026-06-01days on market $95,000 Active 45 DOM
-
2026-05-31days on market $95,000 Active 44 DOM
-
2026-05-30days on market $95,000 Active 43 DOM
-
2026-04-01$95,000 Active 450-char remark
Show marketing remark (450 chars)
This 3-bedroom, 1-bath property is a classic fix-and-flip or value-add project with strong potential. The home is being sold as-is and will require repairs and updates throughout, making it an ideal option for investors, contractors, or buyers looking to customize and add value. Conveniently located in an established area next to Marsha Sharp and Loop 289, the property offers solid upside potential for those ready to take on a renovation project.
-
2001-07-23soldstatus
ⓘ Source: listings_history table (triggers on properties + properties_extension) + one-shot
backfill from property_details.listing_events for pre-trigger history.
Tax reassessment forecast TX · Resets to sale price
- Current annual tax
- $1,830 · $152/mo
- Projected year-2 tax
- $1,830 · $152/mo
- Expected delta
- $0/yr ($0/mo · 0.0%)
ⓘ Screening estimate from a state-policy table — verify with the county assessor before closing.
Climate risk First Street
- Flood 1/10 Low FEMA zone X (unshaded) · 0% chance over 30 yrs
- Wildfire 1/10 Low
- Heat 5/10 Major 7 d/yr ≥99°F today · 21 d/yr by 30 yrs out
- Wind 2/10 Low
- Air quality 2/10 Low 1 unhealthy d/yr today · 1 by 30 yrs out
Nearby sold comps map
Loading sold comps map…
Walkable amenities ~0.75 mi
Loading nearby amenities…
Taxation est. · year 1
- Rental income
- $12,819
- − Mortgage interest
- −$5,321
- − Property taxes
- −$1,830
- − Insurance
- −$475
- − Repairs & maintenance
- −$1,026
- − Management
- −$1,026
- − Depreciation
- −$2,764
- Taxable income
- $379
- Est. tax owed @ 24.0%
- −$91
- After-tax cash flow
- $1,754/yr
For passive investors: Depreciation is non-cash, so a rental often shows a tax loss while cash-flowing — sheltering income. Rental losses are passive: they offset passive income freely, and up to $25,000/yr can offset ordinary (W-2) income if you actively participate and your MAGI is under $100k (phasing out to $0 by $150k); unused losses carry forward. On sale, claimed depreciation is recaptured at up to 25%, and gains may owe capital-gains tax (a 1031 exchange can defer both). Figures are a year-1 estimate at your 24.0% rate — not tax advice; consult a CPA.
Schools (NCES district)
- District
- Lubbock ISD
- NCES district ID
- 4828500
- Math proficiency
- 36% ▼ -8.00%
- Reading proficiency
- 39% ▼ -1.00%
- Median HH income
- $39,820
- Composite
- 31.44/100
- National rank
- #5984
- State rank
- #481 of 826 in TX
Livability — Lubbock
- Score
- 80/100
- State rank
- #37
- US rank
- #1749
Category grades
Schools grade is shown separately in the Schools card above.
Census & demographics
- Census place
- Lubbock, TX
- County
- Lubbock County · 293,542 people
- City population
- 283,030
- Metro
- Lubbock, TX
- Population (ZIP)
- 17,596
- Household income
- $49,057
- Rent vs Own
- Severe rent burden
- 1330.0
Population outlook (Lubbock County) Hauer SSP2
- Today (2025)
- 345,960 people
- By 2030
- 371,449 · +7.4%
- By 2040
- 424,539 · +22.7%
- By 2050
- 481,150 · +39.1%
- By 2075
- 633,467 · +83.1%
- By 2100
- 746,853 · +115.9%
Race, ethnicity, and origin ACS 2023
- Neighborhood character
- Diverse neighborhood (Simpson 0.62)
- Race & ethnicity
- White 47% Hispanic / Latino 39% Two or more races 21% Black 9% Asian 1%
- Hispanic origin (detail)
- Mexican 30%
- Common ancestry
- Slovak 2% Serbian 1% Italian 1%
- Foreign-born
- 3% · Canada, China
- Languages at home
- 82% English-only · Spanish 16%
Political lean MEDSL · Lubbock
- 2024 margin
- Solid R (+39.5) · D 29.7% · R 69.2% · Other 1.0%
- 2008→2024 swing
- -2.8pp toward R · 2008: -36.7pp · 2024: -39.5pp
- All cycles
- 2024: R+39.5 2020: R+32.2 2016: R+38.4 2012: R+40.9 2008: R+36.7
Not yet ingested
- Civics
- —
Market trends
- HPI YoY
- ▼ -95.31%
- Current HPI
- 247.7963
- Rent YoY
- ▲ 0.56%
- Metro
- Lubbock, TX
- State GDP YoY
- ▲ 3.95%
- F500 in state
- 110
Industry mix (Fortune 500 HQ in TX)
| Industry | F500 HQs | Revenue |
|---|---|---|
| Energy | 16 | $1,198B |
|
||
| Technology | 5 | $198B |
|
||
| Engineering / Construction | 4 | $72B |
|
||
| Energy Services | 3 | $60B |
|
||
| Utilities | 3 | $41B |
|
||
| Healthcare | 2 | $330B |
|
||
Price history
2 events — show timeline
- 2026-04-01 Listed $95,000 LARMLS
- 2001-07-23 Sold (Public Records) — Public Records
Property tax history
+4.8%/yrLatest (2025): $1,830 · -5.5% YoY. Source: county tax records.
Cash-flow waterfall
monthlySold comps — $/sqft
last 12 mo · ≤1 miLoading sold comps…