543 Tucker Ln · Metropolis, IL
Flood risk 1/10 · Minimal
- FEMA flood zone
- —
- Chance of flooding over 30 yrs
- 0.0%
- Est. flood insurance / yr
- —
Fire risk 2/10 · Minimal
- Est. fire insurance / yr
- $804 – $1,492
Heat risk 5/10 · Moderate
- Hot days now (above 108°F)
- 7 days/yr
- Hot days in 30 yrs
- 21 days/yr
Wind risk 3/10 · Minor
- Chance of severe wind over 30 yrs
- 5.0%
Air-quality risk 2/10 · Minimal
- Unhealthy air days now
- 1 days/yr
- Unhealthy air days in 30 yrs
- 2 days/yr
Risk factors via First Street. Map © Google.
Why this score? — see what drove the B- grade
The composite is a weighted blend of 9 inputs, each scored 0–100. Each bar is that input's sub-score; the figure is the points it added to the 100-point composite (weight × sub-score).
- Cash flow +30.0/30.0
- 1% rule +10.0/10.0
- DSCR +10.0/10.0
- ARV discount +7.5/15.0
- Livability +3.8/5.0
- Schools +3.4/10.0
- Rent growth +2.5/5.0
- Condition / age +2.5/5.0
- Appreciation +0.0/10.0
$44,500
🖨 Deal sheet 📄 Offer letter ✓ Due diligence
Listing remarks MLS
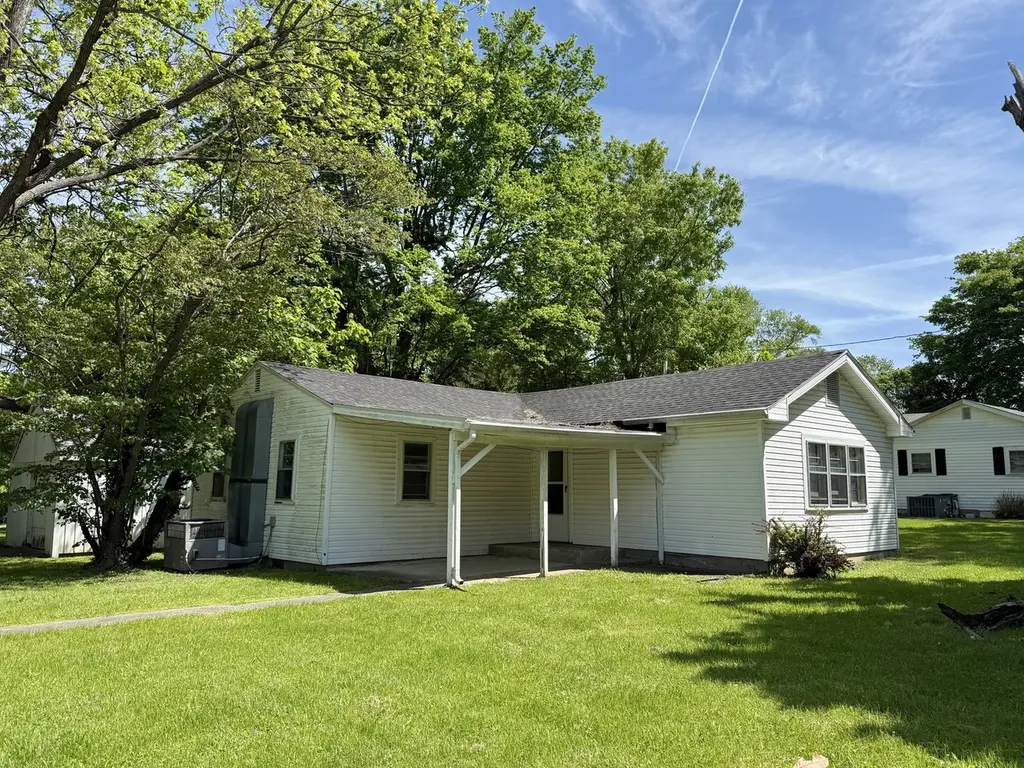
543 Tucker Lane is a very nice two-three bedroom, one bath home with 20x20 detached garage. New in 2017: Flooring, Kitchen Updates, Hot Water Heater, and Utility Room Windows. Additional updates include new breaker box, roof (2013), and all plumbing (2010). Enjoy the pretty neighborhood from the 16x11 covered front porch! Cooktop/Oven, Dishwasher, Washer, Dryer, Refrigerator
Key facts
- Covered front porch
- Functional footprint
- Detached garage
Tags
Property features AI
Finance
- Other: Possession at closing
- Financial info: Special service area: No
- HOA & community: No master association fee required
Exterior
- Parking: Detached garage; Gravel parking; Two total parking spaces (2-car garage)
- Utilities: Public water; Public sewer
- Home design: Detached single-family home; One-story layout; Built approximately 71–80 years ago; Asphalt roof; Vinyl siding with frame construction; Fee simple ownership
- Construction: Frame construction with vinyl siding; Asphalt roof; Built before 1978
- Exterior features: Half- to nearly one-acre lot (approx. 0.5–0.99 acre); Lot dimensions roughly 120 x 210
Interior
- Kitchen: Range; Dishwasher; Refrigerator; Kitchen on main level (12 x 8)
- Bedrooms: Master bedroom on main level (11 x 18); Two additional main-level bedrooms, each about 10 x 11
- Flooring: Hardwood flooring in listed bedrooms
- Bathrooms: One full bathroom
- Heating & cooling: Natural gas heating; Central air conditioning
- Interior features: Six total rooms
- Laundry & utility: Main-level laundry room (11 x 13)
Neighborhood map
What this means for you Summary
Snapshot
- This is a 3-bed/1.0-bath other listed at $44k.
Deal economics
- At list price, monthly cash flow is $542 ($6k/yr) — positive.
- The deal already cash-flows at list — no discount required.
- Meets the 1% rule at list price ($1k rent vs $44k).
- Recommended offer: $43k (3.0% below list) — sets the bar for market timing.
- Cap rate 20.9% vs local median 5.3% in Metropolis — top-decile yield for the area; either an underpriced asset or a hidden risk that comps aren't pricing in. Stress-test before assuming the spread holds.
Location & tenants
- Location reads 75/100 on livability (#217 in IL, #4,091 nationally) — a middle-class / working-renter tenant base. Strengths: cost of living A+, housing A+, health & safety A+; Watch: schools D-, commute F, employment D-.
- Joppa-Maple Grove UD 38 (rural): math 40% / reading 35% proficiency, ranked #376 of 919 in IL (top 41%) — families likely to look elsewhere, expect single-tenant / working-renter base with shorter leases.
- Market conditions: 73 active listings in the ZIP; 5 units permitted in Massac County in 2024 (0 in 5+ unit buildings).
Forward outlook
- Local home prices are declining (-3.0%/yr); year-one equity from $308 of loan paydown is wiped out by about $1k of value loss. Plan a longer hold.
- Massac County population projected at -28% by 2050 — secular population decline; favor cash flow + early exit over multi-decade hold.
- At projected returns (-3.0% appreciation + 3.0% rent growth), your $12k cash investment doubles in ~3 years — after that, you're playing with house money.
Negotiation context
- It's been on market 58 days — a 3% lower offer ($43k) is reasonable based on typical stale-listing flexibility.
- 3 sale attempts since 9y ago; this cycle's ask has dropped $10k (19%) from the opening price — seller is motivated, your offer sets the floor, not the list.
Risks & watch-outs
- Watch-outs: built in 1953 — expect roof / HVAC / electrical / plumbing capex.
- Climate carrying-cost: extreme-heat days projected 7→21/yr by 2055 (HVAC capex compounding) — expect insurance premiums to compound above CPI over the hold.
Questions for the listing agent
- It's been on market 58 days. Have you received any prior offers? Is the seller open to a 3% concession, seller financing, or rate buy-down credit?
- Built in 1953 — when were the roof, HVAC, electrical panel, plumbing, and water heater last replaced?
- Is there a deadline driving the sale (1031 exchange, divorce, estate, relocation)? That informs how much negotiation room exists.
- Schools are D-rated, which usually means shorter tenancies and higher turnover. Who's the typical renter profile here, and what's been the actual vacancy rate?
- What's the average days-on-market for RENTAL listings here right now (not sales)? A rising rental-DOM trend means longer vacancies and softer asking-rent achievability than the comps imply.
- What's the recent tenant-quality profile in this submarket — average credit score on applications, eviction rate, late-payment / NSF rate, and stable-employment percentage? A property-management company in the area should have these aggregated.
- How much new for-sale + rental construction is in the pipeline within 1–3 miles? Heavy new supply typically softens prices + rents 12–24 months out; constrained supply supports both.
Investment metrics
- 1% rule
- 2.47% ✓
- Cap rate
- 20.90%
- Cash-on-cash
- 52.16%
- DSCR
- 3.32
- GRM
- 3.4
CMA / ARV
No comps found within radius.
Projected returns pro-forma
-3.0% appreciation · 3.0% rent growth · sell at horizon
- IRR
- 50.1%
- Equity multiple
- 3.19×
- Total profit
- $27,314
- Equity at exit
- $6,635
- IRR
- 55.6%
- Equity multiple
- 6.48×
- Total profit
- $68,322
- Equity at exit
- $3,848
Cash invested: $12,460 (down + closing). Projections, not guarantees.
Landlord ↔ Tenant lean methodology
- Overall (STATE)
- 43 Moderately Tenant-Leaning
- State Illinois
- 43 Moderately Tenant-Leaning · D+7
- County
- — inherits STATE
- City
- — inherits STATE
ZIP-level market 62960
- Home prices YoY
- -19.6%
- Active inventory
- 73
- Price-to-rent
- 3.4×
Monthly cashflow live
- Estimated rent
- $1,101 medium interval (Pro) →
- Mortgage (P&I)
- −$233
- Tax from tax record
- −$76 /mo · $912/yr
- Insurance
- −$19
- HOA
- −$0
- Vacancy / Maint / Mgmt
- −$231
- Net cashflow
- $542
Break-even live
UW: 25.0% down · 7.5% · 30yr · 1.5% tax · 5.0% vac · 8.0% maint · 8.0% mgmt
Financing live
Cash to close
- Down payment
- $11,125
- Closing costs
- $1,335
- Reserves months
- —
- Total cash needed
- —
Loan-product check · same deal, 3 products live
Conventional
25% down · 7.5% · 30yr
- Down + closing
- —
- Monthly P&I
- —
- Monthly cashflow
- —
- DSCR
- —
- Eligible?
- —
Personal DTI + credit; lowest rate.
DSCR
20% down · 8.5% · 30yr
- Down + closing
- —
- Monthly P&I
- —
- Monthly cashflow
- —
- DSCR
- —
- Eligible?
- —
No personal income docs; deal must DSCR.
Hard money
10% down · 12.0% · 12mo
- Down + closing
- —
- Monthly P&I
- —
- Monthly cashflow
- —
- DSCR
- —
- Eligible?
- —
Short-term bridge; refi at stabilization.
Listing history 23 events
-
2026-06-18days on market $44,500 Active 58 DOM
-
2026-06-17days on market $44,500 Active 57 DOM
-
2026-06-16days on market $44,500 Active 56 DOM
-
2026-06-16price $44,500 Active 55 DOM
-
2026-06-15days on market $49,900 Active 55 DOM
-
2026-06-13days on market $49,900 Active 53 DOM
-
2026-06-12days on market $49,900 Active 52 DOM
-
2026-06-09days on market $49,900 Active 49 DOM
-
2026-06-09remarks 696-char remark
-
2026-06-08days on market $49,900 Active 48 DOM
-
2026-06-07days on market $49,900 Active 47 DOM
-
2026-06-05days on market $49,900 Active 45 DOM
-
2026-06-04days on market $49,900 Active 43 DOM
-
2026-06-02days on market $49,900 Active 42 DOM
-
2026-06-01days on market $49,900 Active 41 DOM
-
2026-05-31days on market $49,900 Active 40 DOM
-
2026-05-31days on market $49,900 Active 39 DOM
-
2026-05-21price $49,900
-
2026-04-20$55,000 Active
-
2018-11-02soldstatus $40,000 377-char remark
Show marketing remark (377 chars)
543 Tucker Lane is a very nice two-three bedroom, one bath home with 20x20 detached garage. New in 2017: Flooring, Kitchen Updates, Hot Water Heater, and Utility Room Windows. Additional updates include new breaker box, roof (2013), and all plumbing (2010). Enjoy the pretty neighborhood from the 16x11 covered front porch! Cooktop/Oven, Dishwasher, Washer, Dryer, Refrigerator
-
2017-09-28$46,500 377-char remark
Show marketing remark (377 chars)
543 Tucker Lane is a very nice two-three bedroom, one bath home with 20x20 detached garage. New in 2017: Flooring, Kitchen Updates, Hot Water Heater, and Utility Room Windows. Additional updates include new breaker box, roof (2013), and all plumbing (2010). Enjoy the pretty neighborhood from the 16x11 covered front porch! Cooktop/Oven, Dishwasher, Washer, Dryer, Refrigerator
ⓘ Source: listings_history table (triggers on properties + properties_extension) + one-shot
backfill from property_details.listing_events for pre-trigger history.
Tax reassessment forecast IL · Partial reset (capped growth)
- Current annual tax
- $912 · $76/mo
- Projected year-2 tax
- $961 · $80/mo
- Expected delta
- +$49/yr (+$4/mo · 5.4%)
ⓘ Screening estimate from a state-policy table — verify with the county assessor before closing.
Climate risk First Street
- Flood 1/10 Low 0% chance over 30 yrs
- Wildfire 2/10 Low
- Heat 5/10 Major 7 d/yr ≥108°F today · 21 d/yr by 30 yrs out
- Wind 3/10 Moderate 5% chance of damaging wind over 30 yrs
- Air quality 2/10 Low 1 unhealthy d/yr today · 2 by 30 yrs out
Nearby sold comps map
Loading sold comps map…
Walkable amenities ~0.75 mi
Loading nearby amenities…
Taxation est. · year 1
- Rental income
- $13,208
- − Mortgage interest
- −$2,493
- − Property taxes
- −$912
- − Insurance
- −$222
- − Repairs & maintenance
- −$1,057
- − Management
- −$1,057
- − Depreciation
- −$1,295
- Taxable income
- $6,173
- Est. tax owed @ 24.0%
- −$1,482
- After-tax cash flow
- $5,018/yr
For passive investors: Depreciation is non-cash, so a rental often shows a tax loss while cash-flowing — sheltering income. Rental losses are passive: they offset passive income freely, and up to $25,000/yr can offset ordinary (W-2) income if you actively participate and your MAGI is under $100k (phasing out to $0 by $150k); unused losses carry forward. On sale, claimed depreciation is recaptured at up to 25%, and gains may owe capital-gains tax (a 1031 exchange can defer both). Figures are a year-1 estimate at your 24.0% rate — not tax advice; consult a CPA.
Schools (NCES district)
- District
- Joppa-Maple Grove UD 38
- NCES district ID
- 1700015
- Math proficiency
- 40% ▼ -5.00%
- Reading proficiency
- 35% ▼ -10.00%
- Median HH income
- $41,904
- Composite
- 34.18/100
- National rank
- #10263
- State rank
- #376 of 919 in IL
Livability — Metropolis
- Score
- 75/100
- State rank
- #217
- US rank
- #4091
Category grades
Schools grade is shown separately in the Schools card above.
Census & demographics
- Population (ZIP)
- 10,823
Population outlook (Massac County) Hauer SSP2
- Today (2025)
- 13,461 people
- By 2030
- 12,675 · -5.8%
- By 2040
- 11,124 · -17.4%
- By 2050
- 9,711 · -27.9%
- By 2075
- 7,253 · -46.1%
- By 2100
- 5,666 · -57.9%
Race, ethnicity, and origin ACS 2023
- Neighborhood character
- Predominantly White (86%)
- Race & ethnicity
- White 86% Black 7% Two or more races 5% Hispanic / Latino 3%
- Common ancestry
- Romanian 2% Serbian 2% Lithuanian 2%
- Foreign-born
- 2% · Canada
- Languages at home
- 97% English-only · Spanish 2%
Political lean MEDSL · Massac
- 2024 margin
- Solid R (+48.8) · D 25.2% · R 74.0%
- 2008→2024 swing
- -25.4pp toward R · 2008: -23.4pp · 2024: -48.8pp
- All cycles
- 2024: R+48.8 2020: R+48.0 2016: R+49.6 2012: R+33.7 2008: R+23.4
Not yet ingested
- Civics
- —
Market trends
- HPI YoY
- ▼ -33.38%
- Current HPI
- 137.0772
- Rent YoY
- —
- Metro
- —
- State GDP YoY
- ▲ 1.59%
- F500 in state
- 60
Industry mix (Fortune 500 HQ in IL)
| Industry | F500 HQs | Revenue |
|---|---|---|
| Insurance | 4 | $201B |
|
||
| Consumer Goods | 4 | $87B |
|
||
| Industrial Machinery | 3 | $64B |
|
||
| Healthcare | 2 | $55B |
|
||
| Retail / Pharmacy | 1 | $148B |
|
||
| Agriculture / Food | 1 | $86B |
|
||
Price history
+7.3% since first listed6 events — show timeline
- 2026-05-21 Price Changed $49,900 MRED as Distributed by MLS Grid
- 2026-04-20 Listed $55,000 MRED as Distributed by MLS Grid
- 2018-11-02 Sold (MLS) $40,000 MRED as Distributed by MLS Grid
- 2018-11-02 Sold (MLS) $40,000 RMLSA as Distributed by MLS Grid
- 2017-09-28 Listed $46,500 MRED as Distributed by MLS Grid
- 2017-09-28 Listed $46,500 RMLSA as Distributed by MLS Grid
Property tax history
-3.6%/yrLatest (2024): $912 · +4.3% YoY. Source: county tax records.
Cash-flow waterfall
monthlySold comps — $/sqft
last 12 mo · ≤1 miLoading sold comps…