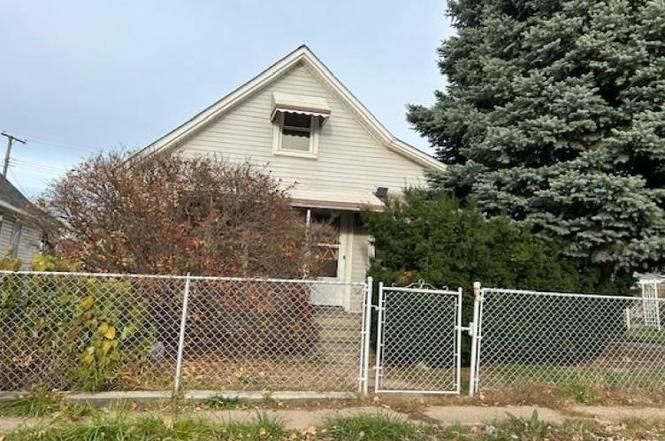
26 W Benson St · Ecorse, MI
Flood risk 3/10 · Minor
- FEMA flood zone
- X (unshaded)
- Chance of flooding over 30 yrs
- 0.2%
- Est. flood insurance / yr
- $507 – $1,088
Fire risk 1/10 · Minimal
- Est. fire insurance / yr
- $784 – $1,456
Heat risk 3/10 · Minor
- Hot days now (above 97°F)
- 7 days/yr
- Hot days in 30 yrs
- 16 days/yr
Wind risk 2/10 · Minimal
- Chance of severe wind over 30 yrs
- —
Air-quality risk 4/10 · Minor
- Unhealthy air days now
- 6 days/yr
- Unhealthy air days in 30 yrs
- 6 days/yr
Risk factors via First Street. Map © Google.
Why this score? — see what drove the A- grade
The composite is a weighted blend of 9 inputs, each scored 0–100. Each bar is that input's sub-score; the figure is the points it added to the 100-point composite (weight × sub-score).
- Cash flow +30.0/30.0
- ARV discount +15.0/15.0
- 1% rule +10.0/10.0
- DSCR +10.0/10.0
- Appreciation +10.0/10.0
- Livability +3.5/5.0
- Rent growth +2.5/5.0
- Condition / age +2.5/5.0
- Schools +0.3/10.0
$46,300
🖨 Deal sheet 📄 Offer letter ✓ Due diligence
Listing remarks MLS
This two bedroom, one bathroom home is situated on two lots. Near parks and neighborhood amenities, great location. Reserve Auction – NO ACCESS OR VIEWINGS of this property. "As is" sale with no contingencies or inspections. Seller cannot guarantee occupancy. Buyer will be responsible for obtaining possession of the property upon closing. * * * SPECIAL NOTES: (1) This is a CASH ONLY transaction. (2) Seller to pay Taxes, HOA, and Municipal/Utility Liens. (3) Please read the Auction disclaimers carefully before placing a bid or submitting an offer. * * *
Key facts
- 3,049 sq ft lot
- Built 1916
- Listed 105 days
Property features AI
Exterior
- Parking: No garage
- Utilities: Public water; Public sewer
- Home design: Single-family residence; One and one-half story; Ground-level entry with steps; Vinyl siding
- Construction: Vinyl siding construction
- Exterior features: Paved road access; Lot approximately 82 x 104 (0.07 acres)
Interior
- Bedrooms: 2 rooms total (includes bedrooms)
- Bathrooms: 1 full bathroom
- Heating & cooling: Forced air heating (natural gas); No central cooling
- Interior features: Crawl space basement; Two total rooms
Neighborhood map
What this means for you Summary
Snapshot
- This is a 2-bed/1.0-bath single-family listed at $46k.
Deal economics
- At list price, monthly cash flow is $592 ($7k/yr) — positive.
- The deal already cash-flows at list — no discount required.
- Meets the 1% rule at list price ($1k rent vs $46k).
- Recommended offer: $42k (9.0% below list) — sets the bar for market timing.
- Cap rate 21.6% vs local median 9.6% in Ecorse — top-decile yield for the area; either an underpriced asset or a hidden risk that comps aren't pricing in. Stress-test before assuming the spread holds.
Location & tenants
- Location reads 69/100 on livability (#348 in MI) — a middle-class / working-renter tenant base. Strengths: commute A+, cost of living A+, housing A+; Watch: health & safety D+, schools F, crime F.
- Ecorse Public Schools (suburban): math 3% / reading 7% proficiency, ranked #536 of 540 in MI (top 99%) — low school quality limits family demand, transient renter base, plan for 1-2y turnover; 80% free/reduced lunch — lower-income household profile, screen leases tightly.
- Market conditions: 56 active listings in the ZIP; 22 comparable units currently listed for rent nearby; rentals at typical pace (median 18d on market — plan ~3-4 weeks tenant-placement turnaround); 2,639 units permitted in Wayne County in 2024 (1,216 in 5+ unit buildings).
Forward outlook
- In year one you build about $5k of equity ($320 loan paydown + $5k appreciation (10.0% local appreciation)).
- Wayne County population projected at -17% by 2050 — secular population decline; favor cash flow + early exit over multi-decade hold.
- At projected returns (10.0% appreciation + 3.0% rent growth), your $13k cash investment doubles in ~2 years — after that, you're playing with house money.
- By year 7, paydown + projected appreciation supports a ~$36k cash-out refi (75% LTV) — recoverable capital for the next deal without selling this one.
Negotiation context
- It's been on market 105 days — a 9% lower offer ($42k) is reasonable based on typical stale-listing flexibility.
- 7 sale attempts since 20y ago with the ask held roughly flat each time — persistent listings suggest the price (not the market) is what's stuck; bring a comps-based counter.
Risks & watch-outs
- Watch-outs: built in 1916 — expect roof / HVAC / electrical / plumbing capex.
Questions for the listing agent
- It's been on market 105 days. Have you received any prior offers? Is the seller open to a 9% concession, seller financing, or rate buy-down credit?
- Built in 1916 — when were the roof, HVAC, electrical panel, plumbing, and water heater last replaced?
- Why hasn't it sold? Are there any deal-killer items the seller is aware of (foundation, flood, title, zoning, code violations)?
- Is there a deadline driving the sale (1031 exchange, divorce, estate, relocation)? That informs how much negotiation room exists.
- Schools are F-rated, which usually means shorter tenancies and higher turnover. Who's the typical renter profile here, and what's been the actual vacancy rate?
- Crime grade is F in this area — have there been break-ins, vandalism, or insurance claims at this property in the last 3 years? What carrier currently insures it and at what premium?
- What's the average days-on-market for RENTAL listings here right now (not sales)? A rising rental-DOM trend means longer vacancies and softer asking-rent achievability than the comps imply.
- What's the recent tenant-quality profile in this submarket — average credit score on applications, eviction rate, late-payment / NSF rate, and stable-employment percentage? A property-management company in the area should have these aggregated.
- How much new for-sale + rental construction is in the pipeline within 1–3 miles? Heavy new supply typically softens prices + rents 12–24 months out; constrained supply supports both.
Investment metrics
- 1% rule
- 2.47% ✓
- Cap rate
- 21.63%
- Cash-on-cash
- 54.76%
- DSCR
- 3.44
- GRM
- 3.4
CMA / ARV
- ARV (on-the-fly)
- $70,004
- Comps found
- 12
Show comp detail 12 sales within ~0.75 mi
| Address | Dist | Beds/Ba | Sqft | Sold | Price | $/sf | Match |
|---|---|---|---|---|---|---|---|
| 4435 High St | 0.23mi | 2/1.0 | 792 (-3%) | 2mo | $50,000 | $63 | 83 |
| 4353 3rd St | 0.32mi | 2/2.0 | 769 (-6%) | 4mo | $22,000 | $29 | 68 |
| 38 E Westfield St | 0.25mi | 2/1.0 | 768 (-6%) | 15mo | $71,000 | $92 | 67 |
| 26 E Josephine St | 0.36mi | 2/1.0 | 792 (-3%) | 17mo | $68,000 | $86 | 64 |
| 24 E Josephine St | 0.36mi | 2/1.0 | 756 (-7%) | 12mo | $68,000 | $90 | 61 |
| 4222 High St | 0.18mi | 2/1.0 | 933 (+15%) | 11mo | $90,000 | $96 | 58 |
| 4241 6th St | 0.37mi | 2/1.0 | 720 (-12%) | 6mo | $47,500 | $66 | 58 |
| 27 Knox St St | 0.69mi | 2/1.0 | 792 (-3%) | 10mo | $74,000 | $93 | 56 |
| 4250 7th St | 0.44mi | 2/1.0 | 935 (+15%) | 0mo | $37,750 | $40 | 54 |
| 4228 11th St | 0.66mi | 2/1.0 | 792 (-3%) | 16mo | $60,000 | $76 | 51 |
| 28 E Alexis Ave | 0.48mi | 3/1.0 (+1) | 928 (+14%) | 0mo | $65,000 | $70 | 49 |
| 15 W Alexis St | 0.51mi | 3/1.0 (+1) | 900 (+11%) | 18mo | $111,000 | $123 | 39 |
Match score weights: distance 35% · size 25% · config 20% · recency 20%. Top-matched comps best support the ARV.
Projected returns pro-forma
10.0% appreciation · 3.0% rent growth · sell at horizon
- IRR
- 67.7%
- Equity multiple
- 5.85×
- Total profit
- $62,908
- Equity at exit
- $41,711
- IRR
- 61.3%
- Equity multiple
- 13.01×
- Total profit
- $155,649
- Equity at exit
- $89,951
Cash invested: $12,964 (down + closing). Projections, not guarantees.
Landlord ↔ Tenant lean methodology
- Overall (STATE)
- 62 Landlord-Friendly
- State Michigan
- 62 Landlord-Friendly · EVEN
- County
- — inherits STATE
- City
- — inherits STATE
ZIP-level market 48229
- Home prices YoY
- 33.9%
- Active inventory
- 56
- Price-to-rent
- 3.4×
Monthly cashflow live
- Estimated rent
- $1,144 high interval (Pro) →
- Mortgage (P&I)
- −$243
- Tax from tax record
- −$50 /mo · $600/yr
- Insurance
- −$19
- HOA
- −$0
- Vacancy / Maint / Mgmt
- −$240
- Net cashflow
- $592
Break-even live
UW: 25.0% down · 7.5% · 30yr · 1.5% tax · 5.0% vac · 8.0% maint · 8.0% mgmt
Financing live
Cash to close
- Down payment
- $11,575
- Closing costs
- $1,389
- Reserves months
- —
- Total cash needed
- —
Loan-product check · same deal, 3 products live
Conventional
25% down · 7.5% · 30yr
- Down + closing
- —
- Monthly P&I
- —
- Monthly cashflow
- —
- DSCR
- —
- Eligible?
- —
Personal DTI + credit; lowest rate.
DSCR
20% down · 8.5% · 30yr
- Down + closing
- —
- Monthly P&I
- —
- Monthly cashflow
- —
- DSCR
- —
- Eligible?
- —
No personal income docs; deal must DSCR.
Hard money
10% down · 12.0% · 12mo
- Down + closing
- —
- Monthly P&I
- —
- Monthly cashflow
- —
- DSCR
- —
- Eligible?
- —
Short-term bridge; refi at stabilization.
Rent comps 22 comps
| Address | Beds | Baths | Sqft | Rent | $/sqft | DOM | Units | Dist |
|---|---|---|---|---|---|---|---|---|
| 4435 High St Ecorse, MI | 2.0 | 1.0 | 792 | $1,095 | $1.38 | 4d | 1 | 0.27mi |
| 4471 High St Unit 25-4 Ecorse, MI | 1.0 | 1.0 | 600 | $1,025 | $1.71 | 17d | 1 | 0.35mi |
| 4471 High St Unit 71-7 Ecorse, MI | 2.0 | 1.0 | 700 | $1,150 | $1.64 | 24d | 1 | 0.35mi |
| 4471 High St Unit 81-13 Ecorse, MI | 2.0 | 1.0 | 700 | $1,050 | $1.50 | 24d | 1 | 0.35mi |
| 25 Le Blanc St Unit 4 Ecorse, MI | 1.0 | 1.0 | 650 | $1,025 | $1.58 | 17d | 1 | 0.56mi |
| 4581 High St Unit 13 Ecorse, MI | 2.0 | 1.0 | 700 | $1,050 | $1.50 | 24d | 1 | 0.56mi |
| 4573 3rd St Ecorse, MI | 2.0 | 1.0 | 1000 | $1,300 | $1.30 | 14d | 1 | 0.60mi |
| 1581 Empire Ave Lincoln Park, MI | 2.0 | 1.0 | 900 | $1,350 | $1.50 | 24d | 1 | 1.06mi |
| 1583 Empire Ave Lincoln Park, MI | 1.0 | 1.0 | 700 | $1,050 | $1.50 | 24d | 1 | 1.06mi |
| 800 Montie Rd Apt 12 Lincoln Park, MI | 1.0 | 1.0 | 700 | $1,000 | $1.43 | 24d | 1 | 1.08mi |
| 3748 15th St Ecorse, MI | 2.0 | 1.0 | 528 | $1,099 | $2.08 | 16d | 1 | 1.14mi |
| 177 N Riverbank St Wyandotte, MI | 2.0 | 1.0 | 671 | $1,600 | $2.38 | 1d | 1 | 1.14mi |
| 3575 S Ethel St Detroit, MI | 3.0 | 1.0 | 894 | $1,350 | $1.51 | 17d | 1 | 1.18mi |
| 88 Hill St Unit 2 River Rouge, MI | 1.0 | 1.0 | 700 | $800 | $1.14 | 24d | 1 | 1.24mi |
| 146 Bondie St Wyandotte, MI | 2.0 | 1.0 | 820 | $1,650 | $2.01 | 1d | 1 | 1.26mi |
| 1563 Wilson Ave Lincoln Park, MI | 1.0 | 1.0 | 750 | $895 | $1.19 | 4d | 1 | 1.26mi |
| 168 Bondie St Wyandotte, MI | 3.0 | 1.0 | 1080 | $1,295 | $1.20 | 4d | 1 | 1.27mi |
| 170 Bondie St Wyandotte, MI | 3.0 | 1.0 | 1080 | $1,399 | $1.30 | 2d | 1 | 1.27mi |
| 424 4th St Wyandotte, MI | 2.0 | 1.0 | 925 | $1,350 | $1.46 | 24d | 1 | 1.30mi |
| 708 Highland St Unit 1 Wyandotte, MI | 2.0 | 1.0 | 800 | $950 | $1.19 | 17d | 1 | 1.35mi |
| 850 Biddle Ave Unit 2 Wyandotte, MI | 2.0 | 1.0 | 800 | $1,300 | $1.62 | 4d | 1 | 1.45mi |
| 1537 Chandler Ave Lincoln Park, MI | 2.0 | 1.0 | 725 | $1,100 | $1.52 | 17d | 1 | 1.46mi |
Listing history 27 events
-
2026-06-18days on market $46,300 Active 105 DOM
-
2026-06-17days on market $46,300 Active 104 DOM
-
2026-06-16days on market $46,300 Active 103 DOM
-
2026-06-15days on market $46,300 Active 102 DOM
-
2026-06-13days on market $46,300 Active 100 DOM
-
2026-06-09days on market $46,300 Active 96 DOM
-
2026-06-08days on market $46,300 Active 95 DOM
-
2026-06-07days on market $46,300 Active 94 DOM
-
2026-06-04days on market $46,300 Active 91 DOM
-
2026-06-03days on market $46,300 Active 90 DOM
-
2026-06-02days on market $46,300 Active 89 DOM
-
2026-06-01days on market $46,300 Active 88 DOM
-
2026-05-31days on market $46,300 Active 87 DOM
-
2026-03-04$46,300 Active 591-char remark
Show marketing remark (591 chars)
This two bedroom, one bathroom home is situated on two lots. Near parks and neighborhood amenities, great location. Reserve Auction – NO ACCESS OR VIEWINGS of this property. "As is" sale with no contingencies or inspections. Seller cannot guarantee occupancy. Buyer will be responsible for obtaining possession of the property upon closing. * * * SPECIAL NOTES: (1) This is a CASH ONLY transaction. (2) Seller to pay Taxes, HOA, and Municipal/Utility Liens. (3) Please read the Auction disclaimers carefully before placing a bid or submitting an offer. * * *
-
2026-03-04$46,300 Active
Show marketing remark (591 chars)
This two bedroom, one bathroom home is situated on two lots. Near parks and neighborhood amenities, great location. Reserve Auction – NO ACCESS OR VIEWINGS of this property. "As is" sale with no contingencies or inspections. Seller cannot guarantee occupancy. Buyer will be responsible for obtaining possession of the property upon closing. * * * SPECIAL NOTES: (1) This is a CASH ONLY transaction. (2) Seller to pay Taxes, HOA, and Municipal/Utility Liens. (3) Please read the Auction disclaimers carefully before placing a bid or submitting an offer. * * *
-
2025-12-17soldstatus $42,090
-
2018-11-09soldstatus $45,000 112-char remark
Show marketing remark (112 chars)
2 BEDROOM HOME ON A QUIET ONE-WAY STREET. NOT 1 BUT 2 SHEDS AND A COVERED CARPORT. DOUBLE LOT WITH NEWER WINDOWS
-
2018-11-09soldstatus $45,000 Closed
Show marketing remark (112 chars)
2 BEDROOM HOME ON A QUIET ONE-WAY STREET. NOT 1 BUT 2 SHEDS AND A COVERED CARPORT. DOUBLE LOT WITH NEWER WINDOWS
-
2018-11-05soldstatus $45,000
-
2018-07-09status Pending
-
2018-07-05$49,000 112-char remark
Show marketing remark (112 chars)
2 BEDROOM HOME ON A QUIET ONE-WAY STREET. NOT 1 BUT 2 SHEDS AND A COVERED CARPORT. DOUBLE LOT WITH NEWER WINDOWS
-
2018-07-05$49,000 Active
Show marketing remark (112 chars)
2 BEDROOM HOME ON A QUIET ONE-WAY STREET. NOT 1 BUT 2 SHEDS AND A COVERED CARPORT. DOUBLE LOT WITH NEWER WINDOWS
-
2007-03-28historical
-
2007-01-22historical
-
2006-12-19$64,900
-
2006-11-28$64,900
-
2006-11-28$64,900
ⓘ Source: listings_history table (triggers on properties + properties_extension) + one-shot
backfill from property_details.listing_events for pre-trigger history.
Tax reassessment forecast MI · Partial reset (capped growth)
- Current annual tax
- $600 · $50/mo
- Projected year-2 tax
- $656 · $55/mo
- Expected delta
- +$57/yr (+$5/mo · 9.5%)
ⓘ Screening estimate from a state-policy table — verify with the county assessor before closing.
Climate risk First Street
- Flood 3/10 Moderate FEMA zone X (unshaded) · 20% chance over 30 yrs
- Wildfire 1/10 Low
- Heat 3/10 Moderate 7 d/yr ≥97°F today · 16 d/yr by 30 yrs out
- Wind 2/10 Low
- Air quality 4/10 Moderate 6 unhealthy d/yr today · 6 by 30 yrs out
Nearby sold comps map
Loading sold comps map…
Walkable amenities ~0.75 mi
Loading nearby amenities…
Taxation est. · year 1
- Rental income
- $13,727
- − Mortgage interest
- −$2,594
- − Property taxes
- −$600
- − Insurance
- −$232
- − Repairs & maintenance
- −$1,098
- − Management
- −$1,098
- − Depreciation
- −$1,347
- Taxable income
- $6,759
- Est. tax owed @ 24.0%
- −$1,622
- After-tax cash flow
- $5,477/yr
For passive investors: Depreciation is non-cash, so a rental often shows a tax loss while cash-flowing — sheltering income. Rental losses are passive: they offset passive income freely, and up to $25,000/yr can offset ordinary (W-2) income if you actively participate and your MAGI is under $100k (phasing out to $0 by $150k); unused losses carry forward. On sale, claimed depreciation is recaptured at up to 25%, and gains may owe capital-gains tax (a 1031 exchange can defer both). Figures are a year-1 estimate at your 24.0% rate — not tax advice; consult a CPA.
Schools (NCES district)
- District
- Ecorse Public Schools
- NCES district ID
- 2612930
- Math proficiency
- 3% ▼ -4.00%
- Reading proficiency
- 7% ▼ -6.00%
- Median HH income
- $28,957
- Composite
- 3.46/100
- National rank
- #10075
- State rank
- #536 of 540 in MI
Livability — Ecorse
- Score
- 69/100
- State rank
- #348
- US rank
- #8880
Category grades
Schools grade is shown separately in the Schools card above.
Census & demographics
- Census place
- Ecorse, MI
- City population
- 9,166
- Population (ZIP)
- 9,166
Population outlook (Wayne County) Hauer SSP2
- Today (2025)
- 1,675,273 people
- By 2030
- 1,620,300 · -3.3%
- By 2040
- 1,502,341 · -10.3%
- By 2050
- 1,384,039 · -17.4%
- By 2075
- 1,124,592 · -32.9%
- By 2100
- 881,193 · -47.4%
Race, ethnicity, and origin ACS 2023
- Neighborhood character
- Diverse neighborhood (Simpson 0.69)
- Race & ethnicity
- Black 45% White 26% Hispanic / Latino 21% Two or more races 15% Native American 4%
- Hispanic origin (detail)
- Mexican 18% Puerto Rican 1%
- Common ancestry
- Lithuanian 3% Romanian 2% Slovak 1%
- Foreign-born
- 4% · Canada, Guatemala, Jamaica
- Languages at home
- 86% English-only · Spanish 13%
Political lean MEDSL · Wayne
- 2024 margin
- Strong D (+29.0) · D 62.7% · R 33.7% · Other 3.6%
- 2008→2024 swing
- -20.5pp toward R · 2008: 49.5pp · 2024: 29.0pp
- All cycles
- 2024: D+29.0 2020: D+38.1 2016: D+37.3 2012: D+46.9 2008: D+49.5
Not yet ingested
- Civics
- —
Market trends
- HPI YoY
- ▲ 102.51%
- Current HPI
- 404.5927
- Rent YoY
- —
- Metro
- —
- State GDP YoY
- ▲ 1.37%
- F500 in state
- 28
Industry mix (Fortune 500 HQ in MI)
| Industry | F500 HQs | Revenue |
|---|---|---|
| Automotive Parts | 3 | $48B |
|
||
| Automotive | 2 | $372B |
|
||
| Chemicals | 1 | $45B |
|
||
| Automotive Retail | 1 | $29B |
|
||
| Healthcare / Medical Devices | 1 | $23B |
|
||
| Automotive Technology | 1 | $20B |
|
||
Price history
-28.7% since first listed14 events — show timeline
- 2026-03-04 Listed $46,300 REALCOMP
- 2026-03-04 Listed $46,300 MiRealSource-MiMLS
- 2025-12-17 Sold (Public Records) $42,090 Public Records
- 2018-11-09 Sold (MLS) $45,000 MiRealSource-MiMLS
- 2018-11-09 Sold (MLS) $45,000 REALCOMP
- 2018-11-05 Sold (Public Records) $45,000 Public Records
- 2018-07-09 Pending — MiRealSource-MiMLS
- 2018-07-05 Listed $49,000 MiRealSource-MiMLS
- 2018-07-05 Listed $49,000 REALCOMP
- 2007-03-28 Listing Removed — MiRealSource-MiMLS
- 2007-01-22 Listing Removed — REALCOMP
- 2006-12-19 Listed $64,900 REALCOMP
- 2006-11-28 Listed $64,900 REALCOMP
- 2006-11-28 Listed $64,900 MiRealSource-MiMLS
Property tax history
-4.7%/yrLatest (2025): $600 · -38.9% YoY. Source: county tax records.
Cash-flow waterfall
monthlySold comps — $/sqft
last 12 mo · ≤1 miLoading sold comps…