225 W 25th St Unit 5K · New York, NY
Flood risk 1/10 · Minimal
- FEMA flood zone
- X (unshaded)
- Chance of flooding over 30 yrs
- 0.0%
- Est. flood insurance / yr
- $507 – $1,088
Fire risk 1/10 · Minimal
- Est. fire insurance / yr
- $691 – $1,283
Heat risk 6/10 · Moderate
- Hot days now (above 99°F)
- 7 days/yr
- Hot days in 30 yrs
- 15 days/yr
Wind risk 6/10 · Moderate
- Chance of severe wind over 30 yrs
- 27.0%
Air-quality risk 4/10 · Minor
- Unhealthy air days now
- 5 days/yr
- Unhealthy air days in 30 yrs
- 7 days/yr
Risk factors via First Street. Map © Google.
Why this score? — see what drove the C grade
The composite is a weighted blend of 9 inputs, each scored 0–100. Each bar is that input's sub-score; the figure is the points it added to the 100-point composite (weight × sub-score).
- Cash flow +16.0/30.0
- ARV discount +7.5/15.0
- Appreciation +7.3/10.0
- Schools +5.0/10.0
- DSCR +4.9/10.0
- 1% rule +4.4/10.0
- Condition / age +4.0/5.0
- Livability +3.8/5.0
- Rent growth +3.6/5.0
$849,000
🖨 Deal sheet 📄 Offer letter ✓ Due diligence
Listing remarks
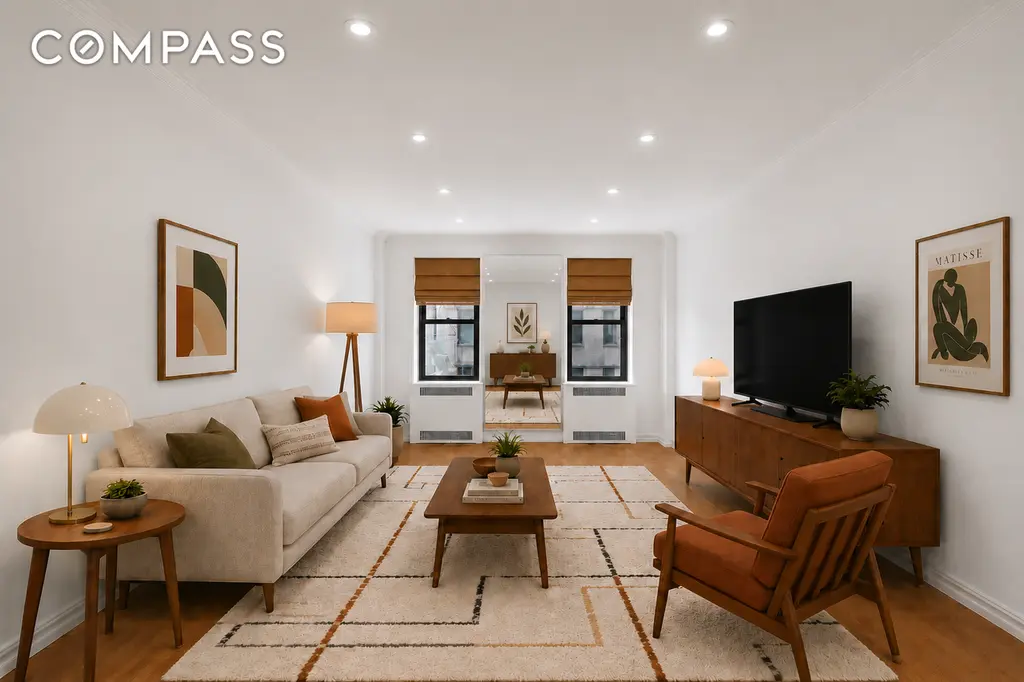
There's a moment every buyer describes the same way: walking into a place and just knowing. Residence 5K at 225 West 25th Street is that kind of apartment. Set on the fifth floor of a well-maintained Chelsea cooperative, this one-bedroom, one-bath residence offers 750 square feet of thoughtfully designed living space — the kind that makes every square foot count. A gracious entry foyer welcomes you in and immediately sets this apart from the typical Manhattan layout, flowing into a sunken living room that is as distinctive as it is inviting. It's the architectural detail that makes guests ask questions and makes you glad every single day that you own it. Rich hardwood floors and reces
Key facts
- Galley kitchen
- Sunken living room
- Windowed bathroom
Tags
Property features AI
Finance
- Other: Part of a 68-unit building
- HOA & community: Monthly association fee of $1,768; Building allows pets — cats and dogs ok
Exterior
- Home design: 6-story building; Entry on level 5
- Exterior features: Building courtyard; Building garden; Building roof deck; East and north exposures; Has a view
Interior
- Kitchen: Dishwasher; Range; Refrigerator
- Bedrooms: 3 rooms total (includes bedrooms and living areas)
- Flooring: Ceramic tile; Hardwood
- Bathrooms: 1 full bathroom
- Heating & cooling: Wall unit cooling
- Interior features: Double-pane windows; Unfurnished
- Laundry & utility: Common on-floor laundry; Common area laundry room
Neighborhood map
What this means for you Summary
Snapshot
- This is a 1-bed/1.0-bath condo listed at $849k. Condition is rated good.
Deal economics
- At list price, monthly cash flow is $416 ($5k/yr) — positive.
- The deal already cash-flows at list — no discount required.
- To meet the 1% rule (rent ≥ 1% of price), the offer needs to be $795k (6.3% below list).
- Recommended offer: $795k (6.3% below list) — sets the bar for 1% rule.
- Cap rate 6.9% vs local median 2.6% in New York — top-decile yield for the area; either an underpriced asset or a hidden risk that comps aren't pricing in. Stress-test before assuming the spread holds.
Location & tenants
- Location reads 75/100 on livability (#268 in NY, #4,188 nationally) — a middle-class / working-renter tenant base. Strengths: amenities A+, commute A+, health & safety A; Watch: crime F, cost of living F.
- Market conditions: Rents rising fast (+4.6%/yr); 133 active listings in the ZIP; 40 comparable units currently listed for rent nearby; rentals leasing fast (median 8d on market — plan ~1-2 weeks tenant-placement turnaround); high-income renter base; 4,467 units permitted in New York County in 2024 (4,463 in 5+ unit buildings).
- At $7,954/mo this rent would consume 74% of the median local household income ($130k/yr) (locally 2137% of renters already pay >50% of income on rent) — very limited rent-growth headroom before tenants either downsize or default.
Forward outlook
- In year one you build about $46k of equity ($6k loan paydown + $40k appreciation (4.7% local appreciation)).
- New York County population projected at +21% by 2050 — long-run rental-demand tailwind backs the buy-and-hold thesis.
- At projected returns (4.7% appreciation + 4.6% rent growth), your $238k cash investment doubles in ~5 years — after that, you're playing with house money.
- By year 2, paydown + projected appreciation supports a ~$73k cash-out refi (75% LTV) — recoverable capital for the next deal without selling this one.
Negotiation context
- It's been on market 17 days — a 2% lower offer ($836k) is reasonable based on typical stale-listing flexibility.
Risks & watch-outs
- Watch-outs: built in 1939 — expect roof / HVAC / electrical / plumbing capex.
- Climate carrying-cost: major wind risk, 27% chance of damaging wind over 30y; extreme-heat days projected 7→15/yr by 2055 (HVAC capex compounding) — expect insurance premiums to compound above CPI over the hold.
Questions for the listing agent
- Built in 1939 — when were the roof, HVAC, electrical panel, plumbing, and water heater last replaced?
- Any open or pending special assessments — roof, HVAC, plumbing, elevator, façade? What's the per-unit balance and payoff schedule, and is the seller paying it off at close or rolling it to the buyer?
- Is there a deadline driving the sale (1031 exchange, divorce, estate, relocation)? That informs how much negotiation room exists.
- Schools are B-rated — typically a magnet for longer-tenancy family renters. What's the average tenant stay here, and is there a school-zone premium baked into asking?
- Crime grade is F in this area — have there been break-ins, vandalism, or insurance claims at this property in the last 3 years? What carrier currently insures it and at what premium?
- What's the average days-on-market for RENTAL listings here right now (not sales)? A rising rental-DOM trend means longer vacancies and softer asking-rent achievability than the comps imply.
- What's the recent tenant-quality profile in this submarket — average credit score on applications, eviction rate, late-payment / NSF rate, and stable-employment percentage? A property-management company in the area should have these aggregated.
- How much new apartment / multifamily construction is in the pipeline within 1–3 miles? Heavy new supply (>2% of stock underway) typically softens rents 12–24 months out; light construction supports rent growth.
Investment metrics
- 1% rule
- 0.94% ✗
- Cap rate
- 6.88%
- Cash-on-cash
- 2.10%
- DSCR
- 1.09
- GRM
- 8.9
CMA / ARV
No comps found within radius.
Projected returns pro-forma
4.7% appreciation · 4.59% rent growth · sell at horizon
- IRR
- 14.7%
- Equity multiple
- 1.93×
- Total profit
- $220,644
- Equity at exit
- $465,588
- IRR
- 16.1%
- Equity multiple
- 3.85×
- Total profit
- $678,594
- Equity at exit
- $790,987
Cash invested: $237,720 (down + closing). Projections, not guarantees.
Landlord ↔ Tenant lean methodology
- Overall (CITY)
- 0 Strongly Tenant-Friendly
- State New York
- 15 Strongly Tenant-Friendly · D+10
- County
- — inherits STATE
- City New York
- 0 Strongly Tenant-Friendly · D+34
ZIP-level market 10001
- Home prices YoY
- 2.4%
- Rents YoY
- 4.6%
- Active inventory
- 133
- Price-to-rent
- 8.9×
Monthly cashflow live
- Estimated rent
- $7,954 high interval (Pro) →
- Mortgage (P&I)
- −$4,452
- Tax est. 1.5%
- −$1,061 /mo · $12,735/yr
- Insurance
- −$354
- HOA
- −$0
- Vacancy / Maint / Mgmt
- −$1,670
- Net cashflow
- $416
Break-even live
UW: 25.0% down · 7.5% · 30yr · 1.5% tax · 5.0% vac · 8.0% maint · 8.0% mgmt
Financing live
Cash to close
- Down payment
- $212,250
- Closing costs
- $25,470
- Reserves months
- —
- Total cash needed
- —
Loan-product check · same deal, 3 products live
Conventional
25% down · 7.5% · 30yr
- Down + closing
- —
- Monthly P&I
- —
- Monthly cashflow
- —
- DSCR
- —
- Eligible?
- —
Personal DTI + credit; lowest rate.
DSCR
20% down · 8.5% · 30yr
- Down + closing
- —
- Monthly P&I
- —
- Monthly cashflow
- —
- DSCR
- —
- Eligible?
- —
No personal income docs; deal must DSCR.
Hard money
10% down · 12.0% · 12mo
- Down + closing
- —
- Monthly P&I
- —
- Monthly cashflow
- —
- DSCR
- —
- Eligible?
- —
Short-term bridge; refi at stabilization.
Rent comps 40 comps
| Address | Beds | Baths | Sqft | Rent | $/sqft | DOM | Units | Dist |
|---|---|---|---|---|---|---|---|---|
| 160 W 24th St New York, NY | 2.0 | 1.0–2.0 | 731 | $7,896 | $10.79 | 1d | 12 | 0.11mi |
| 244 W 29th St Unit 2149 New York, NY | 1.0 | 1.0 | 490 | $9,720 | $19.84 | 6d | 2 | 0.16mi |
| 243 W 28th St #2143 New York, NY | 1.0 | 1.0 | 580 | $8,960 | $15.45 | 18d | 1 | 0.17mi |
| 120 W 23rd St #693 New York, NY | 2.0 | 2.0 | 900 | $10,140 | $11.27 | 20d | 1 | 0.24mi |
| 117 W 28th St #1467 New York, NY | 1.0 | 2.0 | 1000 | $8,760 | $8.76 | 24d | 1 | 0.25mi |
| 776 6th Ave New York, NY | 2.0 | 1.0–2.0 | 756 | $7,743 | $10.24 | 1d | 18 | 0.26mi |
| 180 W 20th St #1202 New York, NY | 2.0 | 1.0–2.0 | 791 | $9,505 | $12.01 | 1d | 3 | 0.29mi |
| 120 W 21st St New York, NY | 2.0 | 1.0–2.0 | 676 | $7,070 | $10.46 | 4d | 14 | 0.29mi |
| 43 W 27th St #1055 New York, NY | 2.0 | 1.0 | 740 | $9,940 | $13.43 | 24d | 1 | 0.33mi |
| 435 W 31st St New York, NY | 1.0 | 1.0 | 633 | $13,963 | $22.04 | 6d | 27 | 0.45mi |
| 241 5th Ave Unit 11A New York, NY | 2.0 | 2.0 | 991 | $8,995 | $9.08 | 24d | 1 | 0.48mi |
| 360 W 34th St New York, NY | 2.0 | 1.0–1.5 | 632 | $6,100 | $9.65 | 7d | 3 | 0.48mi |
| 535 W 23rd St #1584 New York, NY | 2.0 | 1.0–2.0 | 625 | $8,330 | $13.33 | 3d | 3 | 0.51mi |
| 101 W 15th St New York, NY | 1.0 | 1.0 | 562 | $9,550 | $16.98 | 1d | 2 | 0.52mi |
| 10 E 29th St New York, NY | 1.0–3.0 | 1.0–3.0 | 1323 | $6,283 | $4.75 | 1d | 4 | 0.52mi |
| 130 W 15th St #1383 New York, NY | 1.0–2.0 | 1.0–2.0 | 844 | $9,200 | $10.90 | 1d | 2 | 0.53mi |
| 525 W 28th St New York, NY | 2.0 | 1.0–2.0 | 1116 | $6,612 | $5.92 | 7d | 1 | 0.54mi |
| 108 W 15th St #205 New York, NY | 1.0–2.0 | 1.0 | 697 | $6,050 | $8.67 | 3d | 2 | 0.54mi |
| 309 5th Ave New York, NY | 1.0 | 1.0 | 597 | $7,596 | $12.72 | 7d | 13 | 0.56mi |
| 540 6th Ave Unit 6A New York, NY | 1.0 | 1.0 | 793 | $8,450 | $10.66 | 7d | 1 | 0.58mi |
| 500 W 18th St Unit 10D New York, NY | 1.0 | 1.0 | 957 | $10,750 | $11.23 | 10d | 1 | 0.60mi |
| 500 W 18th St Unit EAST_16C New York, NY | 1.0 | 1.5 | 921 | $14,500 | $15.74 | 1d | 1 | 0.60mi |
| 121 Madison Ave New York, NY | 2.0–4.0 | 1.0–2.0 | 1012 | $7,295 | $7.20 | 7d | 3 | 0.61mi |
| 282 11th Ave New York, NY | 2.0 | 1.0–2.0 | 960 | $7,858 | $8.18 | 1d | 1 | 0.64mi |
| 15 Hudson Yards Unit 26B New York, NY | 1.0 | 1.0 | 847 | $9,700 | $11.45 | 24d | 1 | 0.66mi |
| 290 W 12th St #1592 New York, NY | 1.0–2.0 | 1.0–2.0 | 515 | $7,110 | $13.81 | 7d | 2 | 0.74mi |
| 30 Park Ave #1347 New York, NY | 2.0 | 1.0 | 950 | $7,890 | $8.31 | 1d | 3 | 0.81mi |
| 290 3rd Ave #279 New York, NY | 1.0 | 1.0 | 607 | $9,740 | $16.03 | 3d | 2 | 0.82mi |
| 141 E 33rd St #1278 New York, NY | 2.0 | 1.0–1.5 | 683 | $6,230 | $9.12 | 7d | 3 | 0.85mi |
| 155 E 31st St #2190 New York, NY | 1.0–2.0 | 1.0–1.5 | 725 | $5,610 | $7.74 | 7d | 2 | 0.85mi |
| 41 Park Ave New York, NY | 2.0 | 1.0–2.0 | 815 | $6,555 | $8.04 | 7d | 3 | 0.86mi |
| 87 Perry St New York, NY | 2.0 | 2.0 | 748 | $18,500 | $24.73 | 24d | 1 | 0.86mi |
| 555 10th Ave Unit 1018807P New York, NY | 1.0 | 1.0 | 688 | $9,726 | $14.14 | 21d | 1 | 0.87mi |
| 1 Union Sq S #1174 New York, NY | 2.0 | 1.0–2.0 | 775 | $10,120 | $13.06 | 10d | 3 | 0.88mi |
| 302 W 11th St #990 New York, NY | 2.0–3.0 | 1.0–2.0 | 1050 | $8,360 | $7.96 | 3d | 2 | 0.89mi |
| 450 W 42nd St #1693 New York, NY | 2.0 | 1.0–2.0 | 690 | $9,110 | $13.20 | 1d | 3 | 0.90mi |
| 3 E 9th St Unit 1541442P New York, NY | 1.0–2.0 | 1.0 | 1119 | $11,796 | $10.54 | 5d | 2 | 0.91mi |
| 561 10th Ave #2085 New York, NY | 2.0 | 1.0–2.0 | 795 | $6,345 | $7.98 | 7d | 2 | 0.91mi |
| 10 5th Ave Unit 1255906P New York, NY | 2.0 | 1.0 | 990 | $12,196 | $12.32 | 5d | 2 | 0.93mi |
| 10 Sheridan Sq #949 New York, NY | 2.0 | 2.0 | 1000 | $12,050 | $12.05 | 20d | 1 | 0.93mi |
HOA detail condo
- Monthly dues
- $0 · $0/yr
- Assessments
- None detected in remarks — confirm with the listing agent.
Listing history 13 events
-
2026-06-18days on market $849,000 Active 17 DOM
-
2026-06-17remarks 693-char remark
-
2026-06-17days on market $849,000 Active 16 DOM
-
2026-06-16days on market $849,000 Active 15 DOM
-
2026-06-15days on market $849,000 Active 14 DOM
-
2026-06-13days on market $849,000 Active 12 DOM
-
2026-06-09days on market $849,000 Active 8 DOM
-
2026-06-08days on market $849,000 Active 7 DOM
-
2026-06-08days on market $849,000 Active 6 DOM
-
2026-06-04days on market $849,000 Active 3 DOM
-
2026-06-03days on market $849,000 Active 2 DOM
-
2026-06-02days on market $849,000 Active 1 DOM
-
2026-06-01days on market $849,000 Active 2 DOM
ⓘ Source: listings_history table (triggers on properties + properties_extension) + one-shot
backfill from property_details.listing_events for pre-trigger history.
Climate risk First Street
- Flood 1/10 Low FEMA zone X (unshaded) · 0% chance over 30 yrs
- Wildfire 1/10 Low
- Heat 6/10 Major 7 d/yr ≥99°F today · 15 d/yr by 30 yrs out
- Wind 6/10 Major 27% chance of damaging wind over 30 yrs
- Air quality 4/10 Moderate 5 unhealthy d/yr today · 7 by 30 yrs out
Nearby sold comps map
Loading sold comps map…
Walkable amenities ~0.75 mi
Loading nearby amenities…
Taxation est. · year 1
- Rental income
- $95,446
- − Mortgage interest
- −$47,557
- − Property taxes
- −$12,735
- − Insurance
- −$4,245
- − Repairs & maintenance
- −$7,636
- − Management
- −$7,636
- − Depreciation
- −$24,698
- Taxable loss
- −$9,061
- Est. tax savings @ 24.0%
- +$2,175
- After-tax cash flow
- $7,170/yr
For passive investors: Depreciation is non-cash, so a rental often shows a tax loss while cash-flowing — sheltering income. Rental losses are passive: they offset passive income freely, and up to $25,000/yr can offset ordinary (W-2) income if you actively participate and your MAGI is under $100k (phasing out to $0 by $150k); unused losses carry forward. On sale, claimed depreciation is recaptured at up to 25%, and gains may owe capital-gains tax (a 1031 exchange can defer both). Figures are a year-1 estimate at your 24.0% rate — not tax advice; consult a CPA.
Condition & rehab AI · 1 photo
This beautifully appointed one-bedroom condo is in good condition with cosmetic updates, ready for a new owner.
Value-add opportunities
- Both Painting exterior — Enhances curb appeal and resale value
- Both Landscaping — Improves curb appeal and rental value
- Both New window treatments — Enhances natural light and aesthetic appeal
- Both New flooring in bathrooms — Improves aesthetics and functionality
Renovation cost estimate screening
Value-add ROI direction
- Both Painting exterior — Enhances curb appeal and resale value ↑
- Both Landscaping — Improves curb appeal and rental value ↑
- Both New window treatments — Enhances natural light and aesthetic appeal ↑
- Both New flooring in bathrooms — Improves aesthetics and functionality ↑
ⓘ Cost ranges are severity-bucket heuristics (US national rule-of-thumb). Get contractor quotes + a written scope before underwriting a rehab budget.
Schools (NCES district)
No district data.
Livability — New York
- Score
- 75/100
- State rank
- #268
- US rank
- #4188
Category grades
Schools grade is shown separately in the Schools card above.
Census & demographics
- Census place
- New York, NY
- County
- New York County · 1,599,927 people
- City population
- 7,731,280
- Metro
- New York-Newark-Jersey City, NY-NJ-PA
- Population (ZIP)
- 30,511
- Household income
- $129,852
- Rent vs Own
- Severe rent burden
- 2137.0
Population outlook (New York County) Hauer SSP2
- Today (2025)
- 1,825,725 people
- By 2030
- 1,904,611 · +4.3%
- By 2040
- 2,052,719 · +12.4%
- By 2050
- 2,206,601 · +20.9%
- By 2075
- 2,509,427 · +37.4%
- By 2100
- 2,702,933 · +48.0%
Race, ethnicity, and origin ACS 2023
- Neighborhood character
- Diverse neighborhood (Simpson 0.68)
- Race & ethnicity
- White 49% Hispanic / Latino 19% Asian 18% Two or more races 11% Black 10%
- Hispanic origin (detail)
- Mexican 1% Puerto Rican 6% Dominican 2%
- Common ancestry
- Romanian 4% Scotch-Irish 3% Lithuanian 2%
- Foreign-born
- 27% · Canada, China, South Korea
- Languages at home
- 72% English-only · Spanish 11% Chinese 6% Other Indo-European 2%
Political lean MEDSL · New York
- 2024 margin
- Solid D (+64.8) · D 82.4% · R 17.6%
- 2008→2024 swing
- -7.4pp toward R · 2008: 72.2pp · 2024: 64.8pp
- All cycles
- 2024: D+64.8 2020: D+74.5 2016: D+77.2 2012: D+69.6 2008: D+72.2
Not yet ingested
- Civics
- —
Market trends
- HPI YoY
- ▲ 4.70%
- Current HPI
- 202.5074
- Rent YoY
- ▲ 4.59%
- Metro
- New York-Newark-Jersey City, NY-NJ-PA
- State GDP YoY
- ▲ 2.60%
- F500 in state
- 92
Industry mix (Fortune 500 HQ in NY)
| Industry | F500 HQs | Revenue |
|---|---|---|
| Financial Services | 10 | $950B |
|
||
| Consumer Goods | 9 | $162B |
|
||
| Insurance | 4 | $225B |
|
||
| Telecommunications | 2 | $144B |
|
||
| Pharmaceuticals | 2 | $112B |
|
||
| Media / Entertainment | 2 | $69B |
|
||
Price history
1 event — show timeline
- 2026-03-07 Listed $849,000 RLS at REBNY
Cash-flow waterfall
monthlySold comps — $/sqft
last 12 mo · ≤1 miLoading sold comps…