 54-Plex
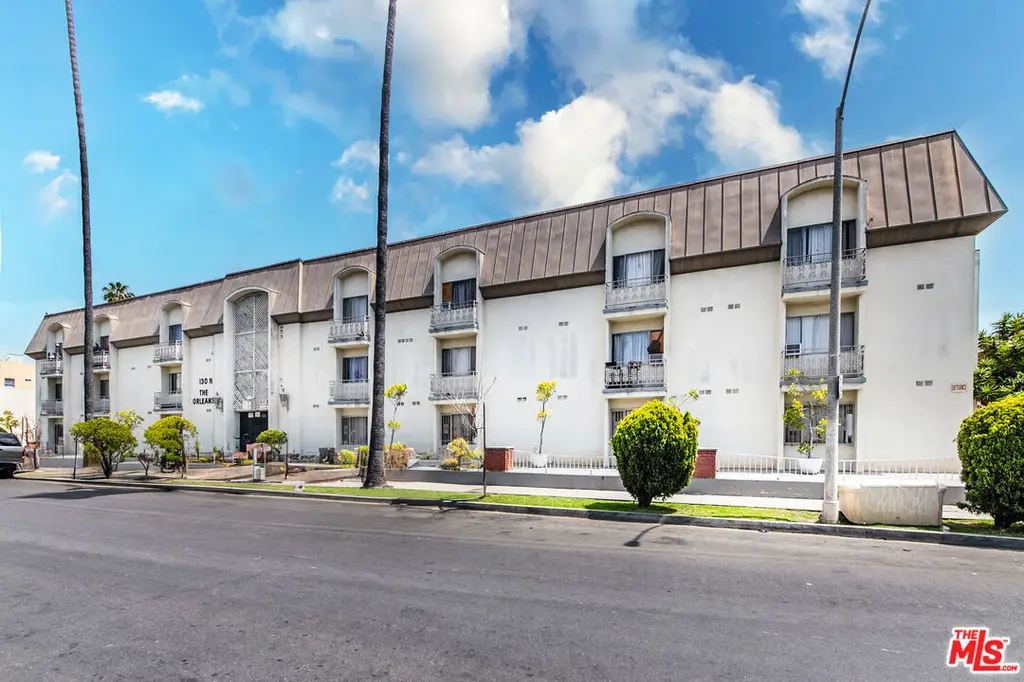
130 N Alexandria Ave · Los Angeles, CA
Flood risk 5/10 · Moderate
- FEMA flood zone
- X (unshaded)
- Chance of flooding over 30 yrs
- 0.24%
- Est. flood insurance / yr
- $507 – $1,088
Fire risk 1/10 · Minimal
- Est. fire insurance / yr
- $659 – $1,223
Heat risk 6/10 · Moderate
- Hot days now (above 92°F)
- 7 days/yr
- Hot days in 30 yrs
- 22 days/yr
Wind risk 1/10 · Minimal
- Chance of severe wind over 30 yrs
- —
Air-quality risk 5/10 · Moderate
- Unhealthy air days now
- 8 days/yr
- Unhealthy air days in 30 yrs
- 8 days/yr
Risk factors via First Street. Map © Google.
Why this score? — see what drove the D grade
The composite is a weighted blend of 9 inputs, each scored 0–100. Each bar is that input's sub-score; the figure is the points it added to the 100-point composite (weight × sub-score).
- Cash flow +15.1/30.0
- ARV discount +6.0/15.0
- DSCR +4.6/10.0
- 1% rule +4.2/10.0
- Condition / age +4.2/5.0
- Schools +3.6/10.0
- Livability +3.4/5.0
- Rent growth +2.1/5.0
- Appreciation +0.0/10.0
$10,500,000
🖨 Deal sheet (PDF) 📄 Offer letter ✓ Due diligence
Multi-family units
County records classify this as Multi-Family (5+ Unit). Listing-text estimate: 54 units. confirmed
5+ unit building — per-unit beds/baths from public records are typically unavailable; the breakdown below (if shown) is an estimate from the listing text.
Listing remarks
We are pleased to present The Orleans Apartments, a 54-unit investment opportunity in prime Koreatown just east of Normandie Ave and south of Beverly Blvd. The subject property features an ideal unit mix of 54 one-bedrooms with 57 subterranean parking spaces; four units will be delivered vacant at the close of escrow. This is a value-add opportunity with 21% rental upside achievable as units turn; units are well-maintained but can be enhanced to capture premium rents with a renovation program including luxury vinyl plank flooring, stainless steel appliances, custom cabinetry and countertops, smoothed ceilings and light fixtures, and HVAC; exterior upgrades could include paint and common are
Key facts
- Renovation program
- Rental upside
- 0.55 acre lot
Tags
Property features AI
Finance
- Other: One building on the parcel
- Financial info: Actual annual gross rent approximately $944,664; Actual gross annual income approximately $956,279; Gross operating income approximately $908,465; Net operating income approximately $499,918; Total annual expenses approximately $408,547; Cap rate about 4.76%; Gross rent multiplier about 10.98; Vacancy rate about 2%; Typical unit rent shown: $1,458 per month; projected unit rent listed at $99,900 annually (per unit projection); 54 like 1-bedroom units
- HOA & community: Total of 54 units in the complex
Exterior
- Parking: Subterranean parking; 57 total parking spaces
- Security: Security details not provided
- Utilities: Utility details not provided
- Home design: Residential income property; Three-story building
- Construction: Construction details not provided; Foundation/roof details not provided
- Exterior features: No other structures on the lot; Lot zoned LAR3
Interior
- Kitchen: Standard apartment kitchens (appliances not specified)
- Bedrooms: Predominantly 1-bedroom units (54 like units)
- Flooring: Flooring details not provided
- Bathrooms: Each 1-bedroom unit includes a full bath
- Heating & cooling: No central heating; No cooling
- Interior features: Apartments (multi-unit residential income property); Actual occupancy and rents documented
- Laundry & utility: Laundry/utility details not provided
Neighborhood map
What this means for you Summary
Snapshot
- This is a 54 × 1-bed/1-bath units multifamily listed at $10.50M. Condition is rated good.
Deal economics
- At list price, monthly cash flow is $3k ($42k/yr) — positive. Per door: $65/mo.
- The deal already cash-flows at list — no discount required.
- To meet the 1% rule (rent ≥ 1% of price), the offer needs to be $9.63M (8.3% below list).
- Recommended offer: $9.63M (8.3% below list) — sets the bar for 1% rule.
- Cap rate 6.7% vs local median 2.1% in Los Angeles — top-decile yield for the area; either an underpriced asset or a hidden risk that comps aren't pricing in. Stress-test before assuming the spread holds.
Location & tenants
- Location reads 68/100 on livability (#273 in CA) — a middle-class / working-renter tenant base. Strengths: amenities A+, commute A+, employment B; Watch: health & safety C-, crime F, cost of living F.
- Los Angeles Unified (urban): math 29% / reading 54% proficiency, ranked #223 of 517 in CA (top 43%) — families likely to look elsewhere, expect single-tenant / working-renter base with shorter leases; 67% free/reduced lunch — lower-income household profile, screen leases tightly.
- Zoned schools: Frank Del Olmo Elementary (509 students, 98% FRL); Virgil Middle (1,017 students, 97% FRL); Ramon C. Cortines School of Visual And Performing Arts (math 18% / reading 62%, grade F, #514 of 1,170 statewide, top 44%, 1,171 students, 69% FRL) — zoned schools average 88% FRL vs 67% district-wide (21 pts higher); higher-poverty schools than district average — tighter screening recommended.
- Market conditions: Rents soft (-1.7%/yr); 142 active listings in the ZIP; 19,697 units permitted in Los Angeles County in 2024 (9,426 in 5+ unit buildings).
- At $96,279/mo this rent would consume 1782% of the median local household income ($65k/yr) (locally 6512% of renters already pay >50% of income on rent) — very limited rent-growth headroom before tenants either downsize or default.
Forward outlook
- Local home prices are declining (-3.0%/yr); year-one equity from $73k of loan paydown is wiped out by about $315k of value loss. Plan a longer hold.
- Los Angeles County population projected at +9% by 2050 — modest demand growth; plan on rents tracking national, not racing it.
Negotiation context
- It's been on market 61 days — a 6% lower offer ($9.87M) is reasonable based on typical stale-listing flexibility.
- 3 sale attempts since 2y ago with the ask held roughly flat each time — persistent listings suggest the price (not the market) is what's stuck; bring a comps-based counter.
Risks & watch-outs
- Climate carrying-cost: moderate flood risk; extreme-heat days projected 7→22/yr by 2055 (HVAC capex compounding) — expect insurance premiums to compound above CPI over the hold.
Questions for the listing agent
- It's been on market 61 days. Have you received any prior offers? Is the seller open to a 8% concession, seller financing, or rate buy-down credit?
- Can we see the unit-by-unit rent roll, current vacancy, and any below-market leases? What's the average tenancy length?
- What capital expenditures (roof, boiler, parking lot, exteriors) have been made in the last 5 years, and what's planned in the next 2?
- Built in 1971 — when were the roof, HVAC, electrical panel, plumbing, and water heater last replaced?
- Why hasn't it sold? Are there any deal-killer items the seller is aware of (foundation, flood, title, zoning, code violations)?
- Is there a deadline driving the sale (1031 exchange, divorce, estate, relocation)? That informs how much negotiation room exists.
- Schools are D-rated, which usually means shorter tenancies and higher turnover. Who's the typical renter profile here, and what's been the actual vacancy rate?
- Crime grade is F in this area — have there been break-ins, vandalism, or insurance claims at this property in the last 3 years? What carrier currently insures it and at what premium?
- The area grade is low — what's the realistic commute time and amenity access for the typical tenant pool here? Any planned neighborhood developments (good or bad) we should know about?
- What's the average days-on-market for RENTAL listings here right now (not sales)? A rising rental-DOM trend means longer vacancies and softer asking-rent achievability than the comps imply.
- What's the recent tenant-quality profile in this submarket — average credit score on applications, eviction rate, late-payment / NSF rate, and stable-employment percentage? A property-management company in the area should have these aggregated.
- How much new apartment / multifamily construction is in the pipeline within 1–3 miles? Heavy new supply (>2% of stock underway) typically softens rents 12–24 months out; light construction supports rent growth.
Investment metrics
- 1% rule
- 0.92% ✗
- Cap rate
- 6.69%
- Cash-on-cash
- 1.43%
- DSCR
- 1.06
- GRM
- 9.1
CMA / ARV
- ARV (median comp)
- $10,166,342
- List price
- $10,500,000
- Delta
- 3.28%
- Verdict
- FAIR
- Comps
- 6 within 1.0 mi
Projected returns pro-forma
-3.0% appreciation · 0.0% rent growth · sell at horizon
- IRR
- -17.4%
- Equity multiple
- 0.40×
- Total profit
- $-1,759,411
- Equity at exit
- $1,565,584
- IRR
- -16.5%
- Equity multiple
- 0.21×
- Total profit
- $-2,329,767
- Equity at exit
- $907,848
Cash invested: $2,940,000 (down + closing). Projections, not guarantees.
Landlord ↔ Tenant lean methodology
- Overall (CITY)
- 0 Strongly Tenant-Friendly
- State California
- 18 Strongly Tenant-Friendly · D+13
- County
- — inherits STATE
- City Los Angeles
- 0 Strongly Tenant-Friendly · D+22
ZIP-level market 90004
- Rents YoY
- -1.7%
- Active inventory
- 142
- Price-to-rent
- 490.8×
Monthly cashflow live
- Estimated rent
- $96,279 high interval (Pro) →
- Mortgage (P&I)
- −$55,063
- Tax est. 1.5%
- −$13,125 /mo · $157,500/yr
- Insurance
- −$4,375
- HOA
- −$0
- Vacancy / Maint / Mgmt
- −$20,219
- Net cashflow
- $3,497
Break-even live
Sensitivity live
| Price | -10% $10,754 | -5% $7,125 | +0% $3,497 | +5% $-131 | +10% $-3,759 |
|---|---|---|---|---|---|
| Rent | -10% $-4,109 | -5% $-306 | +0% $3,497 | +5% $7,300 | +10% $11,103 |
| Rate | -1.0pp $8,785 | -0.5pp $6,168 | base $3,497 | +0.5pp $776 | +1.0pp $-1,992 |
54-unit breakdown (identical units grouped — click to expand)
| Units | Beds | Baths | Est. rent |
|---|---|---|---|
| 54× units | 1 | 1 | $96,282 |
| #1 | 1 | 1 | $1,783 |
| #2 | 1 | 1 | $1,783 |
| #3 | 1 | 1 | $1,783 |
| #4 | 1 | 1 | $1,783 |
| #5 | 1 | 1 | $1,783 |
| #6 | 1 | 1 | $1,783 |
| #7 | 1 | 1 | $1,783 |
| #8 | 1 | 1 | $1,783 |
| #9 | 1 | 1 | $1,783 |
| #10 | 1 | 1 | $1,783 |
| #11 | 1 | 1 | $1,783 |
| #12 | 1 | 1 | $1,783 |
| #13 | 1 | 1 | $1,783 |
| #14 | 1 | 1 | $1,783 |
| #15 | 1 | 1 | $1,783 |
| #16 | 1 | 1 | $1,783 |
| #17 | 1 | 1 | $1,783 |
| #18 | 1 | 1 | $1,783 |
| #19 | 1 | 1 | $1,783 |
| #20 | 1 | 1 | $1,783 |
| #21 | 1 | 1 | $1,783 |
| #22 | 1 | 1 | $1,783 |
| #23 | 1 | 1 | $1,783 |
| #24 | 1 | 1 | $1,783 |
| #25 | 1 | 1 | $1,783 |
| #26 | 1 | 1 | $1,783 |
| #27 | 1 | 1 | $1,783 |
| #28 | 1 | 1 | $1,783 |
| #29 | 1 | 1 | $1,783 |
| #30 | 1 | 1 | $1,783 |
| #31 | 1 | 1 | $1,783 |
| #32 | 1 | 1 | $1,783 |
| #33 | 1 | 1 | $1,783 |
| #34 | 1 | 1 | $1,783 |
| #35 | 1 | 1 | $1,783 |
| #36 | 1 | 1 | $1,783 |
| #37 | 1 | 1 | $1,783 |
| #38 | 1 | 1 | $1,783 |
| #39 | 1 | 1 | $1,783 |
| #40 | 1 | 1 | $1,783 |
| #41 | 1 | 1 | $1,783 |
| #42 | 1 | 1 | $1,783 |
| #43 | 1 | 1 | $1,783 |
| #44 | 1 | 1 | $1,783 |
| #45 | 1 | 1 | $1,783 |
| #46 | 1 | 1 | $1,783 |
| #47 | 1 | 1 | $1,783 |
| #48 | 1 | 1 | $1,783 |
| #49 | 1 | 1 | $1,783 |
| #50 | 1 | 1 | $1,783 |
| #51 | 1 | 1 | $1,783 |
| #52 | 1 | 1 | $1,783 |
| #53 | 1 | 1 | $1,783 |
| #54 | 1 | 1 | $1,783 |
| Total (54 units) | $96,279 | ||
UW: 25.0% down · 7.5% · 30yr · 1.5% tax · 5.0% vac · 8.0% maint · 8.0% mgmt
Financing live
Cash to close
- Down payment
- $2,625,000
- Closing costs
- $315,000
- Reserves months
- —
- Total cash needed
- —
Loan-product check · same deal, 3 products live
Conventional
25% down · 7.5% · 30yr
- Down + closing
- —
- Monthly P&I
- —
- Monthly cashflow
- —
- DSCR
- —
- Eligible?
- —
Personal DTI + credit; lowest rate.
DSCR
20% down · 8.5% · 30yr
- Down + closing
- —
- Monthly P&I
- —
- Monthly cashflow
- —
- DSCR
- —
- Eligible?
- —
No personal income docs; deal must DSCR.
Hard money
10% down · 12.0% · 12mo
- Down + closing
- —
- Monthly P&I
- —
- Monthly cashflow
- —
- DSCR
- —
- Eligible?
- —
Short-term bridge; refi at stabilization.
Listing history 19 events
-
2026-06-21days on market $10,500,000 Active 61 DOM
-
2026-06-18days on market $10,500,000 Active 58 DOM
-
2026-06-17days on market $10,500,000 Active 57 DOM
-
2026-06-16days on market $10,500,000 Active 56 DOM
-
2026-06-15days on market $10,500,000 Active 55 DOM
-
2026-06-13days on market $10,500,000 Active 53 DOM
-
2026-06-09days on market $10,500,000 Active 49 DOM
-
2026-06-08days on market $10,500,000 Active 48 DOM
-
2026-06-07days on market $10,500,000 Active 47 DOM
-
2026-06-04days on market $10,500,000 Active 44 DOM
-
2026-06-03days on market $10,500,000 Active 43 DOM
-
2026-06-02days on market $10,500,000 Active 42 DOM
-
2026-06-01days on market $10,500,000 Active 41 DOM
-
2026-05-31days on market $10,500,000 Active 40 DOM
-
2026-04-21$10,500,000 Active 1751-char remark
-
2025-06-01Active
-
2024-11-20price
-
2024-08-14price
-
2024-07-18Active
ⓘ Source: listings_history table (triggers on properties + properties_extension) + one-shot
backfill from property_details.listing_events for pre-trigger history.
Climate risk First Street
- Flood 5/10 Major FEMA zone X (unshaded) · 24% chance over 30 yrs
- Wildfire 1/10 Low
- Heat 6/10 Major 7 d/yr ≥92°F today · 22 d/yr by 30 yrs out
- Wind 1/10 Low
- Air quality 5/10 Major 8 unhealthy d/yr today · 8 by 30 yrs out
Nearby sold comps map
Loading sold comps map…
Walkable amenities ~0.75 mi
Loading nearby amenities…
Taxation est. · year 1
- Rental income
- $1,155,348
- − Mortgage interest
- −$588,163
- − Property taxes
- −$157,500
- − Insurance
- −$52,500
- − Repairs & maintenance
- −$92,428
- − Management
- −$92,428
- − Depreciation
- −$305,455
- Taxable loss
- −$133,125
- Est. tax savings @ 24.0%
- +$31,950
- After-tax cash flow
- $73,917/yr
For passive investors: Depreciation is non-cash, so a rental often shows a tax loss while cash-flowing — sheltering income. Rental losses are passive: they offset passive income freely, and up to $25,000/yr can offset ordinary (W-2) income if you actively participate and your MAGI is under $100k (phasing out to $0 by $150k); unused losses carry forward. On sale, claimed depreciation is recaptured at up to 25%, and gains may owe capital-gains tax (a 1031 exchange can defer both). Figures are a year-1 estimate at your 24.0% rate — not tax advice; consult a CPA.
Condition & rehab AI · 13 photos
The subject property is a well-maintained multi-family building with good condition and potential for value-add improvements.
Value-add opportunities
- Both Upgrade flooring to luxury vinyl plank — This will enhance the aesthetic and increase both resale and rental value
- Both Install stainless steel appliances — This will attract higher rent and increase resale value
- Both Custom cabinetry and countertops — This will enhance the aesthetic and increase both resale and rental value
- Both Smooth ceilings and light fixtures — This will enhance the aesthetic and increase both resale and rental value
Renovation cost estimate screening
Value-add ROI direction
- Both Upgrade flooring to luxury vinyl plank — This will enhance the aesthetic and increase both resale and rental value ↑
- Both Install stainless steel appliances — This will attract higher rent and increase resale value ↑
- Both Custom cabinetry and countertops — This will enhance the aesthetic and increase both resale and rental value ↑
- Both Smooth ceilings and light fixtures — This will enhance the aesthetic and increase both resale and rental value ↑
ⓘ Cost ranges are severity-bucket heuristics (US national rule-of-thumb). Get contractor quotes + a written scope before underwriting a rehab budget.
Schools (NCES district)
- District
- Los Angeles Unified
- NCES district ID
- 0622710
- Math proficiency
- 29% ▼ -4.00%
- Reading proficiency
- 54% ▲ 10.00%
- Median HH income
- $50,403
- Composite
- 35.67/100
- National rank
- #4875
- State rank
- #223 of 517 in CA
Livability — Los Angeles
- Score
- 68/100
- State rank
- #273
- US rank
- #9237
Category grades
Schools grade is shown separately in the Schools card above.
Census & demographics
- Census place
- Los Angeles, CA
- County
- Los Angeles County · 9,444,647 people
- City population
- 3,838,149
- Metro
- Los Angeles-Long Beach-Anaheim, CA
- Population (ZIP)
- 58,484
- Household income
- $64,826
- Rent vs Own
- Severe rent burden
- 6512.0
Population outlook (Los Angeles County) Hauer SSP2
- Today (2025)
- 10,940,515 people
- By 2030
- 11,256,481 · +2.9%
- By 2040
- 11,729,929 · +7.2%
- By 2050
- 11,948,407 · +9.2%
- By 2075
- 11,818,114 · +8.0%
- By 2100
- 10,842,928 · -0.9%
Race, ethnicity, and origin ACS 2023
- Neighborhood character
- Diverse neighborhood (Simpson 0.68)
- Race & ethnicity
- Hispanic / Latino 46% Asian 25% White 21% Two or more races 11% Black 4% Native American 1%
- Hispanic origin (detail)
- Mexican 19%
- Common ancestry
- Lithuanian 1% Romanian 1% Scotch-Irish 1%
- Foreign-born
- 47% · Canada, South Korea, China
- Languages at home
- 34% English-only · Spanish 40% Korean 10% Tagalog/Filipino 8%
Political lean MEDSL · Los Angeles
- 2024 margin
- Solid D (+32.9) · D 64.8% · R 31.9% · Other 3.3%
- 2008→2024 swing
- -7.4pp toward R · 2008: 40.4pp · 2024: 32.9pp
- All cycles
- 2024: D+32.9 2020: D+44.2 2016: D+48.0 2012: D+40.0 2008: D+40.4
Not yet ingested
- Civics
- —
Market trends
- HPI YoY
- ▼ -896.52%
- Current HPI
- 421.3689
- Rent YoY
- ▼ -1.71%
- Metro
- Los Angeles-Long Beach-Anaheim, CA
- State GDP YoY
- ▲ 3.21%
- F500 in state
- 116
Industry mix (Fortune 500 HQ in CA)
| Industry | F500 HQs | Revenue |
|---|---|---|
| Technology | 27 | $1,492B |
|
||
| Financial Services | 3 | $174B |
|
||
| Retail | 3 | $44B |
|
||
| Insurance | 3 | $26B |
|
||
| Media / Entertainment | 2 | $115B |
|
||
| Pharmaceuticals / Biotech | 2 | $62B |
|
||
Price history
5 events — show timeline
- 2026-04-21 Listed $10,500,000 TheMLS
- 2025-06-01 Listed — TheMLS
- 2024-11-20 Price Changed — TheMLS
- 2024-08-14 Price Changed — TheMLS
- 2024-07-18 Listed — TheMLS
Cash-flow waterfall
monthlySold comps — $/sqft
last 12 mo · ≤1 miLoading sold comps…