 🏗️ New Construction
117 Nandina Dr · Scott, LA
Flood risk No data
- FEMA flood zone
- —
- Chance of flooding over 30 yrs
- —
- Est. flood insurance / yr
- —
Fire risk No data
- Est. fire insurance / yr
- —
Heat risk No data
- Hot days now (above threshold)
- —
- Hot days in 30 yrs
- —
Wind risk No data
- Chance of severe wind over 30 yrs
- —
Air-quality risk No data
- Unhealthy air days now
- —
- Unhealthy air days in 30 yrs
- —
Risk factors via First Street. Map © Google.
Why this score? — see what drove the D grade
The composite is a weighted blend of 9 inputs, each scored 0–100. Each bar is that input's sub-score; the figure is the points it added to the 100-point composite (weight × sub-score).
- Cash flow +12.5/30.0
- ARV discount +7.5/15.0
- Condition / age +4.8/5.0
- 1% rule +3.8/10.0
- DSCR +3.7/10.0
- Schools +3.6/10.0
- Livability +3.3/5.0
- Rent growth +2.5/5.0
- Appreciation +0.0/10.0
$235,372
🖨 Deal sheet (PDF) 📄 Offer letter ✓ Due diligence
Listing remarks MLS
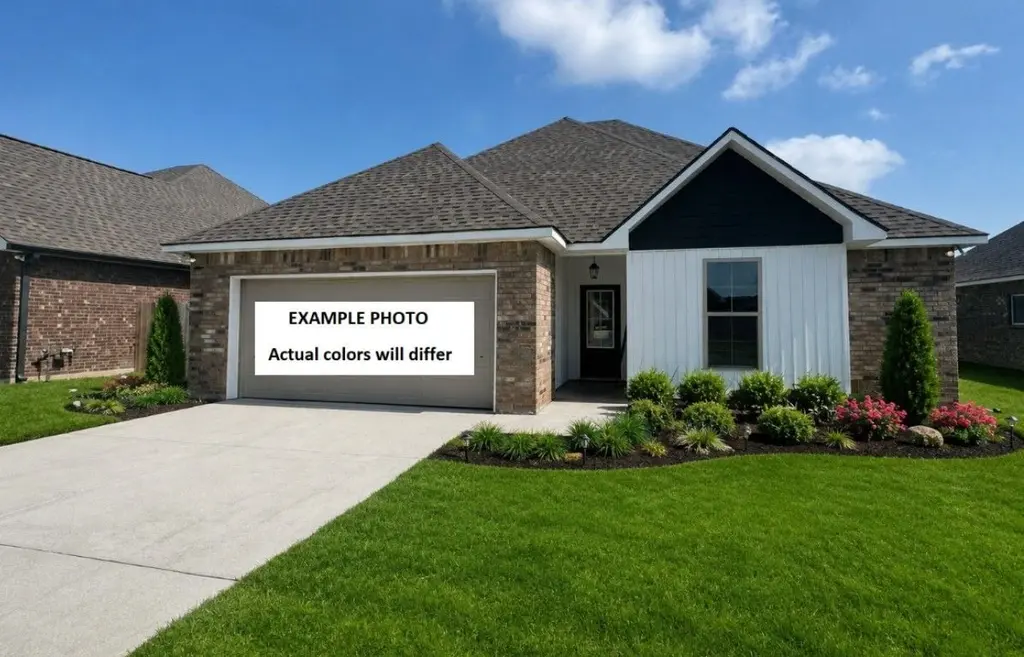
* 2/1 buydown with rate as low as 3.99% for the first 12 months. Contact Builder Sales Rep(s) for current incentive details. * Awesome builder rate + FREE Refrigerator (restrictions apply)! The Blackburn IV G in the Payton Woods community features 3 bedrooms and 2 full bathrooms. This thoughtfully designed open-concept floor plan offers modern style and everyday functionality, featuring upgraded quartz countertops, luxury vinyl plank flooring in the primary bedroom, framed bathroom mirrors, and more. The kitchen is equipped with stainless steel appliances, a breakfast bar, and undermount sink, creating a space that is both stylish and practical. Luxury vinyl plank flooring extends throughout the living areas, hallways, and all wet areas for easy maintenance and lasting durability. The spacious primary suite includes a large walk-in closet and a well-appointed bath designed for comfort and convenience. Additional features include crown molding, a Smart Connect Wi-Fi thermostat, a gas tankless water heater, radiant barrier roof decking, Low-E tilt-in windows, a post-tension slab, and a seasonal landscaping package-delivering energy efficiency, quality construction, and modern living.
Key facts
- Undermount sink
- Breakfast bar
- 7,405 sq ft lot
Tags
Property features AI
Finance
- HOA & community: Community association with annual fee; Annual association fee: $430; Association provides accounting and management
Exterior
- Parking: 2 covered parking spaces; 2-car garage
- Utilities: City gas; Public sewer; SLEMCO electric
- Home design: Single family residence; Under construction
- Construction: Brick veneer and vinyl siding; Composition roof
- Exterior features: Outdoor lighting; Open patio/porch
Interior
- Kitchen: Dishwasher; Microwave; Electric stove
- Bedrooms: Bedroom 2; Bedroom 3
- Flooring: Carpet; Vinyl plank
- Bathrooms: 2 full bathrooms
- Heating & cooling: Central air conditioning; Natural gas heating
- Interior features: Quartz counters; Dining room; Living room; Kitchen
- Laundry & utility: Electric dryer hookup
Neighborhood map
What this means for you Summary
Snapshot
- This is a 3-bed/2.0-bath single-family listed at $235k. Condition is rated excellent.
Deal economics
- At list price, monthly cash flow is $-34 ($-414/yr) — negative.
- To cash-flow at today's rent, offer at most $232k (1.4% below list).
- To meet the 1% rule (rent ≥ 1% of price), the offer needs to be $207k (11.9% below list).
- Recommended offer: $207k (11.9% below list) — sets the bar for 1% rule.
- Cap rate 6.1% vs local median 4.7% in Scott — top-decile yield for the area; either an underpriced asset or a hidden risk that comps aren't pricing in. Stress-test before assuming the spread holds.
Location & tenants
- Location reads 66/100 on livability (#116 in LA) — a middle-class / working-renter tenant base. Strengths: cost of living A+, health & safety A+, housing B+; Watch: crime F, amenities F, commute F.
- Lafayette Parish (urban): math 38% / reading 46% proficiency, ranked #19 of 98 in LA (top 19%) — families likely to look elsewhere, expect single-tenant / working-renter base with shorter leases.
- Zoned schools: Westside Elementary School (math 32% / reading 34%, grade F, #297 of 646 statewide, top 46%, 635 students, 72% FRL); Scott Middle School (math 20% / reading 28%, grade F, #143 of 218 statewide, top 65%, 559 students, 65% FRL); Acadiana High School (math 31% / reading 29%, grade F, #125 of 265 statewide, top 47%, 1,813 students, 56% FRL).
- Zoned-school proficiency averages 29% at this address vs 42% district-wide (-13 pts) — the specific schools serving this property underperform the Lafayette Parish average; the district grade overstates school quality for this exact location.
- Market conditions: 277 active listings in the ZIP; 5 comparable units currently listed for rent nearby; rentals at typical pace (median 16d on market — plan ~3-4 weeks tenant-placement turnaround); 40% of comp listings sitting > 30 days — soft ceiling on asking rent; 1,585 units permitted in Lafayette Parish in 2024 (10 in 5+ unit buildings).
Forward outlook
- Local home prices are declining (-3.0%/yr); year-one equity from $2k of loan paydown is wiped out by about $7k of value loss. Plan a longer hold.
- Lafayette County population projected at +34% by 2050 — long-run rental-demand tailwind backs the buy-and-hold thesis.
Negotiation context
- Only 8 days on market — expect competitive offers; lowballing is unlikely to land.
- 2 sale attempts with the ask held roughly flat each time — persistent listings suggest the price (not the market) is what's stuck; bring a comps-based counter.
Questions for the listing agent
- What do current leases actually rent for vs. the listed asking? Can we see a recent rent roll and the last 12 months of T-12 income?
- What does the HOA fee cover, when was the last increase, and are there any pending special assessments or reserve-fund shortfalls?
- Is there a deadline driving the sale (1031 exchange, divorce, estate, relocation)? That informs how much negotiation room exists.
- Schools are B-rated — typically a magnet for longer-tenancy family renters. What's the average tenant stay here, and is there a school-zone premium baked into asking?
- Crime grade is F in this area — have there been break-ins, vandalism, or insurance claims at this property in the last 3 years? What carrier currently insures it and at what premium?
- The area grade is low — what's the realistic commute time and amenity access for the typical tenant pool here? Any planned neighborhood developments (good or bad) we should know about?
- What's the average days-on-market for RENTAL listings here right now (not sales)? A rising rental-DOM trend means longer vacancies and softer asking-rent achievability than the comps imply.
- What's the recent tenant-quality profile in this submarket — average credit score on applications, eviction rate, late-payment / NSF rate, and stable-employment percentage? A property-management company in the area should have these aggregated.
- How much new for-sale + rental construction is in the pipeline within 1–3 miles? Heavy new supply typically softens prices + rents 12–24 months out; constrained supply supports both.
Investment metrics
- 1% rule
- 0.88% ✗
- Cap rate
- 6.12%
- Cash-on-cash
- -0.62%
- DSCR
- 0.97
- GRM
- 9.5
CMA / ARV
- ARV (on-the-fly)
- $236,948
- Comps found
- 12
Show comp detail 12 sales within ~0.75 mi
| Address | Dist | Beds/Ba | Sqft | Sold | Price | $/sf | Match |
|---|---|---|---|---|---|---|---|
| 111 Nandina Dr | 0.00mi | 3/2.0 | 1,689 (+6%) | 2mo | $245,664 | $145 | 89 |
| 100 Sandstone Ave | 0.34mi | 3/2.0 | 1,578 (-1%) | 1mo | $345,000 | $219 | 81 |
| 211 Nandina Dr | 0.20mi | 3/2.0 | 1,495 (-7%) | 0mo | $231,321 | $155 | 79 |
| 200 Nandina Dr | 0.20mi | 3/2.0 | 1,735 (+8%) | 1mo | $255,956 | $148 | 76 |
| 119 Nandina Dr | 0.00mi | 3/2.0 | 1,825 (+14%) | 2mo | $263,758 | $145 | 75 |
| 308 Payton Woods Ln | 0.12mi | 3/2.0 | 1,825 (+14%) | 1mo | $256,786 | $141 | 70 |
| 300 Payton Woods Ln | 0.12mi | 3/2.0 | 1,825 (+14%) | 1mo | $258,075 | $141 | 70 |
| 107 Earline Dr | 0.13mi | 3/2.0 | 1,387 (-13%) | 2mo | $167,000 | $120 | 70 |
| 104 Breckenridge Loop | 0.56mi | 3/2.0 | 1,544 (-4%) | 3mo | $212,500 | $138 | 66 |
| 400 Cheyenne Cir | 0.69mi | 3/2.0 | 1,518 (-5%) | 1mo | $230,000 | $152 | 59 |
| 129 Harvest Pointe Cir | 0.65mi | 3/2.0 | 1,440 (-10%) | 2mo | $219,900 | $153 | 52 |
| 427 Bozeman Trl | 0.64mi | 3/2.0 | 1,836 (+15%) | 1mo | $399,904 | $218 | 45 |
Match score weights: distance 35% · size 25% · config 20% · recency 20%. Top-matched comps best support the ARV.
Projected returns pro-forma
-3.0% appreciation · 3.0% rent growth · sell at horizon
- IRR
- -17.3%
- Equity multiple
- 0.39×
- Total profit
- $-40,538
- Equity at exit
- $35,330
- IRR
- -9.2%
- Equity multiple
- 0.43×
- Total profit
- $-37,910
- Equity at exit
- $20,487
Cash invested: $66,345 (down + closing). Projections, not guarantees.
Landlord ↔ Tenant lean methodology
- Overall (STATE)
- 90 Strongly Landlord-Friendly
- State Louisiana
- 90 Strongly Landlord-Friendly · R+12
- County
- — inherits STATE
- City
- — inherits STATE
ZIP-level market 70583
- Active inventory
- 277
- Price-to-rent
- 9.5×
Monthly cashflow live
- Estimated rent
- $2,075 high interval (Pro) →
- Mortgage (P&I)
- −$1,243
- Tax est. 1.5%
- −$296 /mo · $3,554/yr
- Insurance
- −$99
- HOA
- −$36
- Vacancy / Maint / Mgmt
- −$436
- Net cashflow
- $-34
Break-even live
Sensitivity live
| Price | -10% $129 | -5% $47 | +0% $-34 | +5% $-116 | +10% $-198 |
|---|---|---|---|---|---|
| Rent | -10% $-198 | -5% $-116 | +0% $-34 | +5% $47 | +10% $129 |
| Rate | -1.0pp $85 | -0.5pp $26 | base $-34 | +0.5pp $-96 | +1.0pp $-158 |
UW: 25.0% down · 7.5% · 30yr · 1.5% tax · 5.0% vac · 8.0% maint · 8.0% mgmt
Financing live
Cash to close
- Down payment
- $59,237
- Closing costs
- $7,108
- Reserves months
- —
- Total cash needed
- —
Loan-product check · same deal, 3 products live
Conventional
25% down · 7.5% · 30yr
- Down + closing
- —
- Monthly P&I
- —
- Monthly cashflow
- —
- DSCR
- —
- Eligible?
- —
Personal DTI + credit; lowest rate.
DSCR
20% down · 8.5% · 30yr
- Down + closing
- —
- Monthly P&I
- —
- Monthly cashflow
- —
- DSCR
- —
- Eligible?
- —
No personal income docs; deal must DSCR.
Hard money
10% down · 12.0% · 12mo
- Down + closing
- —
- Monthly P&I
- —
- Monthly cashflow
- —
- DSCR
- —
- Eligible?
- —
Short-term bridge; refi at stabilization.
Rent comps 5 comps
| Address | Beds | Baths | Sqft | Rent | $/sqft | DOM | Units | Dist |
|---|---|---|---|---|---|---|---|---|
| 1313 Apollo Rd Scott, LA | 1.0–3.0 | 1.0–2.0 | 1100 | $2,000 | $1.82 | 15d | 10 | 0.32mi |
| 315 Sandstone Ave #202 Scott, LA | 2.0 | 2.5 | 1193 | $1,895 | $1.59 | 15d | 1 | 0.56mi |
| 128 Oak Village Dr Scott, LA | 3.0 | 2.0 | 1445 | $2,450 | $1.70 | 15d | 1 | 0.59mi |
| 108 Notre Dame Dr Lafayette, LA | 3.0 | 3.0 | 1700 | $1,700 | $1.00 | 45d | 1 | 0.93mi |
| 401 Pinto St Lafayette, LA | 3.0 | 2.0 | 1601 | $2,300 | $1.44 | 45d | 1 | 1.11mi |
HOA detail
- Monthly dues
- $36 · $432/yr
- Likely covers
- watergasinternetlandscaping
Listing history 7 events
-
2026-06-13statusdays on market $235,372 Pending 8 DOM
-
2026-06-10days on market $235,372 Active 6 DOM
-
2026-06-09days on market $235,372 Active 5 DOM
-
2026-06-08days on market $235,372 Active 4 DOM
-
2026-06-07days on market $235,372 Active 3 DOM
-
2026-06-05remarks 699-char remark
-
2026-06-05$235,372 Active 1 DOM
ⓘ Source: listings_history table (triggers on properties + properties_extension) + one-shot
backfill from property_details.listing_events for pre-trigger history.
Nearby sold comps map
Loading sold comps map…
Walkable amenities ~0.75 mi
Loading nearby amenities…
Taxation est. · year 1
- Rental income
- $24,897
- − Mortgage interest
- −$13,273
- − Property taxes
- −$3,554
- − Insurance
- −$1,185
- − Repairs & maintenance
- −$1,992
- − Management
- −$1,992
- − HOA
- −$432
- − Depreciation
- −$6,893
- Taxable loss
- −$4,424
- Est. tax savings @ 24.0%
- +$1,062
- After-tax cash flow
- $648/yr
For passive investors: Depreciation is non-cash, so a rental often shows a tax loss while cash-flowing — sheltering income. Rental losses are passive: they offset passive income freely, and up to $25,000/yr can offset ordinary (W-2) income if you actively participate and your MAGI is under $100k (phasing out to $0 by $150k); unused losses carry forward. On sale, claimed depreciation is recaptured at up to 25%, and gains may owe capital-gains tax (a 1031 exchange can defer both). Figures are a year-1 estimate at your 24.0% rate — not tax advice; consult a CPA.
Condition & rehab AI · 10 photos
This home is in excellent condition with no visible repairs needed. It is move-in ready and has a good resale value due to its well-maintained exterior and interior.
Value-add opportunities
- Resale Painting and touch-up of exterior siding and brick — Enhances curb appeal and can add value to the home
- Resale Landscaping improvements — Enhances curb appeal and can add value to the home
Renovation cost estimate screening
Value-add ROI direction
- Resale Painting and touch-up of exterior siding and brick — Enhances curb appeal and can add value to the home ↑
- Resale Landscaping improvements — Enhances curb appeal and can add value to the home ↑
ⓘ Cost ranges are severity-bucket heuristics (US national rule-of-thumb). Get contractor quotes + a written scope before underwriting a rehab budget.
Schools (NCES district)
- District
- Lafayette Parish
- NCES district ID
- 2200870
- Math proficiency
- 38% ▼ -32.00%
- Reading proficiency
- 46% ▼ -24.00%
- Median HH income
- $50,238
- Composite
- 36.15/100
- National rank
- #4741
- State rank
- #19 of 98 in LA
Livability — Scott
- Score
- 66/100
- State rank
- #116
- US rank
- #11265
Category grades
Schools grade is shown separately in the Schools card above.
Census & demographics
- Census place
- Scott, LA
- City population
- 8,670
- Population (ZIP)
- 8,670
Population outlook (Lafayette County) Hauer SSP2
- Today (2025)
- 280,930 people
- By 2030
- 301,092 · +7.2%
- By 2040
- 339,456 · +20.8%
- By 2050
- 375,156 · +33.5%
- By 2075
- 451,672 · +60.8%
- By 2100
- 497,203 · +77.0%
Race, ethnicity, and origin ACS 2023
- Neighborhood character
- Predominantly White (68%)
- Race & ethnicity
- White 68% Hispanic / Latino 16% Black 13% Two or more races 11%
- Hispanic origin (detail)
- Mexican 7% Cuban 2%
- Common ancestry
- Lithuanian 11% Slovak 3% Italian 1%
- Foreign-born
- 11% · Canada
- Languages at home
- 81% English-only · Spanish 12% French/Haitian/Cajun 7%
Political lean MEDSL · Lafayette
- 2024 margin
- Solid R (+31.4) · D 33.5% · R 64.8% · Other 1.7%
- 2008→2024 swing
- -0.1pp no change · 2008: -31.3pp · 2024: -31.4pp
- All cycles
- 2024: R+31.4 2020: R+28.7 2016: R+33.6 2012: R+33.7 2008: R+31.3
Not yet ingested
- Civics
- —
Market trends
- HPI YoY
- ▼ -84.03%
- Current HPI
- 132.4083
- Rent YoY
- —
- Metro
- —
- State GDP YoY
- ▲ 3.29%
- F500 in state
- 10
Industry mix (Fortune 500 HQ in LA)
| Industry | F500 HQs | Revenue |
|---|---|---|
| Telecommunications | 2 | $23B |
|
||
| Utilities | 1 | $12B |
|
||
| Wholesale / Distribution | 1 | $5B |
|
||
| Advertising | 1 | $2B |
|
||
Price history
+0.0% since first listed2 events — show timeline
- 2026-06-04 Listed $235,372 Zillow
- 2026-06-04 Listed $235,372 AcadianaMLS
Cash-flow waterfall
monthlySold comps — $/sqft
last 12 mo · ≤1 miLoading sold comps…