 🏗️ New Construction
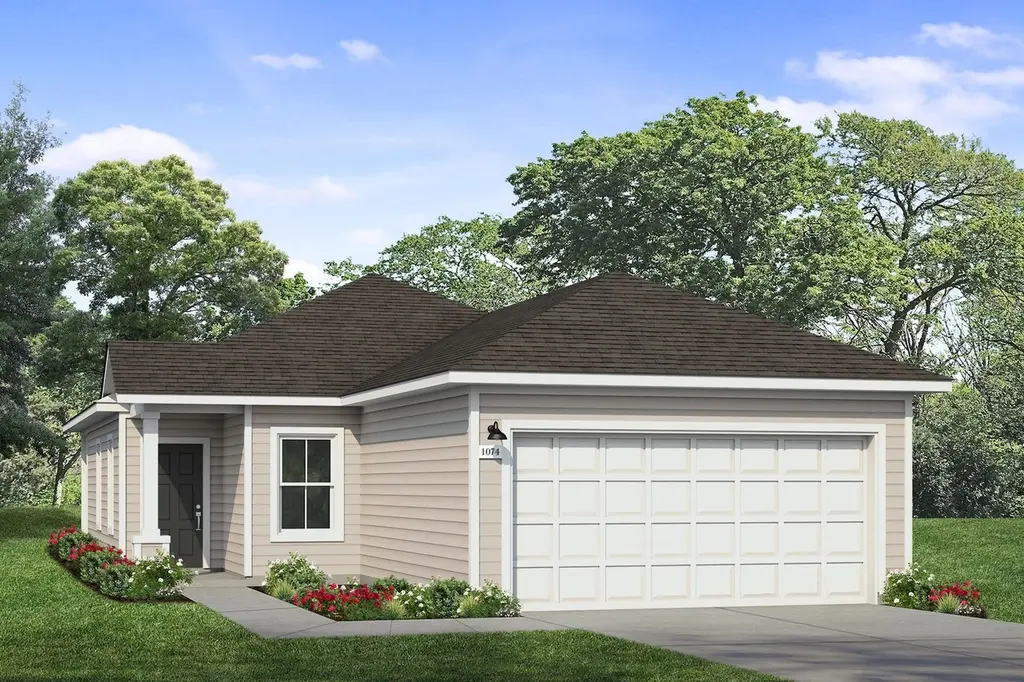
Applewhite Meadows 1074 Plan · San Antonio, TX
Flood risk 1/10 · Minimal
- FEMA flood zone
- X (unshaded)
- Chance of flooding over 30 yrs
- 0.0%
- Est. flood insurance / yr
- $507 – $1,088
Fire risk 5/10 · Moderate
- Est. fire insurance / yr
- $1,222 – $2,270
Heat risk 8/10 · Major
- Hot days now (above 109°F)
- 7 days/yr
- Hot days in 30 yrs
- 21 days/yr
Wind risk 8/10 · Major
- Chance of severe wind over 30 yrs
- 80.0%
Air-quality risk 2/10 · Minimal
- Unhealthy air days now
- 0 days/yr
- Unhealthy air days in 30 yrs
- 1 days/yr
Risk factors via First Street. Map © Google.
Why this score? — see what drove the D- grade
The composite is a weighted blend of 9 inputs, each scored 0–100. Each bar is that input's sub-score; the figure is the points it added to the 100-point composite (weight × sub-score).
- Appreciation +10.0/10.0
- ARV discount +7.5/15.0
- Cash flow +6.7/30.0
- Livability +4.0/5.0
- Rent growth +2.7/5.0
- Condition / age +2.5/5.0
- Schools +2.2/10.0
- 1% rule +1.7/10.0
- DSCR +1.0/10.0
$209,990
🖨 Deal sheet 📄 Offer letter ✓ Due diligence
Listing remarks MLS
Discover Applewhite Meadows, a welcoming new home community on San Antonio's South Side, where everyday comfort meets connected living. Brohn Homes is bringing thoughtfully designed new construction homes to this growing area, offering a range of floor plans created to support how you live today, whether you're buying your first home, growing your household, or simply looking for more space to enjoy. With community amenities like a pool and playscape, plus convenient access to major employers, shopping, dining, and downtown San Antonio, Applewhite Meadows delivers the perfect balance of neighborhood feel and city convenience. Our model home is currently under construction and coming soon, giving you an exciting first look at the quality, smart design, and thoughtful details Brohn Homes is known for. Like every Brohn community, Applewhite Meadows is designed to deliver More Home for Your Money, with smarter construction, modern finishes, and long-term value built in from the start.
Key facts
- New home community
- Community amenities
- Convenient access
Tags
Neighborhood map
What this means for you Summary
Snapshot
- This is a 3-bed/2.0-bath single-family listed at $210k.
Deal economics
- At list price, monthly cash flow is $-389 ($-5k/yr) — negative.
- To cash-flow at today's rent, offer at most $187k (11.0% below list).
- To meet the 1% rule (rent ≥ 1% of price), the offer needs to be $163k (22.2% below list).
- Recommended offer: $163k (22.2% below list) — sets the bar for 1% rule.
Location & tenants
- Location reads 80/100 on livability (#31 in TX, #1,616 nationally) — a professional / high-income tenant draw. Strengths: amenities A+, commute A+, cost of living A+; Watch: schools C-, crime F.
- Southwest ISD (rural): math 21% / reading 31% proficiency, ranked #701 of 826 in TX (top 85%) — low school quality limits family demand, transient renter base, plan for 1-2y turnover; 75% free/reduced lunch — lower-income household profile, screen leases tightly.
- Market conditions: Rents flat; 274 active listings in the ZIP; 36 comparable units currently listed for rent nearby; rentals at typical pace (median 24d on market — plan ~3-4 weeks tenant-placement turnaround); 8,308 units permitted in Bexar County in 2024 (2,506 in 5+ unit buildings).
- This rent runs 33% of the median local income ($60k/yr) — at the standard rent-burdened threshold; future hikes will face affordability resistance.
Forward outlook
- In year one you build about $26k of equity ($2k loan paydown + $24k appreciation (10.0% local appreciation)).
- Bexar County population projected at +50% by 2050 — long-run rental-demand tailwind backs the buy-and-hold thesis.
- By year 2, paydown + projected appreciation supports a ~$42k cash-out refi (75% LTV) — recoverable capital for the next deal without selling this one.
Negotiation context
- It's been on market 131 days — a 12% lower offer ($185k) is reasonable based on typical stale-listing flexibility.
Risks & watch-outs
- Climate carrying-cost: severe wind risk, 80% chance of damaging wind over 30y; moderate wildfire risk; extreme-heat days projected 7→21/yr by 2055 (HVAC capex compounding) — expect insurance premiums to compound above CPI over the hold.
Questions for the listing agent
- What do current leases actually rent for vs. the listed asking? Can we see a recent rent roll and the last 12 months of T-12 income?
- It's been on market 131 days. Have you received any prior offers? Is the seller open to a 22% concession, seller financing, or rate buy-down credit?
- Why hasn't it sold? Are there any deal-killer items the seller is aware of (foundation, flood, title, zoning, code violations)?
- Is there a deadline driving the sale (1031 exchange, divorce, estate, relocation)? That informs how much negotiation room exists.
- Crime grade is F in this area — have there been break-ins, vandalism, or insurance claims at this property in the last 3 years? What carrier currently insures it and at what premium?
- The area grade is low — what's the realistic commute time and amenity access for the typical tenant pool here? Any planned neighborhood developments (good or bad) we should know about?
- What's the average days-on-market for RENTAL listings here right now (not sales)? A rising rental-DOM trend means longer vacancies and softer asking-rent achievability than the comps imply.
- What's the recent tenant-quality profile in this submarket — average credit score on applications, eviction rate, late-payment / NSF rate, and stable-employment percentage? A property-management company in the area should have these aggregated.
- How much new for-sale + rental construction is in the pipeline within 1–3 miles? Heavy new supply typically softens prices + rents 12–24 months out; constrained supply supports both.
Investment metrics
- 1% rule
- 0.67% ✗
- Cap rate
- 4.37%
- Cash-on-cash
- -6.85%
- DSCR
- 0.70
- GRM
- 12.4
CMA / ARV
- ARV (median comp)
- $243,043
- List price
- $209,990
- Delta
- -13.60%
- Verdict
- UNDERPRICED
- Comps
- 20 within 1.0 mi
Show comp detail 10 sales within ~0.75 mi
| Address | Dist | Beds/Ba | Sqft | Sold | Price | $/sf | Match |
|---|---|---|---|---|---|---|---|
| 2130 Bigmouth Rod | 0.57mi | 3/2.0 | 1,125 (+5%) | 2mo | $175,000 | $156 | 64 |
| 10707 Musket | 0.48mi | 3/1.0 | 1,088 (+1%) | 10mo | $182,000 | $167 | 64 |
| 3023 Bay Hurst | 0.49mi | 3/2.0 | 1,022 (-5%) | 14mo | $175,000 | $171 | 58 |
| 2422 Dry Moss Way | 0.27mi | 2/1.5 (-1) | 1,036 (-4%) | 21mo | $199,990 | $193 | 57 |
| 2338 Pink Pearl | 0.38mi | 3/2.0 | 1,200 (+12%) | 8mo | $262,226 | $219 | 56 |
| 3058 Moss Spring Dr | 0.58mi | 3/2.0 | 1,141 (+6%) | 14mo | $190,000 | $167 | 51 |
| 11307 Gaylord Dr | 0.69mi | 2/2.0 (-1) | 1,189 (+11%) | 9mo | $197,000 | $166 | 37 |
| 11319 Gaylord Dr | 0.71mi | 3/1.0 | 912 (-15%) | 3mo | $140,000 | $154 | 36 |
| 2118 Dry Moss | 0.68mi | 3/2.0 | 1,235 (+15%) | 18mo | $260,000 | $211 | 28 |
| 11219 Highcrest Dr | 0.75mi | 4/2.0 (+1) | 1,191 (+11%) | 24mo | $195,000 | $164 | 22 |
Match score weights: distance 35% · size 25% · config 20% · recency 20%. Top-matched comps best support the ARV.
Projected returns pro-forma
10.0% appreciation · 0.83% rent growth · sell at horizon
- IRR
- 18.9%
- Equity multiple
- 2.53×
- Total profit
- $104,148
- Equity at exit
- $218,952
- IRR
- 17.1%
- Equity multiple
- 5.70×
- Total profit
- $319,736
- Equity at exit
- $472,179
Cash invested: $68,052 (down + closing). Projections, not guarantees.
Landlord ↔ Tenant lean methodology
- Overall (STATE)
- 87 Strongly Landlord-Friendly
- State Texas
- 87 Strongly Landlord-Friendly · R+5
- County
- — inherits STATE
- City
- — inherits STATE
ZIP-level market 78224
- Home prices YoY
- 12.4%
- Rents YoY
- 0.8%
- Active inventory
- 274
- Price-to-rent
- 10.7×
Monthly cashflow live
- Estimated rent
- $1,634 high interval (Pro) →
- Mortgage (P&I)
- −$1,275
- Tax est. 1.5%
- −$304 /mo · $3,646/yr
- Insurance
- −$101
- HOA
- −$0
- Vacancy / Maint / Mgmt
- −$343
- Net cashflow
- $-389
Break-even live
UW: 25.0% down · 7.5% · 30yr · 1.5% tax · 5.0% vac · 8.0% maint · 8.0% mgmt
Financing live
Cash to close
- Down payment
- $60,761
- Closing costs
- $7,291
- Reserves months
- —
- Total cash needed
- —
Loan-product check · same deal, 3 products live
Conventional
25% down · 7.5% · 30yr
- Down + closing
- —
- Monthly P&I
- —
- Monthly cashflow
- —
- DSCR
- —
- Eligible?
- —
Personal DTI + credit; lowest rate.
DSCR
20% down · 8.5% · 30yr
- Down + closing
- —
- Monthly P&I
- —
- Monthly cashflow
- —
- DSCR
- —
- Eligible?
- —
No personal income docs; deal must DSCR.
Hard money
10% down · 12.0% · 12mo
- Down + closing
- —
- Monthly P&I
- —
- Monthly cashflow
- —
- DSCR
- —
- Eligible?
- —
Short-term bridge; refi at stabilization.
Rent comps 36 comps
| Address | Beds | Baths | Sqft | Rent | $/sqft | DOM | Units | Dist |
|---|---|---|---|---|---|---|---|---|
| 2350 Redlove Dr San Antonio, TX | 3.0 | 2.5 | 1420 | $1,675 | $1.18 | 23d | 1 | 0.33mi |
| 10127 Texas 16 Unit 710 San Antonio, TX | 2.0 | 2.0 | 950 | $807 | $0.85 | 16d | 1 | 0.35mi |
| 2350 Dry Moss Way San Antonio, TX | 3.0 | 2.5 | 1420 | $1,650 | $1.16 | 43d | 1 | 0.35mi |
| 10127 State Highway 16 S San Antonio, TX | 2.0–4.0 | 2.0 | 1125 | $1,200 | $1.07 | 2d | 26 | 0.35mi |
| 2330 Redlove Dr San Antonio, TX | 3.0 | 2.5 | 1420 | $1,600 | $1.13 | 4d | 1 | 0.37mi |
| 10610 Apple Pie Rd San Antonio, TX | 3.0 | 2.5 | 1272 | $1,595 | $1.25 | 23d | 1 | 0.47mi |
| 12305 SW Loop 410 San Antonio, TX | 1.0–4.0 | 1.0–2.0 | 1036 | $1,318 | $1.27 | 16d | 1 | 0.60mi |
| 3263 Rancho Grande San Antonio, TX | 3.0 | 2.0 | 1500 | $1,650 | $1.10 | 23d | 1 | 0.62mi |
| 2026 Bigmouth Rod San Antonio, TX | 4.0 | 2.5 | 1383 | $1,650 | $1.19 | 4d | 1 | 0.67mi |
| 11009 Valley Star Dr San Antonio, TX | 4.0 | 1.5 | 1004 | $1,450 | $1.44 | 4d | 1 | 0.69mi |
| 11318 Clearmine St #101 San Antonio, TX | 3.0 | 2.5 | 1362 | $1,700 | $1.25 | 12d | 1 | 0.70mi |
| 11318 Clearmine St Unit 103 South Southwest, TX | 3.0 | 2.5 | 1362 | $1,514 | $1.11 | 43d | 1 | 0.70mi |
| 11318 Clearmine St Unit 104 South Southwest, TX | 3.0 | 2.5 | 1362 | $1,700 | $1.25 | 43d | 1 | 0.70mi |
| 11326 Clearmine St Unit 104 San Antonio, TX | 3.0 | 2.5 | 1362 | $1,614 | $1.19 | 43d | 1 | 0.73mi |
| 10414 Espada Pass San Antonio, TX | 3.0 | 2.0 | 1416 | $1,600 | $1.13 | 43d | 1 | 0.82mi |
| 11327 Clearmine San Antonio, TX | 3.0 | 2.5 | 1362 | $1,650 | $1.21 | 1d | 2 | 0.84mi |
| 3411 Avoca Dr San Antonio, TX | 3.0 | 2.0 | 1426 | $1,460 | $1.02 | 4d | 1 | 0.86mi |
| 3411 Avoca Dr San Antonio, TX | 3.0 | 2.0 | 1426 | $1,460 | $1.02 | 17d | 1 | 0.86mi |
| 3439 Twining Dr San Antonio, TX | 3.0 | 1.0 | 1124 | $1,500 | $1.33 | 17d | 1 | 0.98mi |
| 10210 S Zarzamora St San Antonio, TX | 2.0–4.0 | 2.0 | 1139 | $1,460 | $1.28 | 1d | 1 | 1.21mi |
| 9514 Veronica St San Antonio, TX | 3.0 | 2.0 | 1455 | $1,450 | $1.00 | 2d | 1 | 1.26mi |
| 3727 Aragon Dr San Antonio, TX | 3.0 | 1.0 | 1060 | $1,400 | $1.32 | 43d | 1 | 1.27mi |
| 10507 Padron Bnd San Antonio, TX | 3.0 | 2.0 | 1266 | $1,600 | $1.26 | 43d | 1 | 1.29mi |
| 10815 Bernal Cv San Antonio, TX | 3.0 | 2.0 | 1266 | $1,550 | $1.22 | 23d | 1 | 1.32mi |
| 9018 Chaminade Dr San Antonio, TX | 3.0 | 1.5 | 1056 | $1,675 | $1.59 | 43d | 1 | 1.36mi |
| 10542 Nye Pass San Antonio, TX | 3.0 | 2.0 | 1440 | $1,595 | $1.11 | 43d | 1 | 1.38mi |
| 1442 Mira Ml San Antonio, TX | 3.0 | 2.0 | 1266 | $1,545 | $1.22 | 43d | 1 | 1.40mi |
| 10119 Ana Hts San Antonio, TX | 3.0 | 2.0 | 1266 | $1,550 | $1.22 | 11d | 1 | 1.43mi |
| 1355 Neria Loop San Antonio, TX | 3.0 | 2.0 | 1266 | $1,575 | $1.24 | 43d | 1 | 1.45mi |
| 10018 Ana Hts San Antonio, TX | 3.0 | 2.0 | 1266 | $1,550 | $1.22 | 16d | 1 | 1.46mi |
| 1243 Gillette Blvd San Antonio, TX | 3.0 | 2.0 | 1456 | $1,500 | $1.03 | 23d | 1 | 1.46mi |
| 9422 Somers Bnd San Antonio, TX | 3.0 | 2.5 | 1419 | $1,575 | $1.11 | 43d | 1 | 1.47mi |
| 1402 Bertha Br San Antonio, TX | 3.0 | 2.0 | 1276 | $1,700 | $1.33 | 23d | 1 | 1.47mi |
| 10007 Kersey Ml San Antonio, TX | 3.0 | 2.0 | 1440 | $1,495 | $1.04 | 43d | 1 | 1.48mi |
| 9334 Somers Bnd San Antonio, TX | 3.0 | 2.5 | 1272 | $1,515 | $1.19 | 4d | 1 | 1.48mi |
| 9306 Somers Bnd San Antonio, TX | 3.0 | 2.5 | 1420 | $1,600 | $1.13 | 23d | 1 | 1.49mi |
Listing history 14 events
-
2026-06-18days on market $209,990 Active 131 DOM
-
2026-06-17days on market $209,990 Active 130 DOM
-
2026-06-16days on market $209,990 Active 129 DOM
-
2026-06-15days on market $209,990 Active 128 DOM
-
2026-06-13days on market $209,990 Active 126 DOM
-
2026-06-09days on market $209,990 Active 122 DOM
-
2026-06-08days on market $209,990 Active 121 DOM
-
2026-06-07days on market $209,990 Active 120 DOM
-
2026-06-04days on market $209,990 Active 117 DOM
-
2026-06-03days on market $209,990 Active 116 DOM
-
2026-06-02days on market $209,990 Active 115 DOM
-
2026-06-01days on market $209,990 Active 114 DOM
-
2026-05-31days on market $209,990 Active 113 DOM
-
2026-02-07$209,990 Active 995-char remark
Show marketing remark (995 chars)
Discover Applewhite Meadows, a welcoming new home community on San Antonio's South Side, where everyday comfort meets connected living. Brohn Homes is bringing thoughtfully designed new construction homes to this growing area, offering a range of floor plans created to support how you live today, whether you're buying your first home, growing your household, or simply looking for more space to enjoy. With community amenities like a pool and playscape, plus convenient access to major employers, shopping, dining, and downtown San Antonio, Applewhite Meadows delivers the perfect balance of neighborhood feel and city convenience. Our model home is currently under construction and coming soon, giving you an exciting first look at the quality, smart design, and thoughtful details Brohn Homes is known for. Like every Brohn community, Applewhite Meadows is designed to deliver More Home for Your Money, with smarter construction, modern finishes, and long-term value built in from the start.
ⓘ Source: listings_history table (triggers on properties + properties_extension) + one-shot
backfill from property_details.listing_events for pre-trigger history.
Climate risk First Street
- Flood 1/10 Low FEMA zone X (unshaded) · 0% chance over 30 yrs
- Wildfire 5/10 Major
- Heat 8/10 Severe 7 d/yr ≥109°F today · 21 d/yr by 30 yrs out
- Wind 8/10 Severe 80% chance of damaging wind over 30 yrs
- Air quality 2/10 Low 0 unhealthy d/yr today · 1 by 30 yrs out
Nearby sold comps map
Loading sold comps map…
Walkable amenities ~0.75 mi
Loading nearby amenities…
Taxation est. · year 1
- Rental income
- $19,610
- − Mortgage interest
- −$13,614
- − Property taxes
- −$3,646
- − Insurance
- −$1,215
- − Repairs & maintenance
- −$1,569
- − Management
- −$1,569
- − Depreciation
- −$7,070
- Taxable loss
- −$9,073
- Est. tax savings @ 24.0%
- +$2,178
- After-tax cash flow
- $-2,486/yr
For passive investors: Depreciation is non-cash, so a rental often shows a tax loss while cash-flowing — sheltering income. Rental losses are passive: they offset passive income freely, and up to $25,000/yr can offset ordinary (W-2) income if you actively participate and your MAGI is under $100k (phasing out to $0 by $150k); unused losses carry forward. On sale, claimed depreciation is recaptured at up to 25%, and gains may owe capital-gains tax (a 1031 exchange can defer both). Figures are a year-1 estimate at your 24.0% rate — not tax advice; consult a CPA.
Schools (NCES district)
- District
- Southwest ISD
- NCES district ID
- 4840950
- Math proficiency
- 21% ▼ -21.00%
- Reading proficiency
- 31% ▼ -5.00%
- Median HH income
- $43,362
- Composite
- 22.22/100
- National rank
- #8153
- State rank
- #701 of 826 in TX
Livability — San Antonio
- Score
- 80/100
- State rank
- #31
- US rank
- #1616
Category grades
Schools grade is shown separately in the Schools card above.
Census & demographics
- Census place
- San Antonio, TX
- County
- Bexar County · 1,990,555 people
- City population
- 1,806,925
- Metro
- San Antonio-New Braunfels, TX
- Population (ZIP)
- 22,232
- Household income
- $59,891
- Rent vs Own
- Severe rent burden
- 721.0
Population outlook (Bexar County) Hauer SSP2
- Today (2025)
- 2,336,851 people
- By 2030
- 2,560,728 · +9.6%
- By 2040
- 3,020,569 · +29.3%
- By 2050
- 3,493,522 · +49.5%
- By 2075
- 4,668,459 · +99.8%
- By 2100
- 5,533,242 · +136.8%
Race, ethnicity, and origin ACS 2023
- Neighborhood character
- Predominantly Hispanic (90%)
- Race & ethnicity
- Hispanic / Latino 90% Two or more races 24% White 6% Native American 2% Asian 2%
- Hispanic origin (detail)
- Mexican 75%
- Common ancestry
- Italian 1%
- Foreign-born
- 18% · Canada, Vietnam, China
- Languages at home
- 44% English-only · Spanish 55% Chinese 1%
Political lean MEDSL · Bexar
- 2024 margin
- Lean D (+9.8) · D 54.3% · R 44.6% · Other 1.1%
- 2008→2024 swing
- +4.2pp toward D · 2008: 5.6pp · 2024: 9.8pp
- All cycles
- 2024: D+9.8 2020: D+18.2 2016: D+13.5 2012: D+4.6 2008: D+5.6
Not yet ingested
- Civics
- —
Market trends
- HPI YoY
- ▲ 29.95%
- Current HPI
- 272.0709
- Rent YoY
- ▲ 0.83%
- Metro
- San Antonio-New Braunfels, TX
- State GDP YoY
- ▲ 3.95%
- F500 in state
- 110
Industry mix (Fortune 500 HQ in TX)
| Industry | F500 HQs | Revenue |
|---|---|---|
| Energy | 16 | $1,198B |
|
||
| Technology | 5 | $198B |
|
||
| Engineering / Construction | 4 | $72B |
|
||
| Energy Services | 3 | $60B |
|
||
| Utilities | 3 | $41B |
|
||
| Healthcare | 2 | $330B |
|
||
Price history
1 event — show timeline
- 2026-02-07 Listed $209,990 Zillow
Cash-flow waterfall
monthlySold comps — $/sqft
last 12 mo · ≤1 miLoading sold comps…