 🏗️ New Construction
14522 Banks Ct · Lakewood Ranch, FL
Flood risk No data
- FEMA flood zone
- —
- Chance of flooding over 30 yrs
- —
- Est. flood insurance / yr
- —
Fire risk No data
- Est. fire insurance / yr
- —
Heat risk No data
- Hot days now (above threshold)
- —
- Hot days in 30 yrs
- —
Wind risk No data
- Chance of severe wind over 30 yrs
- —
Air-quality risk No data
- Unhealthy air days now
- —
- Unhealthy air days in 30 yrs
- —
Risk factors via First Street. Map © Google.
Why this score? — see what drove the F grade
The composite is a weighted blend of 9 inputs, each scored 0–100. Each bar is that input's sub-score; the figure is the points it added to the 100-point composite (weight × sub-score).
- ARV discount +7.5/15.0
- Cash flow +5.0/30.0
- Schools +4.4/10.0
- Livability +2.5/5.0
- Rent growth +2.3/5.0
- 1% rule +1.0/10.0
- Condition / age +1.0/5.0
- DSCR +0.0/10.0
- Appreciation +0.0/10.0
$499,999
🖨 Deal sheet (PDF) 📄 Offer letter ✓ Due diligence
Listing remarks
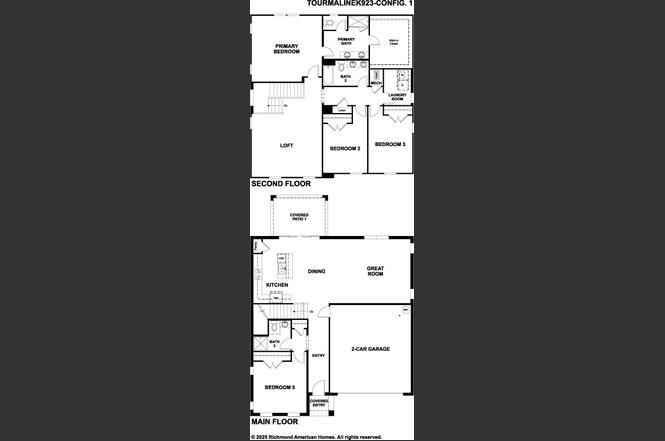
Under Construction. Discover the epitome of modern living with this stunning Tourmaline Floorplan, offering 2679 square feet of expertly designed space. This home features 4 spacious bedrooms and 3 luxurious bathrooms, ensuring comfort and style at every turn. Step inside to find elegant quartz countertops throughout, complemented by sleek tile flooring in common areas and plush carpeting in the bedrooms. Enjoy the sophisticated touch of soft-close cabinets and stylish cabinet hardware, adding a perfect blend of functionality and flair. Full 8ft tall doors through out. In wall pest tube system for ease of access. The home comes fully equipped with essential appliances, including a refriger
Key facts
- Quartz countertops
- Soft-close cabinets
- Tall ceilings
Tags
Property features AI
Finance
- Other: Lot size approximately 0.14 acres; Living area reported by builder: 2,670 sq ft (building area total 3,316 sq ft); Permit number: BLD2508-5437; Lot size in square meters: 557; Total acreage: less than 1/4 acre
- HOA & community: HOA: Richmond American (monthly HOA $119; annual fee $1,428); Association amenities: playground, trails; Pets allowed
Exterior
- Parking: Attached 2-car garage with garage door opener
- Security: Smoke detector(s)
- Utilities: Public water; Public sewer; Electricity connected; Water connected; Sewer connected; Cable available; Broadband / high-speed internet available
- Home design: Single family residence; Under construction (projected completion: 2026-03-31); Two stories; Southwest facing; Builder model: TOURMALINE
- Construction: New construction; Stucco and vinyl siding exterior; Shingle roof; Foundation: block/other/slab; Builder: Richmond American Homes (License CBC1258254)
- Exterior features: Covered patio; Patio; Sliding doors; Cul-de-sac lot; Publicly maintained asphalt/paved road; Irrigation equipment
Interior
- Kitchen: Dishwasher; Disposal; Microwave; Range; Electric water heater
- Bedrooms: 4 bedrooms
- Flooring: Carpet; Ceramic tile
- Bathrooms: 3 full bathrooms
- Heating & cooling: Central heating (electric); Central air conditioning
- Interior features: High ceilings; Living room / dining room combo; Open floorplan; Solid surface countertops; Split bedroom layout; Thermostat; Walk-in closets; Smoke detector(s)
- Laundry & utility: Dedicated laundry room
Neighborhood map
What this means for you Summary
Snapshot
- This is a 4-bed/3.0-bath single-family listed at $500k. Condition is rated poor.
Deal economics
- At list price, monthly cash flow is $-2k ($-21k/yr) — negative.
- To cash-flow at today's rent, offer at most $493k (1.5% below list).
- To meet the 1% rule (rent ≥ 1% of price), the offer needs to be $446k (10.8% below list).
- Recommended offer: $440k (12.0% below list) — sets the bar for market timing.
Location & tenants
- Location reads: area grade F — affects rentability + tenant quality, not the cash-flow math above.
- Manatee (suburban): math 54% / reading 50% proficiency, ranked #26 of 73 in FL (top 36%) — acceptable for families but not a draw, mixed tenant base, ~2y average lease.
- Zoned schools: Annie Lucy Williams Elementary School (math 80% / reading 73%, grade A, #185 of 2,144 statewide, top 9%, 798 students, 31% FRL); Buffalo Creek Middle School (math 59% / reading 51%, grade B-, #180 of 571 statewide, top 32%, 1,127 students, 44% FRL); Palmetto High School (math 22% / reading 36%, grade F, #456 of 667 statewide, top 68%, 2,100 students, 61% FRL).
- Market conditions: Rents soft (-0.9%/yr); 2194 active listings in the ZIP; 3 comparable units currently listed for rent nearby; rentals at typical pace (median 23d on market — plan ~3-4 weeks tenant-placement turnaround); high-income renter base; 7,472 units permitted in Manatee County in 2024 (1,782 in 5+ unit buildings).
- At $4,460/mo this rent would consume 47% of the median local household income ($114k/yr) (locally 219% of renters already pay >50% of income on rent) — very limited rent-growth headroom before tenants either downsize or default.
Forward outlook
- Local home prices are declining (-3.0%/yr); year-one equity from $5k of loan paydown is wiped out by about $22k of value loss. Plan a longer hold.
- Manatee County population projected at +43% by 2050 — long-run rental-demand tailwind backs the buy-and-hold thesis.
Negotiation context
- It's been on market 139 days — a 12% lower offer ($440k) is reasonable based on typical stale-listing flexibility.
Questions for the listing agent
- What do current leases actually rent for vs. the listed asking? Can we see a recent rent roll and the last 12 months of T-12 income?
- It's been on market 139 days. Have you received any prior offers? Is the seller open to a 12% concession, seller financing, or rate buy-down credit?
- Have any recent inspections been done? Can we get a copy of the seller's disclosures and any deferred-maintenance estimates?
- What does the HOA fee cover, when was the last increase, and are there any pending special assessments or reserve-fund shortfalls?
- Why hasn't it sold? Are there any deal-killer items the seller is aware of (foundation, flood, title, zoning, code violations)?
- Is there a deadline driving the sale (1031 exchange, divorce, estate, relocation)? That informs how much negotiation room exists.
- The area grade is low — what's the realistic commute time and amenity access for the typical tenant pool here? Any planned neighborhood developments (good or bad) we should know about?
- What's the average days-on-market for RENTAL listings here right now (not sales)? A rising rental-DOM trend means longer vacancies and softer asking-rent achievability than the comps imply.
- What's the recent tenant-quality profile in this submarket — average credit score on applications, eviction rate, late-payment / NSF rate, and stable-employment percentage? A property-management company in the area should have these aggregated.
- How much new for-sale + rental construction is in the pipeline within 1–3 miles? Heavy new supply typically softens prices + rents 12–24 months out; constrained supply supports both.
Investment metrics
- 1% rule
- 0.60% ✗
- Cap rate
- 3.48%
- Cash-on-cash
- -10.03%
- DSCR
- 0.55
- GRM
- 13.9
CMA / ARV
- ARV (on-the-fly)
- $744,930
- Comps found
- 12
Show comp detail 12 sales within ~0.75 mi
| Address | Dist | Beds/Ba | Sqft | Sold | Price | $/sf | Match |
|---|---|---|---|---|---|---|---|
| 15451 27th Ct E | 0.54mi | 4/3.0 | 2,628 (-2%) | 2mo | $734,500 | $279 | 71 |
| 15425 Mulholland Rd | 0.38mi | 4/2.0 | 2,565 (-4%) | 4mo | $845,000 | $329 | 68 |
| 15435 27th Ct E | 0.46mi | 4/3.0 | 2,559 (-4%) | 11mo | $950,000 | $371 | 62 |
| 15449 Mulholland Rd | 0.52mi | 4/3.0 | 2,672 (+0%) | 18mo | $799,000 | $299 | 61 |
| 13503 22nd Ct E | 0.65mi | 5/3.0 (+1) | 2,754 (+3%) | 6mo | $629,000 | $228 | 54 |
| 1825 Twin Rivers Trl | 0.43mi | 4/3.0 | 2,309 (-14%) | 11mo | $730,000 | $316 | 49 |
| 2410 Twin Rivers Trl | 0.29mi | 3/3.0 (-1) | 2,914 (+9%) | 22mo | $680,000 | $233 | 48 |
| 15519 29th St E | 0.65mi | 4/3.0 | 2,979 (+12%) | 4mo | $785,000 | $264 | 47 |
| 15923 29th St E | 0.62mi | 4/3.0 | 2,972 (+11%) | 8mo | $698,000 | $235 | 45 |
| 1819 151st Ter E | 0.57mi | 4/3.0 | 3,003 (+12%) | 13mo | $850,000 | $283 | 42 |
| 15518 29th St E | 0.67mi | 4/3.5 | 2,987 (+12%) | 12mo | $819,000 | $274 | 38 |
| 15914 29th St E | 0.67mi | 3/3.0 (-1) | 2,288 (-14%) | 16mo | $620,000 | $271 | 26 |
Match score weights: distance 35% · size 25% · config 20% · recency 20%. Top-matched comps best support the ARV.
Projected returns pro-forma
-3.0% appreciation · 0.0% rent growth · sell at horizon
- IRR
- -37.7%
- Equity multiple
- -0.17×
- Total profit
- $-244,674
- Equity at exit
- $111,071
- IRR
- -79.0%
- Equity multiple
- -0.95×
- Total profit
- $-405,976
- Equity at exit
- $64,408
Cash invested: $208,580 (down + closing). Projections, not guarantees.
Landlord ↔ Tenant lean methodology
- Overall (STATE)
- 87 Strongly Landlord-Friendly
- State Florida
- 87 Strongly Landlord-Friendly · R+3
- County
- — inherits STATE
- City
- — inherits STATE
ZIP-level market 34219
- Home prices YoY
- -23.7%
- Rents YoY
- -0.9%
- Active inventory
- 2194
- Price-to-rent
- 9.3×
Monthly cashflow live
- Estimated rent
- $4,460 medium interval (Pro) →
- Mortgage (P&I)
- −$3,906
- Tax est. 1.5%
- −$931 /mo · $11,174/yr
- Insurance
- −$310
- HOA
- −$119
- Vacancy / Maint / Mgmt
- −$937
- Net cashflow
- $-1,743
Break-even live
Sensitivity live
| Price | -10% $-1,228 | -5% $-1,486 | +0% $-1,743 | +5% $-2,001 | +10% $-2,258 |
|---|---|---|---|---|---|
| Rent | -10% $-2,096 | -5% $-1,919 | +0% $-1,743 | +5% $-1,567 | +10% $-1,391 |
| Rate | -1.0pp $-1,368 | -0.5pp $-1,554 | base $-1,743 | +0.5pp $-1,936 | +1.0pp $-2,133 |
UW: 25.0% down · 7.5% · 30yr · 1.5% tax · 5.0% vac · 8.0% maint · 8.0% mgmt
Financing live
Cash to close
- Down payment
- $186,232
- Closing costs
- $22,348
- Reserves months
- —
- Total cash needed
- —
Loan-product check · same deal, 3 products live
Conventional
25% down · 7.5% · 30yr
- Down + closing
- —
- Monthly P&I
- —
- Monthly cashflow
- —
- DSCR
- —
- Eligible?
- —
Personal DTI + credit; lowest rate.
DSCR
20% down · 8.5% · 30yr
- Down + closing
- —
- Monthly P&I
- —
- Monthly cashflow
- —
- DSCR
- —
- Eligible?
- —
No personal income docs; deal must DSCR.
Hard money
10% down · 12.0% · 12mo
- Down + closing
- —
- Monthly P&I
- —
- Monthly cashflow
- —
- DSCR
- —
- Eligible?
- —
Short-term bridge; refi at stabilization.
Rent comps 3 comps
| Address | Beds | Baths | Sqft | Rent | $/sqft | DOM | Units | Dist |
|---|---|---|---|---|---|---|---|---|
| 16457 Woodside Gln Parrish, FL | 4.0 | 3.0 | 2748 | $3,800 | $1.38 | 25d | 1 | 1.30mi |
| 13744 Old Creek Ct Parrish, FL | 3.0 | 2.5 | 2274 | $3,000 | $1.32 | 23d | 1 | 1.32mi |
| 1043 145th Street Cir NE Bradenton, FL | 3.0 | 3.0 | 2600 | $7,000 | $2.69 | 23d | 1 | 1.33mi |
HOA detail
- Monthly dues
- $119 · $1,428/yr
Listing history 17 events
-
2026-06-22days on market $499,999 Active 139 DOM
-
2026-06-18days on market $499,999 Active 136 DOM
-
2026-06-17days on market $499,999 Active 135 DOM
-
2026-06-16days on market $499,999 Active 134 DOM
-
2026-06-15days on market $499,999 Active 133 DOM
-
2026-06-13days on market $499,999 Active 131 DOM
-
2026-06-13days on market $499,999 Active 130 DOM
-
2026-06-10days on market $499,999 Active 128 DOM
-
2026-06-09days on market $499,999 Active 127 DOM
-
2026-06-08days on market $499,999 Active 126 DOM
-
2026-06-08days on market $499,999 Active 125 DOM
-
2026-06-03days on market $499,999 Active 121 DOM
-
2026-06-02days on market $499,999 Active 120 DOM
-
2026-06-01days on market $499,999 Active 119 DOM
-
2026-05-31days on market $499,999 Active 118 DOM
-
2026-04-24price $499,999
-
2026-02-02$509,999 Active
ⓘ Source: listings_history table (triggers on properties + properties_extension) + one-shot
backfill from property_details.listing_events for pre-trigger history.
Nearby sold comps map
Loading sold comps map…
Walkable amenities ~0.75 mi
Loading nearby amenities…
Taxation est. · year 1
- Rental income
- $53,525
- − Mortgage interest
- −$41,728
- − Property taxes
- −$11,174
- − Insurance
- −$3,725
- − Repairs & maintenance
- −$4,282
- − Management
- −$4,282
- − HOA
- −$1,428
- − Depreciation
- −$21,671
- Taxable loss
- −$34,764
- Est. tax savings @ 24.0%
- +$8,343
- After-tax cash flow
- $-12,576/yr
For passive investors: Depreciation is non-cash, so a rental often shows a tax loss while cash-flowing — sheltering income. Rental losses are passive: they offset passive income freely, and up to $25,000/yr can offset ordinary (W-2) income if you actively participate and your MAGI is under $100k (phasing out to $0 by $150k); unused losses carry forward. On sale, claimed depreciation is recaptured at up to 25%, and gains may owe capital-gains tax (a 1031 exchange can defer both). Figures are a year-1 estimate at your 24.0% rate — not tax advice; consult a CPA.
Condition & rehab AI · 1 photo
This single-family home is under construction but requires extensive repairs and maintenance, including a major roof and exterior renovation, landscaping, and painting. Immediate action is needed to address the structural and aesthetic issues before it can be considered move-in ready.
Repairs flagged
- Major roof — Visible moss and potential water damage
- Major exterior siding — Visible moss and potential water damage
- Major landscaping — Overgrown vegetation
Value-add opportunities
- Both landscaping and curb appeal — Aesthetic improvements can enhance both resale and rental value
- Both roof and exterior repairs — Structural repairs are necessary for safety and value
- Both painting — Interior painting can improve the home's appearance and value
Renovation cost estimate screening
| Repair item | Severity | Est. cost |
|---|---|---|
| roof · Visible moss and potential water damage | Major | $15,000–50,000 |
| exterior siding · Visible moss and potential water damage | Major | $15,000–50,000 |
| landscaping · Overgrown vegetation | Major | $15,000–50,000 |
| Total estimated repair cost · 3 items | $45,000–150,000 |
Value-add ROI direction
- Both landscaping and curb appeal — Aesthetic improvements can enhance both resale and rental value ↑
- Both roof and exterior repairs — Structural repairs are necessary for safety and value ↑
- Both painting — Interior painting can improve the home's appearance and value ↑
ⓘ Cost ranges are severity-bucket heuristics (US national rule-of-thumb). Get contractor quotes + a written scope before underwriting a rehab budget.
Schools (NCES district)
- District
- Manatee
- NCES district ID
- 1201230
- Math proficiency
- 54% ▼ -6.00%
- Reading proficiency
- 50% ▼ -2.00%
- Median HH income
- $49,607
- Composite
- 44.43/100
- National rank
- #2806
- State rank
- #26 of 73 in FL
Livability — Lakewood Ranch
No livability data for this city. (Only ~50 U.S. cities are tracked.)
Census & demographics
- County
- Manatee County · 416,364 people
- City population
- 33,296
- Metro
- North Port-Sarasota-Bradenton, FL
- Population (ZIP)
- 33,296
- Household income
- $113,773
- Rent vs Own
- Severe rent burden
- 219.0
Population outlook (Manatee County) Hauer SSP2
- Today (2025)
- 447,342 people
- By 2030
- 488,911 · +9.3%
- By 2040
- 567,934 · +27.0%
- By 2050
- 637,995 · +42.6%
- By 2075
- 781,970 · +74.8%
- By 2100
- 848,272 · +89.6%
Race, ethnicity, and origin ACS 2023
- Neighborhood character
- Predominantly White (75%)
- Race & ethnicity
- White 75% Hispanic / Latino 11% Two or more races 8% Black 8% Asian 2%
- Hispanic origin (detail)
- Mexican 2% Puerto Rican 3%
- Common ancestry
- Romanian 4% Hispanic 2% Russian 2%
- Foreign-born
- 10% · Canada, Dominican Republic, Jamaica
- Languages at home
- 88% English-only · Spanish 7% French/Haitian/Cajun 2% Other Asian/Pacific 1%
Political lean MEDSL · Manatee
- 2024 margin
- Strong R (+23.5) · D 37.9% · R 61.4%
- 2008→2024 swing
- -16.5pp toward R · 2008: -7.0pp · 2024: -23.5pp
- All cycles
- 2024: R+23.5 2020: R+16.1 2016: R+17.1 2012: R+12.5 2008: R+7.0
Not yet ingested
- Civics
- —
Market trends
- HPI YoY
- ▼ -84.45%
- Current HPI
- 271.7131
- Rent YoY
- ▼ -0.95%
- Metro
- North Port-Sarasota-Bradenton, FL
- State GDP YoY
- ▲ 3.28%
- F500 in state
- 36
Industry mix (Fortune 500 HQ in FL)
| Industry | F500 HQs | Revenue |
|---|---|---|
| Industrial Technology | 2 | $29B |
|
||
| Insurance | 2 | $17B |
|
||
| Retail | 1 | $60B |
|
||
| Technology Distribution | 1 | $58B |
|
||
| Homebuilding | 1 | $35B |
|
||
| Technology Manufacturing | 1 | $35B |
|
||
Price history
-2.0% since first listed2 events — show timeline
- 2026-04-24 Price Changed $499,999 Stellar MLS as Distributed by MLS Grid
- 2026-02-02 Listed $509,999 Stellar MLS as Distributed by MLS Grid
Cash-flow waterfall
monthlySold comps — $/sqft
last 12 mo · ≤1 miLoading sold comps…