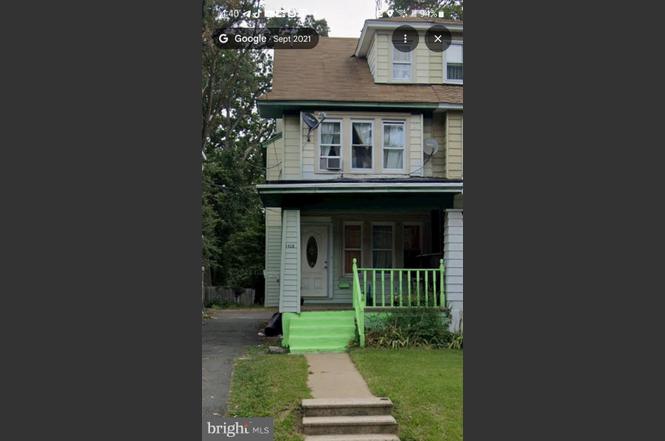
1428 Stuyvesant Ave · Trenton, NJ
Flood risk 1/10 · Minimal
- FEMA flood zone
- X (unshaded)
- Chance of flooding over 30 yrs
- 0.0%
- Est. flood insurance / yr
- $507 – $1,088
Fire risk 1/10 · Minimal
- Est. fire insurance / yr
- $526 – $976
Heat risk 6/10 · Moderate
- Hot days now (above 102°F)
- 7 days/yr
- Hot days in 30 yrs
- 15 days/yr
Wind risk 6/10 · Moderate
- Chance of severe wind over 30 yrs
- 27.0%
Air-quality risk 5/10 · Moderate
- Unhealthy air days now
- 6 days/yr
- Unhealthy air days in 30 yrs
- 8 days/yr
Risk factors via First Street. Map © Google.
Why this score? — see what drove the C+ grade
The composite is a weighted blend of 9 inputs, each scored 0–100. Each bar is that input's sub-score; the figure is the points it added to the 100-point composite (weight × sub-score).
- Cash flow +22.8/30.0
- ARV discount +15.0/15.0
- DSCR +7.3/10.0
- 1% rule +6.4/10.0
- Livability +3.8/5.0
- Rent growth +3.2/5.0
- Condition / age +2.5/5.0
- Schools +0.7/10.0
- Appreciation +0.0/10.0
$245,000
🖨 Deal sheet (PDF) 📄 Offer letter ✓ Due diligence
Listing remarks
PRICE REDUCED FOR SELL QUICK!!!!! * * * * CALLING ALL INVESTORS * * * * This charming 1924 Colonial twin home offers a solid investment opportunity with 1,404 sq. ft. of potential. Featuring four spacious bedrooms and 1.5 bathrooms, the layout is ideal for maximizing rental income. The gourmet kitchen is equipped with essential appliances, including a microwave, single oven, and refrigerator, appealing to modern tenants. The full unfinished basement provides ample storage or potential for future expansion, enhancing property value. A cozy fireplace adds character, while hardwood and carpet flooring create a warm ambiance. Exterior highlights include a deck and porch, perfect for outd
Key facts
- Deck and porch
- Asphalt driveway
- Gourmet kitchen
Tags
Property features AI
Exterior
- Parking: Asphalt driveway; Driveway parking
- Utilities: Public water; No septic system; Natural gas available; Electric available; Phone available
- Home design: Semi-detached; Two floors in unit; Entry level is 1
- Construction: Frame construction; Brick/mortar foundation; Above-grade structures
- Exterior features: Sidewalks; Deck(s); Porch(es)
Interior
- Kitchen: Microwave; Single oven; Refrigerator
- Bedrooms: Three bedrooms on the first upper level; One bedroom on the second upper level
- Flooring: Carpet; Hardwood
- Bathrooms: One full bathroom on upper level; One half bathroom on main level
- Heating & cooling: Radiator heat (natural gas); Window cooling units; Electric hot water
- Interior features: Gourmet kitchen; Full unfinished basement; Fireplace (1)
- Laundry & utility: Laundry on main floor
Neighborhood map
What this means for you Summary
Snapshot
- This is a 4-bed/1.5-bath single-family listed at $245k.
Deal economics
- At list price, monthly cash flow is $425 ($5k/yr) — positive.
- The deal already cash-flows at list — no discount required.
- Meets the 1% rule at list price ($3k rent vs $245k).
- Recommended offer: $216k (12.0% below list) — sets the bar for market timing.
- Cap rate 8.4% vs local median 6.0% in Trenton — top-decile yield for the area; either an underpriced asset or a hidden risk that comps aren't pricing in. Stress-test before assuming the spread holds.
Location & tenants
- Location reads 76/100 on livability (#133 in NJ, #3,533 nationally) — a middle-class / working-renter tenant base. Strengths: amenities A+, commute A+, health & safety A+; Watch: schools F, crime F, employment F.
- Trenton Public School District (urban): math 2% / reading 16% proficiency, ranked #471 of 472 in NJ (top 100%) — low school quality limits family demand, transient renter base, plan for 1-2y turnover; 80% free/reduced lunch — lower-income household profile, screen leases tightly.
- Market conditions: Rents rising (+2.6%/yr); 144 active listings in the ZIP; 15 comparable units currently listed for rent nearby; rentals at typical pace (median 15d on market — plan ~3-4 weeks tenant-placement turnaround); 2,256 units permitted in Mercer County in 2024 (1,303 in 5+ unit buildings).
- At $2,786/mo this rent would consume 66% of the median local household income ($50k/yr) (locally 2116% of renters already pay >50% of income on rent) — very limited rent-growth headroom before tenants either downsize or default.
Forward outlook
- Local home prices are declining (-3.0%/yr); year-one equity from $2k of loan paydown is wiped out by about $7k of value loss. Plan a longer hold.
- Mercer County population projected at +4% by 2050 — modest demand growth; plan on rents tracking national, not racing it.
Negotiation context
- It's been on market 273 days — a 12% lower offer ($216k) is reasonable based on typical stale-listing flexibility.
- 3 sale attempts since 12y ago; this cycle's ask has dropped $76k (24%) from the opening price — seller is motivated, your offer sets the floor, not the list.
- Current owner paid $64k; list at $245k implies a 283% gain — meaningful room to come down on a strong offer.
Risks & watch-outs
- Watch-outs: built in 1924 — expect roof / HVAC / electrical / plumbing capex.
- Climate carrying-cost: major wind risk, 27% chance of damaging wind over 30y; extreme-heat days projected 7→15/yr by 2055 (HVAC capex compounding) — expect insurance premiums to compound above CPI over the hold.
Questions for the listing agent
- It's been on market 273 days. Have you received any prior offers? Is the seller open to a 12% concession, seller financing, or rate buy-down credit?
- Built in 1924 — when were the roof, HVAC, electrical panel, plumbing, and water heater last replaced?
- Why hasn't it sold? Are there any deal-killer items the seller is aware of (foundation, flood, title, zoning, code violations)?
- Is there a deadline driving the sale (1031 exchange, divorce, estate, relocation)? That informs how much negotiation room exists.
- Schools are F-rated, which usually means shorter tenancies and higher turnover. Who's the typical renter profile here, and what's been the actual vacancy rate?
- Crime grade is F in this area — have there been break-ins, vandalism, or insurance claims at this property in the last 3 years? What carrier currently insures it and at what premium?
- What's the average days-on-market for RENTAL listings here right now (not sales)? A rising rental-DOM trend means longer vacancies and softer asking-rent achievability than the comps imply.
- What's the recent tenant-quality profile in this submarket — average credit score on applications, eviction rate, late-payment / NSF rate, and stable-employment percentage? A property-management company in the area should have these aggregated.
- How much new for-sale + rental construction is in the pipeline within 1–3 miles? Heavy new supply typically softens prices + rents 12–24 months out; constrained supply supports both.
Investment metrics
- 1% rule
- 1.14% ✓
- Cap rate
- 8.37%
- Cash-on-cash
- 7.43%
- DSCR
- 1.33
- GRM
- 7.3
CMA / ARV
- ARV (on-the-fly)
- $367,848
- Comps found
- 12
Show comp detail 12 sales within ~0.75 mi
| Address | Dist | Beds/Ba | Sqft | Sold | Price | $/sf | Match |
|---|---|---|---|---|---|---|---|
| 12 Lasalle Ave | 0.58mi | 3/1.0 (-1) | 1,394 (-1%) | 3mo | $120,000 | $86 | 62 |
| 325 Concord Ave | 0.41mi | 3/2.5 (-1) | 1,452 (+3%) | 10mo | $377,400 | $260 | 58 |
| 31 N Lenape Ave | 0.58mi | 3/1.0 (-1) | 1,364 (-3%) | 7mo | $301,050 | $221 | 55 |
| 323 Concord Ave | 0.40mi | 4/2.0 | 1,593 (+14%) | 3mo | $258,100 | $162 | 55 |
| 318 Sutherland Rd | 0.58mi | 3/1.5 (-1) | 1,440 (+3%) | 10mo | $377,500 | $262 | 55 |
| 404 Latona Ave | 0.40mi | 3/2.5 (-1) | 1,484 (+6%) | 11mo | $440,000 | $296 | 54 |
| 524 Greenway Ave | 0.60mi | 3/1.0 (-1) | 1,440 (+3%) | 9mo | $400,000 | $278 | 53 |
| 840 Parkside Ave | 0.63mi | 3/2.5 (-1) | 1,500 (+7%) | 2mo | $400,000 | $267 | 49 |
| 23 Cadwalader Ter | 0.73mi | 3/2.0 (-1) | 1,344 (-4%) | 5mo | $325,000 | $242 | 48 |
| 429 Greenway Ave | 0.48mi | 3/1.0 (-1) | 1,266 (-10%) | 11mo | $347,500 | $274 | 45 |
| 525 Cleardale Ave | 0.69mi | 3/1.5 (-1) | 1,545 (+10%) | 4mo | $400,000 | $259 | 43 |
| 25 Preston Ave | 0.60mi | 3/1.0 (-1) | 1,200 (-14%) | 2mo | $325,000 | $271 | 40 |
Match score weights: distance 35% · size 25% · config 20% · recency 20%. Top-matched comps best support the ARV.
Projected returns pro-forma
-3.0% appreciation · 2.6% rent growth · sell at horizon
- IRR
- -5.4%
- Equity multiple
- 0.80×
- Total profit
- $-13,678
- Equity at exit
- $36,530
- IRR
- 3.8%
- Equity multiple
- 1.27×
- Total profit
- $18,748
- Equity at exit
- $21,183
Cash invested: $68,600 (down + closing). Projections, not guarantees.
Landlord ↔ Tenant lean methodology
- Overall (STATE)
- 21 Tenant-Leaning
- State New Jersey
- 21 Tenant-Leaning · D+6
- County
- — inherits STATE
- City
- — inherits STATE
ZIP-level market 08618
- Rents YoY
- 2.6%
- Active inventory
- 144
- Price-to-rent
- 7.3×
Monthly cashflow live
- Estimated rent
- $2,786 high interval (Pro) →
- Mortgage (P&I)
- −$1,285
- Tax from tax record
- −$389 /mo · $4,671/yr
- Insurance
- −$102
- HOA
- −$0
- Vacancy / Maint / Mgmt
- −$585
- Net cashflow
- $425
Break-even live
Sensitivity live
| Price | -10% $563 | -5% $494 | +0% $425 | +5% $355 | +10% $286 |
|---|---|---|---|---|---|
| Rent | -10% $205 | -5% $315 | +0% $425 | +5% $535 | +10% $645 |
| Rate | -1.0pp $548 | -0.5pp $487 | base $425 | +0.5pp $361 | +1.0pp $297 |
UW: 25.0% down · 7.5% · 30yr · 1.5% tax · 5.0% vac · 8.0% maint · 8.0% mgmt
Financing live
Cash to close
- Down payment
- $61,250
- Closing costs
- $7,350
- Reserves months
- —
- Total cash needed
- —
Loan-product check · same deal, 3 products live
Conventional
25% down · 7.5% · 30yr
- Down + closing
- —
- Monthly P&I
- —
- Monthly cashflow
- —
- DSCR
- —
- Eligible?
- —
Personal DTI + credit; lowest rate.
DSCR
20% down · 8.5% · 30yr
- Down + closing
- —
- Monthly P&I
- —
- Monthly cashflow
- —
- DSCR
- —
- Eligible?
- —
No personal income docs; deal must DSCR.
Hard money
10% down · 12.0% · 12mo
- Down + closing
- —
- Monthly P&I
- —
- Monthly cashflow
- —
- DSCR
- —
- Eligible?
- —
Short-term bridge; refi at stabilization.
Rent comps 15 comps
| Address | Beds | Baths | Sqft | Rent | $/sqft | DOM | Units | Dist |
|---|---|---|---|---|---|---|---|---|
| 129 Clearfield Ave Trenton, NJ | 4.0 | 1.5 | 1358 | $3,000 | $2.21 | 14d | 1 | 0.63mi |
| 830 Lower Ferry Rd Ewing, NJ | 3.0 | 2.0 | 1438 | $2,975 | $2.07 | 15d | 1 | 0.89mi |
| 20 N Overbrook Ave Unit B Trenton, NJ | 3.0 | 1.0 | 1518 | $2,300 | $1.52 | 14d | 1 | 0.99mi |
| 510 N Hermitage Ave Trenton, NJ | 5.0 | 1.5 | 1316 | $2,300 | $1.75 | 0d | 1 | 1.00mi |
| 34 Western Ave Ewing Township, NJ | 1.0–3.0 | 1.0–1.5 | 832 | $2,685 | $3.23 | 15d | 3 | 1.05mi |
| 649 W State St Trenton, NJ | 5.0 | 2.0 | 1870 | $2,900 | $1.55 | 14d | 1 | 1.11mi |
| 600 Artisan St Unit 126 Trenton, NJ | 3.0 | 2.0 | 1392 | $2,650 | $1.90 | 21d | 1 | 1.13mi |
| 600 Artisan St Trenton, NJ | 3.0 | 2.0 | 1392 | $2,650 | $1.90 | 14d | 3 | 1.13mi |
| 92 Pennwood Dr Ewing, NJ | 4.0 | 3.0 | 1702 | $3,850 | $2.26 | 15d | 1 | 1.18mi |
| 117 Rutledge Ave Ewing, NJ | 4.0 | 1.0 | 1260 | $2,800 | $2.22 | 22d | 1 | 1.25mi |
| 1008 Terrace Blvd Ewing, NJ | 4.0 | 1.0 | 1116 | $2,850 | $2.55 | 15d | 1 | 1.33mi |
| 1100 Prospect St Unit 1 Ewing Township, NJ | 3.0 | 1.0 | 1100 | $2,000 | $1.82 | 22d | 1 | 1.35mi |
| 103 Pennsylvania Ave Ewing, NJ | 3.0 | 1.0 | 1200 | $2,600 | $2.17 | 15d | 1 | 1.38mi |
| 1062 Terrace Blvd Ewing, NJ | 4.0 | 1.0 | 1116 | $2,600 | $2.33 | 15d | 1 | 1.41mi |
| 319 Rutherford Ave Trenton, NJ | 4.0 | 2.0 | 1100 | $2,200 | $2.00 | 22d | 1 | 1.42mi |
Listing history 27 events
-
2026-06-18days on market $245,000 Active 273 DOM
-
2026-06-17days on market $245,000 Active 272 DOM
-
2026-06-16days on market $245,000 Active 271 DOM
-
2026-06-15days on market $245,000 Active 270 DOM
-
2026-06-14days on market $245,000 Active 268 DOM
-
2026-06-10days on market $245,000 Active 265 DOM
-
2026-06-09days on market $245,000 Active 264 DOM
-
2026-06-08days on market $245,000 Active 263 DOM
-
2026-06-07days on market $245,000 Active 262 DOM
-
2026-06-03days on market $245,000 Active 258 DOM
-
2026-06-02days on market $245,000 Active 257 DOM
-
2026-06-01days on market $245,000 Active 256 DOM
-
2026-05-31days on market $245,000 Active 255 DOM
-
2026-05-30days on market $245,000 Active 254 DOM
-
2026-05-14price $245,000
-
2026-02-19price $280,999
-
2025-10-16price $285,999
-
2025-09-28price $289,999
-
2025-09-23price $310,999
-
2025-09-18$320,999 Active
-
2020-01-28historical
-
2019-10-23price $190,000
-
2019-10-23price $190,000
-
2019-10-01$225,000 Active
-
2015-09-22historical
-
2014-09-22$75,000
-
1996-10-28soldstatus $64,000
ⓘ Source: listings_history table (triggers on properties + properties_extension) + one-shot
backfill from property_details.listing_events for pre-trigger history.
Tax reassessment forecast NJ · Partial reset (capped growth)
- Current annual tax
- $4,671 · $389/mo
- Projected year-2 tax
- $5,386 · $449/mo
- Expected delta
- +$715/yr (+$60/mo · 15.3%)
ⓘ Screening estimate from a state-policy table — verify with the county assessor before closing.
Climate risk First Street
- Flood 1/10 Low FEMA zone X (unshaded) · 0% chance over 30 yrs
- Wildfire 1/10 Low
- Heat 6/10 Major 7 d/yr ≥102°F today · 15 d/yr by 30 yrs out
- Wind 6/10 Major 27% chance of damaging wind over 30 yrs
- Air quality 5/10 Major 6 unhealthy d/yr today · 8 by 30 yrs out
Nearby sold comps map
Loading sold comps map…
Walkable amenities ~0.75 mi
Loading nearby amenities…
Taxation est. · year 1
- Rental income
- $33,429
- − Mortgage interest
- −$13,724
- − Property taxes
- −$4,671
- − Insurance
- −$1,225
- − Repairs & maintenance
- −$2,674
- − Management
- −$2,674
- − Depreciation
- −$7,127
- Taxable income
- $1,334
- Est. tax owed @ 24.0%
- −$320
- After-tax cash flow
- $4,776/yr
For passive investors: Depreciation is non-cash, so a rental often shows a tax loss while cash-flowing — sheltering income. Rental losses are passive: they offset passive income freely, and up to $25,000/yr can offset ordinary (W-2) income if you actively participate and your MAGI is under $100k (phasing out to $0 by $150k); unused losses carry forward. On sale, claimed depreciation is recaptured at up to 25%, and gains may owe capital-gains tax (a 1031 exchange can defer both). Figures are a year-1 estimate at your 24.0% rate — not tax advice; consult a CPA.
Schools (NCES district)
- District
- Trenton Public School District
- NCES district ID
- 3416290
- Math proficiency
- 2% ▼ -8.00%
- Reading proficiency
- 16% ▼ -4.00%
- Median HH income
- $35,078
- Composite
- 7.31/100
- National rank
- #9956
- State rank
- #471 of 472 in NJ
Livability — Trenton
- Score
- 76/100
- State rank
- #133
- US rank
- #3533
Category grades
Schools grade is shown separately in the Schools card above.
Census & demographics
- Census place
- Trenton, NJ
- County
- Mercer County · 327,655 people
- City population
- 177,819
- Metro
- Trenton-Princeton, NJ
- Population (ZIP)
- 35,634
- Household income
- $50,390
- Rent vs Own
- Severe rent burden
- 2116.0
Population outlook (Mercer County) Hauer SSP2
- Today (2025)
- 381,395 people
- By 2030
- 384,640 · +0.9%
- By 2040
- 391,431 · +2.6%
- By 2050
- 397,845 · +4.3%
- By 2075
- 417,281 · +9.4%
- By 2100
- 420,327 · +10.2%
Race, ethnicity, and origin ACS 2023
- Neighborhood character
- Diverse neighborhood (Simpson 0.59)
- Race & ethnicity
- Black 59% White 19% Hispanic / Latino 16% Two or more races 7% Asian 3%
- Hispanic origin (detail)
- Mexican 1% Puerto Rican 6% Dominican 3%
- Common ancestry
- Romanian 2% Hispanic 1% Scotch-Irish 1%
- Foreign-born
- 14% · Canada, China, South Korea
- Languages at home
- 80% English-only · Spanish 10% Other Indo-European 3% Arabic 1%
Political lean MEDSL · Mercer
- 2024 margin
- Solid D (+33.9) · D 65.9% · R 32.0% · Other 2.1%
- 2008→2024 swing
- -2.2pp toward R · 2008: 36.1pp · 2024: 33.9pp
- All cycles
- 2024: D+33.9 2020: D+40.0 2016: D+36.2 2012: D+36.8 2008: D+36.1
Not yet ingested
- Civics
- —
Market trends
- HPI YoY
- ▼ -309.54%
- Current HPI
- 288.6841
- Rent YoY
- ▲ 2.60%
- Metro
- Trenton-Princeton, NJ
- State GDP YoY
- ▲ 2.05%
- F500 in state
- 34
Industry mix (Fortune 500 HQ in NJ)
| Industry | F500 HQs | Revenue |
|---|---|---|
| Consumer Goods | 3 | $31B |
|
||
| Pharmaceuticals | 2 | $153B |
|
||
| Technology | 2 | $21B |
|
||
| Insurance | 2 | $20B |
|
||
| Healthcare | 2 | $19B |
|
||
| Financial Services | 1 | $70B |
|
||
Price history
+282.8% since first listed13 events — show timeline
- 2026-05-14 Price Changed $245,000 BRIGHT MLS
- 2026-02-19 Price Changed $280,999 BRIGHT MLS
- 2025-10-16 Price Changed $285,999 BRIGHT MLS
- 2025-09-28 Price Changed $289,999 BRIGHT MLS
- 2025-09-23 Price Changed $310,999 BRIGHT MLS
- 2025-09-18 Listed $320,999 BRIGHT MLS
- 2020-01-28 Listing Removed — BRIGHT MLS
- 2019-10-23 Price Changed $190,000 CJMLS
- 2019-10-23 Price Changed $190,000 BRIGHT MLS
- 2019-10-01 Listed $225,000 BRIGHT MLS
- 2015-09-22 Listing Removed — BRIGHT MLS
- 2014-09-22 Listed $75,000 BRIGHT MLS
- 1996-10-28 Sold (Public Records) $64,000 Public Records
Property tax history
+2.3%/yrLatest (2025): $4,671 · +1.5% YoY. Source: county tax records.
Cash-flow waterfall
monthlySold comps — $/sqft
last 12 mo · ≤1 miLoading sold comps…