14 Overlook Dr · Montpelier, VT
Flood risk No data
- FEMA flood zone
- —
- Chance of flooding over 30 yrs
- —
- Est. flood insurance / yr
- —
Fire risk No data
- Est. fire insurance / yr
- —
Heat risk No data
- Hot days now (above threshold)
- —
- Hot days in 30 yrs
- —
Wind risk No data
- Chance of severe wind over 30 yrs
- —
Air-quality risk No data
- Unhealthy air days now
- —
- Unhealthy air days in 30 yrs
- —
Risk factors via First Street. Map © Google.
Why this score? — see what drove the D- grade
The composite is a weighted blend of 9 inputs, each scored 0–100. Each bar is that input's sub-score; the figure is the points it added to the 100-point composite (weight × sub-score).
- Cash flow +11.2/30.0
- Schools +5.0/10.0
- ARV discount +4.2/15.0
- Livability +4.2/5.0
- 1% rule +3.8/10.0
- Condition / age +3.8/5.0
- DSCR +3.3/10.0
- Rent growth +2.5/5.0
- Appreciation +0.0/10.0
$199,000
🖨 Deal sheet 📄 Offer letter ✓ Due diligence
Listing remarks
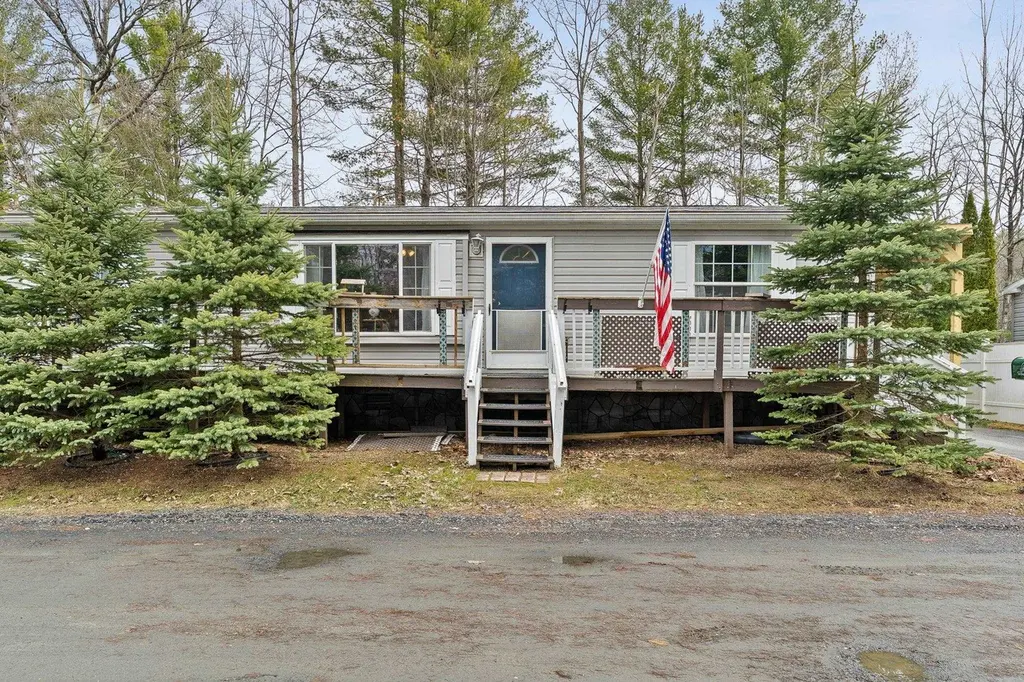
Looking for a place to call home? Welcome to Overlook Drive, Montpelier’s only single-family, condominiumized neighborhood. Offering affordable home ownership with a low quarterly condo fee that covers snow plowing, lawn mowing, and a master insurance policy. This home features 3 bedrooms, 2 full bathrooms, an eat-in kitchen with loads of counter space and cabinets, and a light-filled living room with a gas fireplace. This well-maintianed home features a new roof, new vinyl wood plank flooring, a new mini-split, and a newly constructed carport. Enjoy the private backyard, perfect for barbecues and relaxing in the sun. There is a 10 x 10 shed for your storage needs. Located just inside
Key facts
- Private backyard
- New mini-split
- New roof
Tags
Neighborhood map
What this means for you Summary
Snapshot
- This is a 3-bed/2.0-bath single-family listed at $199k. Condition is rated good.
Deal economics
- At list price, monthly cash flow is $-77 ($-919/yr) — negative.
- To cash-flow at today's rent, offer at most $188k (5.6% below list).
- To meet the 1% rule (rent ≥ 1% of price), the offer needs to be $176k (11.7% below list).
- Recommended offer: $176k (11.7% below list) — sets the bar for 1% rule.
- Cap rate 5.8% vs local median 2.4% in Montpelier — top-decile yield for the area; either an underpriced asset or a hidden risk that comps aren't pricing in. Stress-test before assuming the spread holds.
Location & tenants
- Location reads 84/100 on livability (#3 in VT, #670 nationally) — a professional / high-income tenant draw. Strengths: amenities A+, housing A+, health & safety A+; Watch: crime C-.
- Zoned schools: Union Elementary School (math 52% / reading 57%, grade C, #31 of 192 statewide, top 21%, 448 students, 13% FRL).
- Market conditions: 65 active listings in the ZIP; 185 units permitted in Washington County in 2024 (30 in 5+ unit buildings).
Forward outlook
- Local home prices are declining (-3.0%/yr); year-one equity from $1k of loan paydown is wiped out by about $6k of value loss. Plan a longer hold.
- Washington County population projected at -19% by 2050 — secular population decline; favor cash flow + early exit over multi-decade hold.
Negotiation context
- Only 5 days on market — expect competitive offers; lowballing is unlikely to land.
Questions for the listing agent
- What do current leases actually rent for vs. the listed asking? Can we see a recent rent roll and the last 12 months of T-12 income?
- What does the HOA fee cover, when was the last increase, and are there any pending special assessments or reserve-fund shortfalls?
- Is there a deadline driving the sale (1031 exchange, divorce, estate, relocation)? That informs how much negotiation room exists.
- Schools are A-rated — typically a magnet for longer-tenancy family renters. What's the average tenant stay here, and is there a school-zone premium baked into asking?
- The area grade is low — what's the realistic commute time and amenity access for the typical tenant pool here? Any planned neighborhood developments (good or bad) we should know about?
- What's the average days-on-market for RENTAL listings here right now (not sales)? A rising rental-DOM trend means longer vacancies and softer asking-rent achievability than the comps imply.
- What's the recent tenant-quality profile in this submarket — average credit score on applications, eviction rate, late-payment / NSF rate, and stable-employment percentage? A property-management company in the area should have these aggregated.
- How much new for-sale + rental construction is in the pipeline within 1–3 miles? Heavy new supply typically softens prices + rents 12–24 months out; constrained supply supports both.
Investment metrics
- 1% rule
- 0.88% ✗
- Cap rate
- 5.83%
- Cash-on-cash
- -1.65%
- DSCR
- 0.93
- GRM
- 9.4
CMA / ARV
- ARV (on-the-fly)
- $185,328
- Comps found
- 5
Show comp detail 5 sales within ~0.75 mi
| Address | Dist | Beds/Ba | Sqft | Sold | Price | $/sf | Match |
|---|---|---|---|---|---|---|---|
| 12 Overlook Dr | 0.01mi | 3/2.0 | 1,188 (0%) | 2mo | $185,000 | $156 | 98 |
| 315 State St | 0.13mi | 2/1.5 (-1) | 1,268 (+7%) | 17mo | $319,000 | $252 | 62 |
| 5 Gaylord Dr | 0.15mi | 2/1.0 (-1) | 1,050 (-12%) | 12mo | $350,000 | $333 | 54 |
| 14 Lague Dr | 0.11mi | 3/1.0 | 1,330 (+12%) | 23mo | $183,050 | $138 | 52 |
| 7 Lague Dr | 0.17mi | 3/1.5 | 1,350 (+14%) | 23mo | $199,000 | $147 | 48 |
Match score weights: distance 35% · size 25% · config 20% · recency 20%. Top-matched comps best support the ARV.
Projected returns pro-forma
-3.0% appreciation · 3.0% rent growth · sell at horizon
- IRR
- -19.0%
- Equity multiple
- 0.34×
- Total profit
- $-37,040
- Equity at exit
- $29,672
- IRR
- -11.4%
- Equity multiple
- 0.31×
- Total profit
- $-38,200
- Equity at exit
- $17,206
Cash invested: $55,720 (down + closing). Projections, not guarantees.
Landlord ↔ Tenant lean methodology
- Overall (STATE)
- 41 Moderately Tenant-Leaning
- State Vermont
- 41 Moderately Tenant-Leaning · D+15
- County
- — inherits STATE
- City
- — inherits STATE
ZIP-level market 05602
- Active inventory
- 65
- Price-to-rent
- 9.4×
Monthly cashflow live
- Estimated rent
- $1,758 medium interval (Pro) →
- Mortgage (P&I)
- −$1,044
- Tax est. 1.5%
- −$249 /mo · $2,985/yr
- Insurance
- −$83
- HOA
- −$90
- Vacancy / Maint / Mgmt
- −$369
- Net cashflow
- $-77
Break-even live
UW: 25.0% down · 7.5% · 30yr · 1.5% tax · 5.0% vac · 8.0% maint · 8.0% mgmt
Financing live
Cash to close
- Down payment
- $49,750
- Closing costs
- $5,970
- Reserves months
- —
- Total cash needed
- —
Loan-product check · same deal, 3 products live
Conventional
25% down · 7.5% · 30yr
- Down + closing
- —
- Monthly P&I
- —
- Monthly cashflow
- —
- DSCR
- —
- Eligible?
- —
Personal DTI + credit; lowest rate.
DSCR
20% down · 8.5% · 30yr
- Down + closing
- —
- Monthly P&I
- —
- Monthly cashflow
- —
- DSCR
- —
- Eligible?
- —
No personal income docs; deal must DSCR.
Hard money
10% down · 12.0% · 12mo
- Down + closing
- —
- Monthly P&I
- —
- Monthly cashflow
- —
- DSCR
- —
- Eligible?
- —
Short-term bridge; refi at stabilization.
HOA detail
- Monthly dues
- $90 · $1,080/yr
- Likely covers
- gassnow removalinsurance
Listing history 2 events
-
2026-04-21status Pending
-
2026-04-14$199,000 Active
ⓘ Source: listings_history table (triggers on properties + properties_extension) + one-shot
backfill from property_details.listing_events for pre-trigger history.
Nearby sold comps map
Loading sold comps map…
Walkable amenities ~0.75 mi
Loading nearby amenities…
Taxation est. · year 1
- Rental income
- $21,094
- − Mortgage interest
- −$11,147
- − Property taxes
- −$2,985
- − Insurance
- −$995
- − Repairs & maintenance
- −$1,688
- − Management
- −$1,688
- − HOA
- −$1,080
- − Depreciation
- −$5,789
- Taxable loss
- −$4,277
- Est. tax savings @ 24.0%
- +$1,027
- After-tax cash flow
- $108/yr
For passive investors: Depreciation is non-cash, so a rental often shows a tax loss while cash-flowing — sheltering income. Rental losses are passive: they offset passive income freely, and up to $25,000/yr can offset ordinary (W-2) income if you actively participate and your MAGI is under $100k (phasing out to $0 by $150k); unused losses carry forward. On sale, claimed depreciation is recaptured at up to 25%, and gains may owe capital-gains tax (a 1031 exchange can defer both). Figures are a year-1 estimate at your 24.0% rate — not tax advice; consult a CPA.
Condition & rehab AI · 14 photos
This single-family home in Montpelier, VT is in good condition with a good roof and exterior. It has a good kitchen and bathrooms, and the interior walls and paint are in good condition. The home is move-in ready with minor cosmetic updates needed to enhance its curb appeal and value.
Value-add opportunities
- Resale Paint the exterior siding — Enhances curb appeal and value
- Both Replace the front door — Improves security and aesthetics
- Resale Replace the kitchen appliances — Modernizes the kitchen and adds value
Renovation cost estimate screening
Value-add ROI direction
- Resale Paint the exterior siding — Enhances curb appeal and value ↑
- Both Replace the front door — Improves security and aesthetics ↑
- Resale Replace the kitchen appliances — Modernizes the kitchen and adds value ↑
ⓘ Cost ranges are severity-bucket heuristics (US national rule-of-thumb). Get contractor quotes + a written scope before underwriting a rehab budget.
Schools (NCES district)
No district data.
Livability — Montpelier
- Score
- 84/100
- State rank
- #3
- US rank
- #670
Category grades
Schools grade is shown separately in the Schools card above.
Census & demographics
- Census place
- Montpelier, VT
- Population (ZIP)
- 12,491
Population outlook (Washington County) Hauer SSP2
- Today (2025)
- 56,608 people
- By 2030
- 54,731 · -3.3%
- By 2040
- 50,227 · -11.3%
- By 2050
- 45,893 · -18.9%
- By 2075
- 36,818 · -35.0%
- By 2100
- 28,143 · -50.3%
Race, ethnicity, and origin ACS 2023
- Neighborhood character
- Predominantly White (89%)
- Race & ethnicity
- White 89% Two or more races 6% Hispanic / Latino 3% Asian 1% Black 1%
- Common ancestry
- Lithuanian 6% Slovak 4% Romanian 3%
- Foreign-born
- 4% · Canada
- Languages at home
- 95% English-only · French/Haitian/Cajun 2% Spanish 1% Russian/Polish/Slavic 1%
Political lean MEDSL · Washington
- 2024 margin
- Solid D (+43.4) · D 70.0% · R 26.6% · Other 3.4%
- 2008→2024 swing
- +2.4pp toward D · 2008: 41.0pp · 2024: 43.4pp
- All cycles
- 2024: D+43.4 2020: D+46.1 2016: D+37.0 2012: D+42.2 2008: D+41.0
Not yet ingested
- Civics
- —
Market trends
- HPI YoY
- ▼ -195.34%
- Current HPI
- 344.3382
- Rent YoY
- —
- Metro
- —
- State GDP YoY
- —
- F500 in state
- 0
Price history
2 events — show timeline
- 2026-04-21 Pending — PrimeMLS
- 2026-04-14 Listed $199,000 PrimeMLS
Cash-flow waterfall
monthlySold comps — $/sqft
last 12 mo · ≤1 miLoading sold comps…