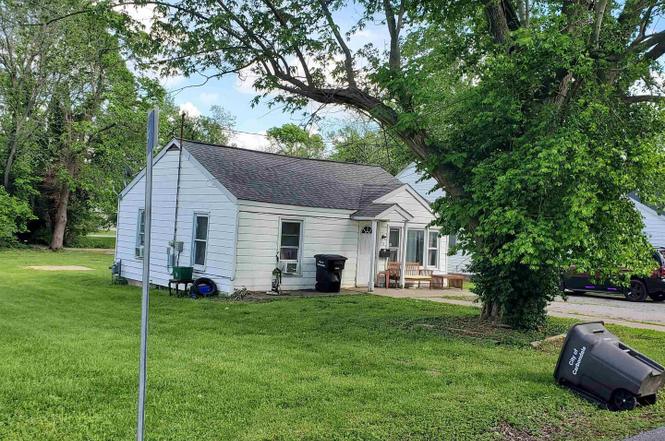
715 N Carico St · Carbondale, IL
Flood risk 1/10 · Minimal
- FEMA flood zone
- X (unshaded)
- Chance of flooding over 30 yrs
- 0.0%
- Est. flood insurance / yr
- $507 – $1,088
Fire risk 1/10 · Minimal
- Est. fire insurance / yr
- $804 – $1,492
Heat risk 5/10 · Moderate
- Hot days now (above 107°F)
- 7 days/yr
- Hot days in 30 yrs
- 21 days/yr
Wind risk 2/10 · Minimal
- Chance of severe wind over 30 yrs
- 3.0%
Air-quality risk 2/10 · Minimal
- Unhealthy air days now
- 0 days/yr
- Unhealthy air days in 30 yrs
- 1 days/yr
Risk factors via First Street. Map © Google.
Why this score? — see what drove the B grade
The composite is a weighted blend of 9 inputs, each scored 0–100. Each bar is that input's sub-score; the figure is the points it added to the 100-point composite (weight × sub-score).
- Cash flow +30.0/30.0
- ARV discount +11.3/15.0
- 1% rule +10.0/10.0
- DSCR +10.0/10.0
- Rent growth +3.6/5.0
- Livability +3.5/5.0
- Condition / age +2.5/5.0
- Schools +2.4/10.0
- Appreciation +0.0/10.0
$32,000
🖨 Deal sheet 📄 Offer letter ✓ Due diligence
Listing remarks MLS
Great Starter home or Investment property with Lots of Updates ready for you. Newer Roof, Windows, Front Door, LR and Front Bedroom subflooring and floor coverings. -
Key facts
- 5,720 sq ft lot
- Built 1948
- Listed 181 days
Property features AI
Exterior
- Parking: Gravel parking
- Utilities: Public water; Public sewer
- Home design: Detached single-family home; One-story main level
- Construction: Built approximately 71–80 years ago; Vinyl siding with frame construction
- Exterior features: Level lot; Lot dimensions approximately 40 x 143
Interior
- Kitchen: Eating area / table space in kitchen (approx. 12 x 12)
- Bedrooms: 2 bedrooms (both on the main level); Bedroom dimensions approximately 10 x 10 and 9 x 10
- Flooring: Other flooring throughout listed rooms
- Bathrooms: 1 full bathroom
- Heating & cooling: Natural gas heating
- Interior features: Egress window in basement
Neighborhood map
What this means for you Summary
Snapshot
- This is a 1-bed/1.0-bath single-family listed at $32k.
Deal economics
- At list price, monthly cash flow is $304 ($4k/yr) — positive.
- The deal already cash-flows at list — no discount required.
- Meets the 1% rule at list price ($664 rent vs $32k).
- Recommended offer: $28k (12.0% below list) — sets the bar for market timing.
- Cap rate 17.7% vs local median 4.9% in Carbondale — top-decile yield for the area; either an underpriced asset or a hidden risk that comps aren't pricing in. Stress-test before assuming the spread holds.
Location & tenants
- Location reads 70/100 on livability (#375 in IL) — a middle-class / working-renter tenant base. Strengths: amenities A+, commute A+, cost of living A+; Watch: housing C-, crime F, employment F.
- Carbondale Chsd 165 (urban): math 26% / reading 35% proficiency, ranked #279 of 620 in IL (top 45%) — families likely to look elsewhere, expect single-tenant / working-renter base with shorter leases.
- Zoned schools: Carbondale Comm H S (math 26% / reading 35%, grade F, #175 of 693 statewide, top 26%, 997 students, 0% FRL).
- Market conditions: Rents rising fast (+4.5%/yr); 202 active listings in the ZIP; 4 comparable units currently listed for rent nearby; rentals lingering (median 44d on market — plan ~5-8 weeks vacancy on turnover, expect pricing pressure); 100% of comp listings sitting > 30 days — soft ceiling on asking rent; lower-income renter base — watch delinquency; 5 units permitted in Jackson County in 2024 (0 in 5+ unit buildings).
Forward outlook
- Local home prices are declining (-3.0%/yr); year-one equity from $221 of loan paydown is wiped out by about $960 of value loss. Plan a longer hold.
- At projected returns (-3.0% appreciation + 4.5% rent growth), your $9k cash investment doubles in ~3 years — after that, you're playing with house money.
Negotiation context
- It's been on market 182 days — a 12% lower offer ($28k) is reasonable based on typical stale-listing flexibility.
- 4 sale attempts since 14y ago; this cycle's ask has dropped $27k (46%) from the opening price — seller is motivated, your offer sets the floor, not the list.
Risks & watch-outs
- Watch-outs: built in 1948 — expect roof / HVAC / electrical / plumbing capex.
- Climate carrying-cost: extreme-heat days projected 7→21/yr by 2055 (HVAC capex compounding) — expect insurance premiums to compound above CPI over the hold.
Questions for the listing agent
- It's been on market 182 days. Have you received any prior offers? Is the seller open to a 12% concession, seller financing, or rate buy-down credit?
- Built in 1948 — when were the roof, HVAC, electrical panel, plumbing, and water heater last replaced?
- Why hasn't it sold? Are there any deal-killer items the seller is aware of (foundation, flood, title, zoning, code violations)?
- Is there a deadline driving the sale (1031 exchange, divorce, estate, relocation)? That informs how much negotiation room exists.
- Schools are D-rated, which usually means shorter tenancies and higher turnover. Who's the typical renter profile here, and what's been the actual vacancy rate?
- Crime grade is F in this area — have there been break-ins, vandalism, or insurance claims at this property in the last 3 years? What carrier currently insures it and at what premium?
- What's the average days-on-market for RENTAL listings here right now (not sales)? A rising rental-DOM trend means longer vacancies and softer asking-rent achievability than the comps imply.
- What's the recent tenant-quality profile in this submarket — average credit score on applications, eviction rate, late-payment / NSF rate, and stable-employment percentage? A property-management company in the area should have these aggregated.
- How much new for-sale + rental construction is in the pipeline within 1–3 miles? Heavy new supply typically softens prices + rents 12–24 months out; constrained supply supports both.
Investment metrics
- 1% rule
- 2.08% ✓
- Cap rate
- 17.68%
- Cash-on-cash
- 40.68%
- DSCR
- 2.81
- GRM
- 4.0
CMA / ARV
- ARV (on-the-fly)
- $34,944
- Comps found
- 11
Show comp detail 11 sales within ~0.75 mi
| Address | Dist | Beds/Ba | Sqft | Sold | Price | $/sf | Match |
|---|---|---|---|---|---|---|---|
| 605 N Carico St | 0.10mi | 2/1.0 (+1) | 700 (+4%) | 0mo | $32,000 | $46 | 83 |
| 712 N Carico | 0.03mi | 2/1.0 (+1) | 660 (-2%) | 22mo | $15,000 | $23 | 72 |
| 805 N James St | 0.33mi | 2/1.0 (+1) | 698 (+4%) | 8mo | $27,500 | $39 | 66 |
| 521 N Allyn St | 0.28mi | 2/1.0 (+1) | 720 (+7%) | 9mo | $37,250 | $52 | 62 |
| 521 N Allyn St | 0.28mi | 2/1.0 (+1) | 720 (+7%) | 9mo | $37,250 | $52 | 62 |
| 520 N Davis St | 0.11mi | 2/1.0 (+1) | 768 (+14%) | 8mo | $85,000 | $111 | 60 |
| 520 N Davis St | 0.11mi | 2/1.0 (+1) | 768 (+14%) | 8mo | $85,000 | $111 | 60 |
| 602 N Michaels St | 0.06mi | 2/0.5 (+1) | 576 (-14%) | 15mo | $7,000 | $12 | 54 |
| 514 N Davis St | 0.13mi | 2/1.0 (+1) | 768 (+14%) | 16mo | $60,000 | $78 | 52 |
| 514 N Davis St | 0.13mi | 2/1.0 (+1) | 768 (+14%) | 16mo | $60,000 | $78 | 52 |
| 306 W Cherry St | 0.70mi | 2/1.0 (+1) | 616 (-8%) | 4mo | $30,000 | $49 | 46 |
Match score weights: distance 35% · size 25% · config 20% · recency 20%. Top-matched comps best support the ARV.
Projected returns pro-forma
-3.0% appreciation · 4.51% rent growth · sell at horizon
- IRR
- 38.9%
- Equity multiple
- 2.70×
- Total profit
- $15,196
- Equity at exit
- $4,771
- IRR
- 46.0%
- Equity multiple
- 5.75×
- Total profit
- $42,521
- Equity at exit
- $2,767
Cash invested: $8,960 (down + closing). Projections, not guarantees.
Landlord ↔ Tenant lean methodology
- Overall (STATE)
- 43 Moderately Tenant-Leaning
- State Illinois
- 43 Moderately Tenant-Leaning · D+7
- County
- — inherits STATE
- City
- — inherits STATE
ZIP-level market 62901
- Rents YoY
- 4.5%
- Active inventory
- 202
- Price-to-rent
- 4.0×
Monthly cashflow live
- Estimated rent
- $664 medium interval (Pro) →
- Mortgage (P&I)
- −$168
- Tax est. 1.5%
- −$40 /mo · $480/yr
- Insurance
- −$13
- HOA
- −$0
- Vacancy / Maint / Mgmt
- −$140
- Net cashflow
- $304
Break-even live
UW: 25.0% down · 7.5% · 30yr · 1.5% tax · 5.0% vac · 8.0% maint · 8.0% mgmt
Financing live
Cash to close
- Down payment
- $8,000
- Closing costs
- $960
- Reserves months
- —
- Total cash needed
- —
Loan-product check · same deal, 3 products live
Conventional
25% down · 7.5% · 30yr
- Down + closing
- —
- Monthly P&I
- —
- Monthly cashflow
- —
- DSCR
- —
- Eligible?
- —
Personal DTI + credit; lowest rate.
DSCR
20% down · 8.5% · 30yr
- Down + closing
- —
- Monthly P&I
- —
- Monthly cashflow
- —
- DSCR
- —
- Eligible?
- —
No personal income docs; deal must DSCR.
Hard money
10% down · 12.0% · 12mo
- Down + closing
- —
- Monthly P&I
- —
- Monthly cashflow
- —
- DSCR
- —
- Eligible?
- —
Short-term bridge; refi at stabilization.
Rent comps 4 comps
| Address | Beds | Baths | Sqft | Rent | $/sqft | DOM | Units | Dist |
|---|---|---|---|---|---|---|---|---|
| 516 S Rawlings St Carbondale, IL | 1.0 | 1.0 | 450 | $625 | $1.39 | 43d | 5 | 0.78mi |
| 600 W Mill St Carbondale, IL | 1.0 | 1.0 | 615 | $750 | $1.22 | 43d | 2 | 0.92mi |
| 405 E College St Carbondale, IL | 1.0 | 1.0 | 351 | $690 | $1.96 | 43d | 10 | 0.96mi |
| 250 S Lewis Ln Carbondale, IL | 3.0 | 1.0 | 622 | $550 | $0.88 | 43d | 1 | 1.34mi |
Listing history 24 events
-
2026-06-19days on market $32,000 Active 182 DOM
-
2026-06-18days on market $32,000 Active 181 DOM
-
2026-06-17days on market $32,000 Active 180 DOM
-
2026-06-16days on market $32,000 Active 179 DOM
-
2026-06-15days on market $32,000 Active 178 DOM
-
2026-06-14days on market $32,000 Active 176 DOM
-
2026-06-13days on market $32,000 Active 175 DOM
-
2026-06-10days on market $32,000 Active 173 DOM
-
2026-06-09days on market $32,000 Active 172 DOM
-
2026-06-08days on market $32,000 Active 171 DOM
-
2026-06-07days on market $32,000 Active 170 DOM
-
2026-06-02days on market $32,000 Active 165 DOM
-
2026-06-01days on market $32,000 Active 164 DOM
-
2026-05-31days on market $32,000 Active 163 DOM
-
2026-05-30days on market $32,000 Active 162 DOM
-
2026-01-08status Active
-
2026-01-06historical
-
2026-01-05historical
-
2025-06-26Active
-
2012-09-17soldstatus $156,500
-
2012-09-12soldstatus $48,250 166-char remark
Show marketing remark (166 chars)
Great Starter home or Investment property with Lots of Updates ready for you. Newer Roof, Windows, Front Door, LR and Front Bedroom subflooring and floor coverings. -
-
2012-09-12soldstatus $48,250 166-char remark
Show marketing remark (166 chars)
Great Starter home or Investment property with Lots of Updates ready for you. Newer Roof, Windows, Front Door, LR and Front Bedroom subflooring and floor coverings. -
-
2012-07-20$58,900 166-char remark
Show marketing remark (166 chars)
Great Starter home or Investment property with Lots of Updates ready for you. Newer Roof, Windows, Front Door, LR and Front Bedroom subflooring and floor coverings. -
-
2012-07-20$58,900 166-char remark
Show marketing remark (166 chars)
Great Starter home or Investment property with Lots of Updates ready for you. Newer Roof, Windows, Front Door, LR and Front Bedroom subflooring and floor coverings. -
ⓘ Source: listings_history table (triggers on properties + properties_extension) + one-shot
backfill from property_details.listing_events for pre-trigger history.
Climate risk First Street
- Flood 1/10 Low FEMA zone X (unshaded) · 0% chance over 30 yrs
- Wildfire 1/10 Low
- Heat 5/10 Major 7 d/yr ≥107°F today · 21 d/yr by 30 yrs out
- Wind 2/10 Low 3% chance of damaging wind over 30 yrs
- Air quality 2/10 Low 0 unhealthy d/yr today · 1 by 30 yrs out
Nearby sold comps map
Loading sold comps map…
Walkable amenities ~0.75 mi
Loading nearby amenities…
Taxation est. · year 1
- Rental income
- $7,973
- − Mortgage interest
- −$1,792
- − Property taxes
- −$480
- − Insurance
- −$160
- − Repairs & maintenance
- −$638
- − Management
- −$638
- − Depreciation
- −$931
- Taxable income
- $3,334
- Est. tax owed @ 24.0%
- −$800
- After-tax cash flow
- $2,845/yr
For passive investors: Depreciation is non-cash, so a rental often shows a tax loss while cash-flowing — sheltering income. Rental losses are passive: they offset passive income freely, and up to $25,000/yr can offset ordinary (W-2) income if you actively participate and your MAGI is under $100k (phasing out to $0 by $150k); unused losses carry forward. On sale, claimed depreciation is recaptured at up to 25%, and gains may owe capital-gains tax (a 1031 exchange can defer both). Figures are a year-1 estimate at your 24.0% rate — not tax advice; consult a CPA.
Schools (NCES district)
- District
- Carbondale Chsd 165
- NCES district ID
- 1708370
- Math proficiency
- 26% ▼ -10.00%
- Reading proficiency
- 35% ▼ -2.00%
- Median HH income
- $22,075
- Composite
- 23.92/100
- National rank
- #7787
- State rank
- #279 of 620 in IL
Livability — Carbondale
- Score
- 70/100
- State rank
- #375
- US rank
- #7806
Category grades
Schools grade is shown separately in the Schools card above.
Census & demographics
- Census place
- Carbondale, IL
- County
- Jackson County · 22,946 people
- City population
- 22,946
- Metro
- Carbondale-Marion, IL
- Population (ZIP)
- 22,946
- Household income
- $35,089
- Rent vs Own
- Severe rent burden
- 2038.0
Population outlook (Jackson County) Hauer SSP2
- Today (2025)
- 59,093 people
- By 2030
- 59,628 · +0.9%
- By 2040
- 59,495 · +0.7%
- By 2050
- 58,811 · -0.5%
- By 2075
- 57,683 · -2.4%
- By 2100
- 55,337 · -6.4%
Race, ethnicity, and origin ACS 2023
- Neighborhood character
- Diverse neighborhood (Simpson 0.58)
- Race & ethnicity
- White 59% Black 26% Asian 6% Hispanic / Latino 5% Two or more races 5%
- Hispanic origin (detail)
- Mexican 4%
- Common ancestry
- Romanian 2% Italian 2% Slovak 2%
- Foreign-born
- 9% · Canada, China, South Korea
- Languages at home
- 87% English-only · Other Indo-European 4% Spanish 4% Arabic 2%
Political lean MEDSL · Jackson
- 2024 margin
- Toss-up / Even · D 51.0% · R 47.5% · Other 1.4%
- 2008→2024 swing
- -18.3pp toward R · 2008: 21.8pp · 2024: 3.5pp
- All cycles
- 2024: D+3.5 2020: D+1.3 2016: D+3.0 2012: D+10.3 2008: D+21.8
Not yet ingested
- Civics
- —
Market trends
- HPI YoY
- ▼ -75.62%
- Current HPI
- 88.7209
- Rent YoY
- ▲ 4.51%
- Metro
- Carbondale-Marion, IL
- State GDP YoY
- ▲ 1.59%
- F500 in state
- 60
Industry mix (Fortune 500 HQ in IL)
| Industry | F500 HQs | Revenue |
|---|---|---|
| Insurance | 4 | $201B |
|
||
| Consumer Goods | 4 | $87B |
|
||
| Industrial Machinery | 3 | $64B |
|
||
| Healthcare | 2 | $55B |
|
||
| Retail / Pharmacy | 1 | $148B |
|
||
| Agriculture / Food | 1 | $86B |
|
||
Price history
+165.7% since first listed9 events — show timeline
- 2026-01-08 Relisted — MRED as Distributed by MLS Grid
- 2026-01-06 Listing Removed — RMLSA as Distributed by MLS Grid
- 2026-01-05 Listing Removed — MRED as Distributed by MLS Grid
- 2025-06-26 Listed — RMLSA as Distributed by MLS Grid
- 2012-09-17 Sold (Public Records) $156,500 Public Records
- 2012-09-12 Sold (MLS) $48,250 RMLSA as Distributed by MLS Grid
- 2012-09-12 Sold (MLS) $48,250 MRED as Distributed by MLS Grid
- 2012-07-20 Listed $58,900 RMLSA as Distributed by MLS Grid
- 2012-07-20 Listed $58,900 MRED as Distributed by MLS Grid
Property tax history
+3.7%/yrLatest (2024): $1,866 · +6.4% YoY. Source: county tax records.
Cash-flow waterfall
monthlySold comps — $/sqft
last 12 mo · ≤1 miLoading sold comps…