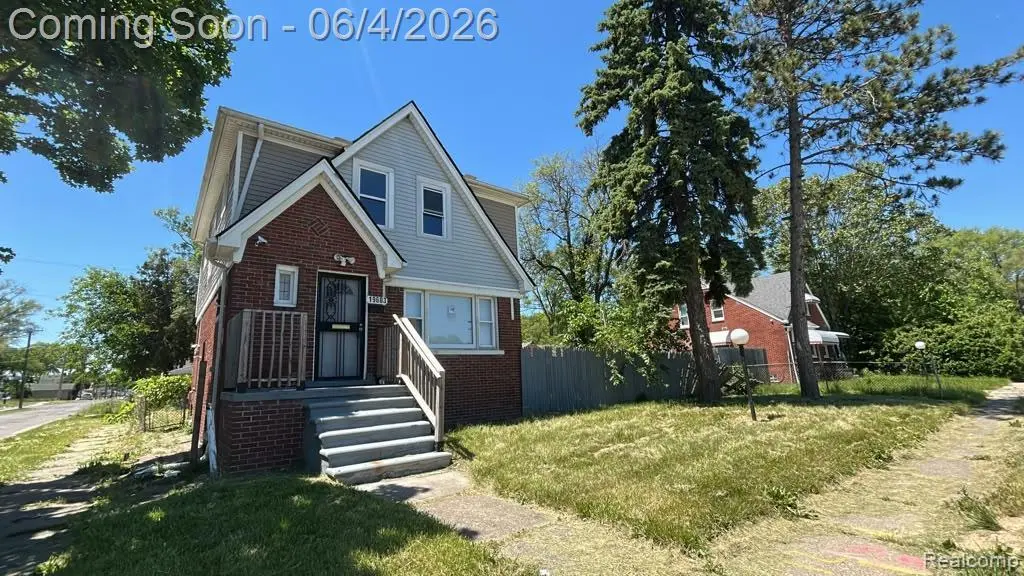
19603 Goddard St · Detroit, MI
Flood risk 7/10 · Major
- FEMA flood zone
- X (unshaded)
- Chance of flooding over 30 yrs
- 0.97%
- Est. flood insurance / yr
- $473 – $860
Fire risk 1/10 · Minimal
- Est. fire insurance / yr
- $784 – $1,456
Heat risk 3/10 · Minor
- Hot days now (above 97°F)
- 7 days/yr
- Hot days in 30 yrs
- 15 days/yr
Wind risk 2/10 · Minimal
- Chance of severe wind over 30 yrs
- —
Air-quality risk 4/10 · Minor
- Unhealthy air days now
- 4 days/yr
- Unhealthy air days in 30 yrs
- 6 days/yr
Risk factors via First Street. Map © Google.
Why this score? — see what drove the D+ grade
The composite is a weighted blend of 9 inputs, each scored 0–100. Each bar is that input's sub-score; the figure is the points it added to the 100-point composite (weight × sub-score).
- Cash flow +21.6/30.0
- DSCR +6.9/10.0
- 1% rule +6.7/10.0
- Rent growth +4.2/5.0
- Livability +3.7/5.0
- Condition / age +2.5/5.0
- Schools +1.3/10.0
- ARV discount +0.0/15.0
- Appreciation +0.0/10.0
$115,000
🖨 Deal sheet 📄 Offer letter ✓ Due diligence
Listing remarks MLS
Welcome to this impeccably maintained brick home, featuring 3 bedrooms and 1 bathroom. The property offers over 1,300 square feet of living space and boasts an abundance of natural light. Its huge backyard is perfect for hosting summer barbecues, gardening, or simply relaxing. The home is situated on a quiet, friendly street within the highly sought-after State Fair/Nolan neighborhood on Detroit's East Side. Its location is extremely convenient: less than 5 minutes from Meijer, Kroger, and Aldi (all located within 1 to 2 miles), as well as the I-75 and I-94 highways. Additionally, it is close to the Eastland Center shopping and dining complex, as well as local schools, churches, and parks. The house stands out thanks to its solid brick construction and features a spacious basement ready for your finishing touches. It is the ideal choice for first-time homebuyers, investors, or anyone seeking an affordable space in an excellent area. Homes on this pleasant street tend to sell very quickly. The property is equipped with a security system and is monitored 24/7.
Key facts
- 7,405 sq ft lot
- Garage
- Built 1929
Property features AI
Exterior
- Parking: Detached garage (1.5 spaces)
- Security: Smoke detector(s)
- Utilities: Public water; Sewer available
- Home design: Single-family residence; Two levels; Lower-level entry with steps
- Construction: Brick construction; Block foundation; Home warranty included
- Exterior features: Paved road access; Lot approximately 0.17 acres (60 x 120)
Interior
- Bathrooms: 1 full bathroom
- Heating & cooling: Forced air heating (natural gas); No cooling
- Interior features: Unfinished basement; Smoke detector(s)
Neighborhood map
What this means for you Summary
Snapshot
- This is a 3-bed/1.0-bath single-family listed at $115k.
Deal economics
- At list price, monthly cash flow is $118 ($1k/yr) — positive.
- The deal already cash-flows at list — no discount required.
- Meets the 1% rule at list price ($1k rent vs $115k).
- Recommended offer: $113k (1.5% below list) — sets the bar for market timing.
- Cap rate 8.1% vs local median 10.2% in Detroit — below-typical yield; the buyer is paying a premium for something (appreciation thesis, condition, location) that the cap rate doesn't capture.
Location & tenants
- Location reads 73/100 on livability (#218 in MI) — a middle-class / working-renter tenant base. Strengths: amenities A+, commute A+, cost of living A+; Watch: schools F, crime F, employment F.
- Detroit Public Schools Community District (urban): math 10% / reading 24% proficiency, ranked #499 of 540 in MI (top 92%) — low school quality limits family demand, transient renter base, plan for 1-2y turnover; 90% free/reduced lunch — lower-income household profile, screen leases tightly.
- Market conditions: Rents rising fast (+6.7%/yr); 226 active listings in the ZIP; 34 comparable units currently listed for rent nearby; rentals at typical pace (median 21d on market — plan ~3-4 weeks tenant-placement turnaround); lower-income renter base — watch delinquency; 2,639 units permitted in Wayne County in 2024 (1,216 in 5+ unit buildings).
- At $1,344/mo this rent would consume 46% of the median local household income ($35k/yr) (locally 2372% of renters already pay >50% of income on rent) — very limited rent-growth headroom before tenants either downsize or default.
Forward outlook
- Local home prices are declining (-3.0%/yr); year-one equity from $795 of loan paydown is wiped out by about $3k of value loss. Plan a longer hold.
- Wayne County population projected at -17% by 2050 — secular population decline; favor cash flow + early exit over multi-decade hold.
- At projected returns (-3.0% appreciation + 6.7% rent growth), your $32k cash investment doubles in ~10 years — after that, you're playing with house money.
Negotiation context
- It's been on market 15 days — a 2% lower offer ($113k) is reasonable based on typical stale-listing flexibility.
- 8 sale attempts since 22y ago with the ask held roughly flat each time — persistent listings suggest the price (not the market) is what's stuck; bring a comps-based counter.
Risks & watch-outs
- Watch-outs: flood insurance adds $56/mo; built in 1929 — expect roof / HVAC / electrical / plumbing capex.
- Climate carrying-cost: major flood risk — expect insurance premiums to compound above CPI over the hold.
Questions for the listing agent
- Built in 1929 — when were the roof, HVAC, electrical panel, plumbing, and water heater last replaced?
- What's the actual annual flood-insurance premium (NFIP or private), and is the property in a SFHA with mandatory coverage?
- Is there a deadline driving the sale (1031 exchange, divorce, estate, relocation)? That informs how much negotiation room exists.
- Schools are F-rated, which usually means shorter tenancies and higher turnover. Who's the typical renter profile here, and what's been the actual vacancy rate?
- Crime grade is F in this area — have there been break-ins, vandalism, or insurance claims at this property in the last 3 years? What carrier currently insures it and at what premium?
- The area grade is low — what's the realistic commute time and amenity access for the typical tenant pool here? Any planned neighborhood developments (good or bad) we should know about?
- What's the average days-on-market for RENTAL listings here right now (not sales)? A rising rental-DOM trend means longer vacancies and softer asking-rent achievability than the comps imply.
- What's the recent tenant-quality profile in this submarket — average credit score on applications, eviction rate, late-payment / NSF rate, and stable-employment percentage? A property-management company in the area should have these aggregated.
- How much new for-sale + rental construction is in the pipeline within 1–3 miles? Heavy new supply typically softens prices + rents 12–24 months out; constrained supply supports both.
Investment metrics
- 1% rule
- 1.17% ✓
- Cap rate
- 8.11%
- Cash-on-cash
- 6.48%
- DSCR
- 1.29
- GRM
- 7.1
CMA / ARV
- ARV (on-the-fly)
- $81,130
- Comps found
- 12
Show comp detail 12 sales within ~0.75 mi
| Address | Dist | Beds/Ba | Sqft | Sold | Price | $/sf | Match |
|---|---|---|---|---|---|---|---|
| 19365 Goddard St | 0.10mi | 3/1.0 | 1,100 (-5%) | 0mo | $97,500 | $89 | 86 |
| 19181 Marx St | 0.40mi | 3/1.0 | 1,152 (-1%) | 1mo | $40,500 | $35 | 79 |
| 19710 Greeley St | 0.48mi | 3/1.5 | 1,143 (-1%) | 3mo | $80,000 | $70 | 71 |
| 19145 Riopelle St | 0.53mi | 3/2.0 | 1,152 (-1%) | 2mo | $80,000 | $69 | 68 |
| 19711 Greeley St | 0.51mi | 3/1.0 | 1,125 (-3%) | 4mo | $75,000 | $67 | 68 |
| 19155 Gallagher St | 0.50mi | 3/1.5 | 1,208 (+4%) | 0mo | $129,900 | $108 | 67 |
| 20041 Marx St | 0.43mi | 3/1.5 | 1,233 (+6%) | 2mo | $130,500 | $106 | 66 |
| 19662 Charest St | 0.37mi | 3/1.0 | 1,041 (-10%) | 2mo | $69,000 | $66 | 64 |
| 19163 Orleans St | 0.47mi | 2/1.0 (-1) | 1,080 (-7%) | 2mo | $32,500 | $30 | 60 |
| 19360 Revere St | 0.53mi | 3/1.0 | 1,050 (-9%) | 2mo | $78,000 | $74 | 58 |
| 20450 Gallagher St | 0.68mi | 3/1.0 | 1,291 (+11%) | 1mo | $45,000 | $35 | 48 |
| 2339 E Outer Dr | 0.72mi | 3/2.5 | 1,324 (+14%) | 4mo | $154,000 | $116 | 33 |
Match score weights: distance 35% · size 25% · config 20% · recency 20%. Top-matched comps best support the ARV.
Projected returns pro-forma
-3.0% appreciation · 6.72% rent growth · sell at horizon
- IRR
- -4.6%
- Equity multiple
- 0.82×
- Total profit
- $-5,769
- Equity at exit
- $17,147
- IRR
- 9.5%
- Equity multiple
- 1.88×
- Total profit
- $28,256
- Equity at exit
- $9,943
Cash invested: $32,200 (down + closing). Projections, not guarantees.
Landlord ↔ Tenant lean methodology
- Overall (STATE)
- 62 Landlord-Friendly
- State Michigan
- 62 Landlord-Friendly · EVEN
- County
- — inherits STATE
- City
- — inherits STATE
ZIP-level market 48234
- Home prices YoY
- -11.9%
- Rents YoY
- 6.7%
- Active inventory
- 226
- Price-to-rent
- 7.1×
Monthly cashflow live
- Estimated rent
- $1,344 high interval (Pro) →
- Mortgage (P&I)
- −$603
- Tax from tax record
- −$237 /mo · $2,844/yr
- Insurance
- −$48
- Flood insurance flood zone
- −$56 /mo · $666/yr
- HOA
- −$0
- Vacancy / Maint / Mgmt
- −$282
- Net cashflow
- $118
Break-even live
UW: 25.0% down · 7.5% · 30yr · 1.5% tax · 5.0% vac · 8.0% maint · 8.0% mgmt
Financing live
Cash to close
- Down payment
- $28,750
- Closing costs
- $3,450
- Reserves months
- —
- Total cash needed
- —
Loan-product check · same deal, 3 products live
Conventional
25% down · 7.5% · 30yr
- Down + closing
- —
- Monthly P&I
- —
- Monthly cashflow
- —
- DSCR
- —
- Eligible?
- —
Personal DTI + credit; lowest rate.
DSCR
20% down · 8.5% · 30yr
- Down + closing
- —
- Monthly P&I
- —
- Monthly cashflow
- —
- DSCR
- —
- Eligible?
- —
No personal income docs; deal must DSCR.
Hard money
10% down · 12.0% · 12mo
- Down + closing
- —
- Monthly P&I
- —
- Monthly cashflow
- —
- DSCR
- —
- Eligible?
- —
Short-term bridge; refi at stabilization.
Rent comps 34 comps
| Address | Beds | Baths | Sqft | Rent | $/sqft | DOM | Units | Dist |
|---|---|---|---|---|---|---|---|---|
| 19995 Goddard St Detroit, MI | 4.0 | 1.0 | 1292 | $1,400 | $1.08 | 22d | 1 | 0.26mi |
| 19694 Gallagher St Detroit, MI | 3.0 | 1.0 | 1000 | $1,150 | $1.15 | 15d | 1 | 0.40mi |
| 20255 Harned St Detroit, MI | 3.0 | 1.0 | 1000 | $1,374 | $1.37 | 17d | 1 | 0.51mi |
| 19360 Revere St Detroit, MI | 3.0 | 1.0 | 1050 | $1,250 | $1.19 | 24d | 1 | 0.51mi |
| 18882 Marx St Highland Park, MI | 2.0 | 1.0 | 1000 | $1,300 | $1.30 | 44d | 1 | 0.53mi |
| 18629 Fleming St Detroit, MI | 3.0 | 1.5 | 900 | $1,150 | $1.28 | 24d | 1 | 0.55mi |
| 19450 Norwood St Detroit, MI | 3.0 | 1.0 | 1000 | $1,200 | $1.20 | 5d | 1 | 0.55mi |
| 18666 Joseph Campau St Detroit, MI | 3.0 | 1.0 | 1000 | $1,400 | $1.40 | 17d | 1 | 0.60mi |
| 20000 Norwood St Detroit, MI | 3.0 | 1.5 | 1150 | $1,200 | $1.04 | 24d | 1 | 0.60mi |
| 18551 Saint Aubin St Detroit, MI | 3.0 | 1.0 | 962 | $1,200 | $1.25 | 17d | 1 | 0.65mi |
| 19930 Binder St Detroit, MI | 3.0 | 1.0 | 1000 | $1,450 | $1.45 | 17d | 1 | 0.73mi |
| 18084 Goddard St Detroit, MI | 2.0 | 1.5 | 790 | $1,050 | $1.33 | 17d | 1 | 0.75mi |
| 2034 John B Ave Warren, MI | 3.0 | 1.0 | 920 | $1,261 | $1.37 | 44d | 1 | 0.78mi |
| 18503 Riopelle St Highland Park, MI | 3.0 | 1.0 | 1254 | $1,250 | $1.00 | 5d | 1 | 0.80mi |
| 18557 Wexford St Detroit, MI | 3.0 | 1.0 | 1216 | $1,250 | $1.03 | 24d | 1 | 0.87mi |
| 21155 Warner Ave Warren, MI | 2.0 | 1.0 | 756 | $1,029 | $1.36 | 24d | 1 | 0.90mi |
| 1301 E Muir Ave Hazel Park, MI | 3.0 | 2.0 | 1236 | $1,600 | $1.29 | 22d | 1 | 0.97mi |
| 18662 Sunset St Detroit, MI | 2.0 | 1.0 | 726 | $1,250 | $1.72 | 18d | 1 | 1.03mi |
| 21516 Dequindre Rd Warren, MI | 1.0–2.0 | 1.0 | 837 | $1,375 | $1.64 | 22d | 1 | 1.07mi |
| 1019 E Hayes Ave Unit 1032331P Hazel Park, MI | 3.0 | 1.0 | 1033 | $5,301 | $5.13 | 2d | 1 | 1.15mi |
| 1211 E Bernhard Ave Hazel Park, MI | 2.0 | 1.0 | 721 | $1,500 | $2.08 | 24d | 1 | 1.16mi |
| 19703 Keating St Highland Park, MI | 3.0 | 1.0 | 1000 | $1,200 | $1.20 | 17d | 1 | 1.16mi |
| 1621 E Evelyn Ave Hazel Park, MI | 2.0 | 1.0 | 749 | $1,295 | $1.73 | 18d | 1 | 1.17mi |
| 1326 E Evelyn Ave Unit 1032332P Hazel Park, MI | 3.0 | 2.0 | 1097 | $6,448 | $5.88 | 2d | 1 | 1.23mi |
| 19450 Fenelon St Detroit, MI | 3.0 | 1.0 | 1062 | $1,384 | $1.30 | 5d | 1 | 1.24mi |
| 19162 Conley St Detroit, MI | 2.0 | 1.0 | 1000 | $1,300 | $1.30 | 44d | 1 | 1.33mi |
| 19361 Moenart St Unit 1 Detroit, MI | 2.0 | 1.0 | 1000 | $1,100 | $1.10 | 24d | 1 | 1.40mi |
| 407 E Hayes Ave Hazel Park, MI | 3.0 | 1.0 | 1000 | $1,750 | $1.75 | 24d | 1 | 1.41mi |
| 18891 Moenart St Detroit, MI | 3.0 | 1.0 | 870 | $1,195 | $1.37 | 17d | 1 | 1.45mi |
| 18891 Moenart St Detroit, MI | 3.0 | 1.0 | 1150 | $1,300 | $1.13 | 2d | 1 | 1.45mi |
| 1731 E Pearl Ave Hazel Park, MI | 3.0 | 1.0 | 844 | $1,500 | $1.78 | 20d | 1 | 1.45mi |
| 20794 Audrey Ave Warren, MI | 3.0 | 1.0 | 954 | $1,350 | $1.42 | 44d | 1 | 1.48mi |
| 19260 Bloom St Detroit, MI | 3.0 | 1.0 | 1100 | $1,350 | $1.23 | 4d | 1 | 1.49mi |
| 18677 Moenart St Detroit, MI | 2.0 | 1.0 | 1470 | $1,200 | $0.82 | 44d | 1 | 1.49mi |
Listing history 11 events
-
2026-06-18days on market $115,000 Active 15 DOM
-
2026-06-17days on market $115,000 Active 14 DOM
-
2026-06-16pricedays on market $115,000 Active 13 DOM
-
2026-06-15days on market $118,000 Active 12 DOM
-
2026-06-13days on market $118,000 Active 10 DOM
-
2026-06-13days on market $118,000 Active 9 DOM
-
2026-06-09days on market $118,000 Active 6 DOM
-
2026-06-08days on market $118,000 Active 5 DOM
-
2026-06-07days on market $118,000 Active 4 DOM
-
2026-06-04remarks 699-char remark
Show marketing remark (1074 chars)
Welcome to this impeccably maintained brick home, featuring 3 bedrooms and 1 bathroom. The property offers over 1,300 square feet of living space and boasts an abundance of natural light. Its huge backyard is perfect for hosting summer barbecues, gardening, or simply relaxing. The home is situated on a quiet, friendly street within the highly sought-after State Fair/Nolan neighborhood on Detroit's East Side. Its location is extremely convenient: less than 5 minutes from Meijer, Kroger, and Aldi (all located within 1 to 2 miles), as well as the I-75 and I-94 highways. Additionally, it is close to the Eastland Center shopping and dining complex, as well as local schools, churches, and parks. The house stands out thanks to its solid brick construction and features a spacious basement ready for your finishing touches. It is the ideal choice for first-time homebuyers, investors, or anyone seeking an affordable space in an excellent area. Homes on this pleasant street tend to sell very quickly. The property is equipped with a security system and is monitored 24/7.
-
2026-06-04$118,000 Active 1 DOM
Show marketing remark (1074 chars)
Welcome to this impeccably maintained brick home, featuring 3 bedrooms and 1 bathroom. The property offers over 1,300 square feet of living space and boasts an abundance of natural light. Its huge backyard is perfect for hosting summer barbecues, gardening, or simply relaxing. The home is situated on a quiet, friendly street within the highly sought-after State Fair/Nolan neighborhood on Detroit's East Side. Its location is extremely convenient: less than 5 minutes from Meijer, Kroger, and Aldi (all located within 1 to 2 miles), as well as the I-75 and I-94 highways. Additionally, it is close to the Eastland Center shopping and dining complex, as well as local schools, churches, and parks. The house stands out thanks to its solid brick construction and features a spacious basement ready for your finishing touches. It is the ideal choice for first-time homebuyers, investors, or anyone seeking an affordable space in an excellent area. Homes on this pleasant street tend to sell very quickly. The property is equipped with a security system and is monitored 24/7.
ⓘ Source: listings_history table (triggers on properties + properties_extension) + one-shot
backfill from property_details.listing_events for pre-trigger history.
Tax reassessment forecast MI · Partial reset (capped growth)
- Current annual tax
- $2,844 · $237/mo
- Projected year-2 tax
- $2,844 · $237/mo
- Expected delta
- $0/yr ($0/mo · 0.0%)
ⓘ Screening estimate from a state-policy table — verify with the county assessor before closing.
Climate risk First Street
- Flood 7/10 Severe FEMA zone X (unshaded) · 97% chance over 30 yrs
- Wildfire 1/10 Low
- Heat 3/10 Moderate 7 d/yr ≥97°F today · 15 d/yr by 30 yrs out
- Wind 2/10 Low
- Air quality 4/10 Moderate 4 unhealthy d/yr today · 6 by 30 yrs out
Nearby sold comps map
Loading sold comps map…
Walkable amenities ~0.75 mi
Loading nearby amenities…
Taxation est. · year 1
- Rental income
- $16,129
- − Mortgage interest
- −$6,442
- − Property taxes
- −$2,844
- − Insurance
- −$1,242
- − Repairs & maintenance
- −$1,290
- − Management
- −$1,290
- − Depreciation
- −$3,345
- Taxable loss
- −$324
- Est. tax savings @ 24.0%
- +$78
- After-tax cash flow
- $1,498/yr
For passive investors: Depreciation is non-cash, so a rental often shows a tax loss while cash-flowing — sheltering income. Rental losses are passive: they offset passive income freely, and up to $25,000/yr can offset ordinary (W-2) income if you actively participate and your MAGI is under $100k (phasing out to $0 by $150k); unused losses carry forward. On sale, claimed depreciation is recaptured at up to 25%, and gains may owe capital-gains tax (a 1031 exchange can defer both). Figures are a year-1 estimate at your 24.0% rate — not tax advice; consult a CPA.
Schools (NCES district)
- District
- Detroit Public Schools Community District
- NCES district ID
- 2601103
- Math proficiency
- 10% ▼ -2.00%
- Reading proficiency
- 24% ▲ 6.00%
- Median HH income
- $25,815
- Composite
- 13.06/100
- National rank
- #9564
- State rank
- #499 of 540 in MI
Livability — Detroit
- Score
- 73/100
- State rank
- #218
- US rank
- #5427
Category grades
Schools grade is shown separately in the Schools card above.
Census & demographics
- Census place
- Detroit, MI
- County
- Wayne County · 1,562,939 people
- City population
- 572,865
- Metro
- Detroit-Warren-Dearborn, MI
- Population (ZIP)
- 32,760
- Household income
- $35,322
- Rent vs Own
- Severe rent burden
- 2372.0
Population outlook (Wayne County) Hauer SSP2
- Today (2025)
- 1,675,273 people
- By 2030
- 1,620,300 · -3.3%
- By 2040
- 1,502,341 · -10.3%
- By 2050
- 1,384,039 · -17.4%
- By 2075
- 1,124,592 · -32.9%
- By 2100
- 881,193 · -47.4%
Race, ethnicity, and origin ACS 2023
- Neighborhood character
- Predominantly Black (94%)
- Race & ethnicity
- Black 94% White 3% Two or more races 1%
- Common ancestry
- Romanian 1%
- Foreign-born
- 2% · Canada, Vietnam, Philippines
- Languages at home
- 97% English-only · French/Haitian/Cajun 1%
Political lean MEDSL · Wayne
- 2024 margin
- Strong D (+29.0) · D 62.7% · R 33.7% · Other 3.6%
- 2008→2024 swing
- -20.5pp toward R · 2008: 49.5pp · 2024: 29.0pp
- All cycles
- 2024: D+29.0 2020: D+38.1 2016: D+37.3 2012: D+46.9 2008: D+49.5
Not yet ingested
- Civics
- —
Market trends
- HPI YoY
- ▼ -44.65%
- Current HPI
- 328.8978
- Rent YoY
- ▲ 6.72%
- Metro
- Detroit-Warren-Dearborn, MI
- State GDP YoY
- ▲ 1.37%
- F500 in state
- 28
Industry mix (Fortune 500 HQ in MI)
| Industry | F500 HQs | Revenue |
|---|---|---|
| Automotive Parts | 3 | $48B |
|
||
| Automotive | 2 | $372B |
|
||
| Chemicals | 1 | $45B |
|
||
| Automotive Retail | 1 | $29B |
|
||
| Healthcare / Medical Devices | 1 | $23B |
|
||
| Automotive Technology | 1 | $20B |
|
||
Price history
+68.6% since first listed18 events — show timeline
- 2026-06-04 Listed $118,000 MiRealSource-MiMLS
- 2026-06-04 Listed $118,000 REALCOMP
- 2026-06-04 Coming Soon $118,000 MiRealSource-MiMLS
- 2026-01-09 Listing Removed — MiRealSource-MiMLS
- 2026-01-09 Listing Removed — REALCOMP
- 2025-12-17 Listed $115,000 MiRealSource-MiMLS
- 2025-12-17 Listed $115,000 REALCOMP
- 2021-10-22 Sold (Public Records) $105,000 Public Records
- 2009-05-14 Sold (MLS) $3,500 REALCOMP
- 2009-05-14 Sold (MLS) $3,500 MiRealSource-MiMLS
- 2009-03-25 Listing Removed — MiRealSource-MiMLS
- 2009-03-13 Listed $2,500 REALCOMP
- 2009-03-13 Listed $2,500 MiRealSource-MiMLS
- 2008-07-10 Listing Removed — REALCOMP
- 2008-03-25 Listed $19,900 REALCOMP
- 2005-07-14 Sold (Public Records) $83,700 Public Records
- 2004-08-01 Listing Removed — REALCOMP
- 2004-04-14 Listed $70,000 REALCOMP
Property tax history
+11.3%/yrLatest (2025): $2,844 · +99.3% YoY. Source: county tax records.
Cash-flow waterfall
monthlySold comps — $/sqft
last 12 mo · ≤1 miLoading sold comps…