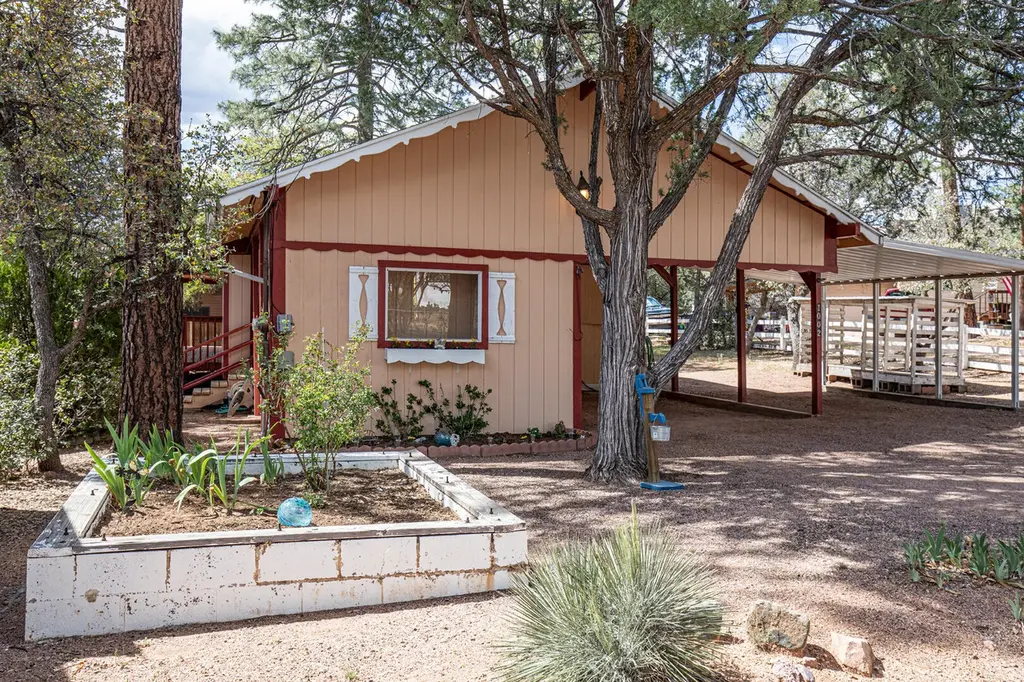
1002 N Chalet Cir · Payson, AZ
Flood risk 1/10 · Minimal
- FEMA flood zone
- X (unshaded)
- Chance of flooding over 30 yrs
- 0.0%
- Est. flood insurance / yr
- $507 – $1,088
Fire risk 9/10 · Severe
- Est. fire insurance / yr
- $610 – $1,132
Heat risk 4/10 · Minor
- Hot days now (above 96°F)
- 7 days/yr
- Hot days in 30 yrs
- 17 days/yr
Wind risk 1/10 · Minimal
- Chance of severe wind over 30 yrs
- —
Air-quality risk 1/10 · Minimal
- Unhealthy air days now
- 0 days/yr
- Unhealthy air days in 30 yrs
- 0 days/yr
Risk factors via First Street. Map © Google.
Why this score? — see what drove the D- grade
The composite is a weighted blend of 9 inputs, each scored 0–100. Each bar is that input's sub-score; the figure is the points it added to the 100-point composite (weight × sub-score).
- Cash flow +13.7/30.0
- DSCR +4.1/10.0
- ARV discount +4.1/15.0
- Livability +3.5/5.0
- 1% rule +2.6/10.0
- Rent growth +2.5/5.0
- Condition / age +2.5/5.0
- Schools +2.2/10.0
- Appreciation +0.0/10.0
$199,000
🖨 Deal sheet 📄 Offer letter ✓ Due diligence
Listing remarks MLS
Shaded by towering Ponderosa pines on a quiet cul-de-sac, with a spacious and inviting living area, this mountain hideaway offers a large, cool, covered deck to enjoy the gentle breezes whispering through the pines. Inside the charm is accented by the tile background surrounding the wood stove and the built in shelving and wood paneling.
Key facts
- Wood stove
- Quiet cul-de-sac
- Built in shelving
Tags
Neighborhood map
What this means for you Summary
Snapshot
- This is a 2-bed/1.0-bath manufactured listed at $199k.
Deal economics
- At list price, monthly cash flow is $15 ($174/yr) — positive.
- The deal already cash-flows at list — no discount required.
- To meet the 1% rule (rent ≥ 1% of price), the offer needs to be $151k (24.3% below list).
- Recommended offer: $151k (24.3% below list) — sets the bar for 1% rule.
- Cap rate 6.4% vs local median 3.3% in Payson — top-decile yield for the area; either an underpriced asset or a hidden risk that comps aren't pricing in. Stress-test before assuming the spread holds.
Location & tenants
- Location reads 69/100 on livability (#44 in AZ) — a middle-class / working-renter tenant base. Strengths: housing A, crime B, cost of living B; Watch: schools C-, amenities D-, commute F.
- Payson Unified District (4209) (town): math 20% / reading 32% proficiency, ranked #138 of 249 in AZ (top 55%) — low school quality limits family demand, transient renter base, plan for 1-2y turnover.
- Market conditions: 695 active listings in the ZIP; 217 units permitted in Gila County in 2024 (0 in 5+ unit buildings).
Forward outlook
- Local home prices are declining (-3.0%/yr); year-one equity from $1k of loan paydown is wiped out by about $6k of value loss. Plan a longer hold.
- Gila County population projected at -18% by 2050 — secular population decline; favor cash flow + early exit over multi-decade hold.
Negotiation context
- It's been on market 70 days — a 6% lower offer ($187k) is reasonable based on typical stale-listing flexibility.
- Current owner paid $40k; list at $199k implies a 398% gain — meaningful room to come down on a strong offer.
Risks & watch-outs
- Climate carrying-cost: severe wildfire risk — expect insurance premiums to compound above CPI over the hold.
Questions for the listing agent
- It's been on market 70 days. Have you received any prior offers? Is the seller open to a 24% concession, seller financing, or rate buy-down credit?
- Built in 1971 — when were the roof, HVAC, electrical panel, plumbing, and water heater last replaced?
- Why hasn't it sold? Are there any deal-killer items the seller is aware of (foundation, flood, title, zoning, code violations)?
- Is there a deadline driving the sale (1031 exchange, divorce, estate, relocation)? That informs how much negotiation room exists.
- The area grade is low — what's the realistic commute time and amenity access for the typical tenant pool here? Any planned neighborhood developments (good or bad) we should know about?
- What's the average days-on-market for RENTAL listings here right now (not sales)? A rising rental-DOM trend means longer vacancies and softer asking-rent achievability than the comps imply.
- What's the recent tenant-quality profile in this submarket — average credit score on applications, eviction rate, late-payment / NSF rate, and stable-employment percentage? A property-management company in the area should have these aggregated.
- How much new for-sale + rental construction is in the pipeline within 1–3 miles? Heavy new supply typically softens prices + rents 12–24 months out; constrained supply supports both.
Investment metrics
- 1% rule
- 0.76% ✗
- Cap rate
- 6.38%
- Cash-on-cash
- 0.31%
- DSCR
- 1.01
- GRM
- 11.0
CMA / ARV
- ARV (median comp)
- $184,898
- List price
- $199,000
- Delta
- 7.63%
- Verdict
- FAIR
- Comps
- 5 within 1.0 mi
Show comp detail 2 sales within ~0.75 mi
| Address | Dist | Beds/Ba | Sqft | Sold | Price | $/sf | Match |
|---|---|---|---|---|---|---|---|
| 306 E Forest Dr | 0.40mi | 2/1.0 | 728 (+8%) | 16mo | $132,000 | $181 | 54 |
| 908 N William Tell Cir | 0.55mi | 2/2.0 | 652 (-3%) | 24mo | $93,500 | $143 | 46 |
Match score weights: distance 35% · size 25% · config 20% · recency 20%. Top-matched comps best support the ARV.
Projected returns pro-forma
-3.0% appreciation · 3.0% rent growth · sell at horizon
- IRR
- -15.9%
- Equity multiple
- 0.44×
- Total profit
- $-31,423
- Equity at exit
- $29,672
- IRR
- -7.6%
- Equity multiple
- 0.52×
- Total profit
- $-26,579
- Equity at exit
- $17,206
Cash invested: $55,720 (down + closing). Projections, not guarantees.
Landlord ↔ Tenant lean methodology
- Overall (STATE)
- 87 Strongly Landlord-Friendly
- State Arizona
- 87 Strongly Landlord-Friendly · R+3
- County
- — inherits STATE
- City
- — inherits STATE
ZIP-level market 85541
- Home prices YoY
- -6.6%
- Active inventory
- 695
- Price-to-rent
- 11.0×
Monthly cashflow live
- Estimated rent
- $1,506 medium interval (Pro) →
- Mortgage (P&I)
- −$1,044
- Tax from tax record
- −$49 /mo · $590/yr
- Insurance
- −$83
- HOA
- −$0
- Vacancy / Maint / Mgmt
- −$316
- Net cashflow
- $15
Break-even live
UW: 25.0% down · 7.5% · 30yr · 1.5% tax · 5.0% vac · 8.0% maint · 8.0% mgmt
Financing live
Cash to close
- Down payment
- $49,750
- Closing costs
- $5,970
- Reserves months
- —
- Total cash needed
- —
Loan-product check · same deal, 3 products live
Conventional
25% down · 7.5% · 30yr
- Down + closing
- —
- Monthly P&I
- —
- Monthly cashflow
- —
- DSCR
- —
- Eligible?
- —
Personal DTI + credit; lowest rate.
DSCR
20% down · 8.5% · 30yr
- Down + closing
- —
- Monthly P&I
- —
- Monthly cashflow
- —
- DSCR
- —
- Eligible?
- —
No personal income docs; deal must DSCR.
Hard money
10% down · 12.0% · 12mo
- Down + closing
- —
- Monthly P&I
- —
- Monthly cashflow
- —
- DSCR
- —
- Eligible?
- —
Short-term bridge; refi at stabilization.
Listing history 18 events
-
2026-06-19days on market $199,000 Active 70 DOM
-
2026-06-18days on market $199,000 Active 69 DOM
-
2026-06-17days on market $199,000 Active 68 DOM
-
2026-06-16days on market $199,000 Active 67 DOM
-
2026-06-15days on market $199,000 Active 66 DOM
-
2026-06-14days on market $199,000 Active 64 DOM
-
2026-06-12days on market $199,000 Active 63 DOM
-
2026-06-09days on market $199,000 Active 60 DOM
-
2026-06-08days on market $199,000 Active 59 DOM
-
2026-06-07days on market $199,000 Active 58 DOM
-
2026-06-03days on market $199,000 Active 54 DOM
-
2026-06-02days on market $199,000 Active 53 DOM
-
2026-06-01days on market $199,000 Active 52 DOM
-
2026-05-31days on market $199,000 Active 51 DOM
-
2026-05-31days on market $199,000 Active 50 DOM
-
2026-04-10$199,000 Active 339-char remark
Show marketing remark (339 chars)
Shaded by towering Ponderosa pines on a quiet cul-de-sac, with a spacious and inviting living area, this mountain hideaway offers a large, cool, covered deck to enjoy the gentle breezes whispering through the pines. Inside the charm is accented by the tile background surrounding the wood stove and the built in shelving and wood paneling.
-
1996-10-17soldstatus $40,000
-
1993-12-17soldstatus $39,900
ⓘ Source: listings_history table (triggers on properties + properties_extension) + one-shot
backfill from property_details.listing_events for pre-trigger history.
Tax reassessment forecast AZ · Resets to sale price
- Current annual tax
- $590 · $49/mo
- Projected year-2 tax
- $1,313 · $109/mo
- Expected delta
- +$724/yr (+$60/mo · 122.7%)
ⓘ Screening estimate from a state-policy table — verify with the county assessor before closing.
Climate risk First Street
- Flood 1/10 Low FEMA zone X (unshaded) · 0% chance over 30 yrs
- Wildfire 9/10 Extreme
- Heat 4/10 Moderate 7 d/yr ≥96°F today · 17 d/yr by 30 yrs out
- Wind 1/10 Low
- Air quality 1/10 Low 0 unhealthy d/yr today · 0 by 30 yrs out
Nearby sold comps map
Loading sold comps map…
Walkable amenities ~0.75 mi
Loading nearby amenities…
Taxation est. · year 1
- Rental income
- $18,078
- − Mortgage interest
- −$11,147
- − Property taxes
- −$590
- − Insurance
- −$995
- − Repairs & maintenance
- −$1,446
- − Management
- −$1,446
- − Depreciation
- −$5,789
- Taxable loss
- −$3,335
- Est. tax savings @ 24.0%
- +$800
- After-tax cash flow
- $974/yr
For passive investors: Depreciation is non-cash, so a rental often shows a tax loss while cash-flowing — sheltering income. Rental losses are passive: they offset passive income freely, and up to $25,000/yr can offset ordinary (W-2) income if you actively participate and your MAGI is under $100k (phasing out to $0 by $150k); unused losses carry forward. On sale, claimed depreciation is recaptured at up to 25%, and gains may owe capital-gains tax (a 1031 exchange can defer both). Figures are a year-1 estimate at your 24.0% rate — not tax advice; consult a CPA.
Schools (NCES district)
- District
- Payson Unified District (4209)
- NCES district ID
- 0406070
- Math proficiency
- 20% ▼ -21.00%
- Reading proficiency
- 32% ▼ -16.00%
- Median HH income
- $41,440
- Composite
- 22.03/100
- National rank
- #8200
- State rank
- #138 of 249 in AZ
Livability — Payson
- Score
- 69/100
- State rank
- #44
- US rank
- #8740
Category grades
Schools grade is shown separately in the Schools card above.
Census & demographics
- Census place
- Payson, AZ
- County
- Gila County · 23,382 people
- City population
- 23,382
- Metro
- Payson, AZ
- Population (ZIP)
- 23,382
- Household income
- $66,383
- Rent vs Own
- Severe rent burden
- 523.0
Population outlook (Gila County) Hauer SSP2
- Today (2025)
- 50,229 people
- By 2030
- 48,202 · -4.0%
- By 2040
- 44,101 · -12.2%
- By 2050
- 41,041 · -18.3%
- By 2075
- 37,536 · -25.3%
- By 2100
- 32,485 · -35.3%
Race, ethnicity, and origin ACS 2023
- Neighborhood character
- Predominantly White (84%)
- Race & ethnicity
- White 84% Hispanic / Latino 11% Two or more races 8% Native American 1%
- Hispanic origin (detail)
- Mexican 9%
- Common ancestry
- Portuguese 3% Lithuanian 2% Iranian 2%
- Foreign-born
- 3% · Canada
- Languages at home
- 93% English-only · Spanish 5% German/W. Germanic 1%
Political lean MEDSL · Gila
- 2024 margin
- Solid R (+37.6) · D 30.8% · R 68.4%
- 2008→2024 swing
- -9.8pp toward R · 2008: -27.8pp · 2024: -37.6pp
- All cycles
- 2024: R+37.6 2020: R+34.1 2016: R+32.4 2012: R+26.4 2008: R+27.8
Not yet ingested
- Civics
- —
Market trends
- HPI YoY
- ▼ -29.47%
- Current HPI
- 416.4005
- Rent YoY
- —
- Metro
- Payson, AZ
- State GDP YoY
- ▲ 4.54%
- F500 in state
- 20
Industry mix (Fortune 500 HQ in AZ)
| Industry | F500 HQs | Revenue |
|---|---|---|
| Technology | 2 | $13B |
|
||
| Mining / Metals | 1 | $23B |
|
||
| Environmental Services | 1 | $16B |
|
||
| Metals / Steel | 1 | $14B |
|
||
| Technology Distribution | 1 | $9B |
|
||
| Homebuilding | 1 | $8B |
|
||
Price history
+398.7% since first listed3 events — show timeline
- 2026-04-10 Listed $199,000 CAAR
- 1996-10-17 Sold (Public Records) $40,000 Public Records
- 1993-12-17 Sold (Public Records) $39,900 Public Records
Property tax history
-0.1%/yrLatest (2025): $590 · +0.8% YoY. Source: county tax records.
Cash-flow waterfall
monthlySold comps — $/sqft
last 12 mo · ≤1 miLoading sold comps…