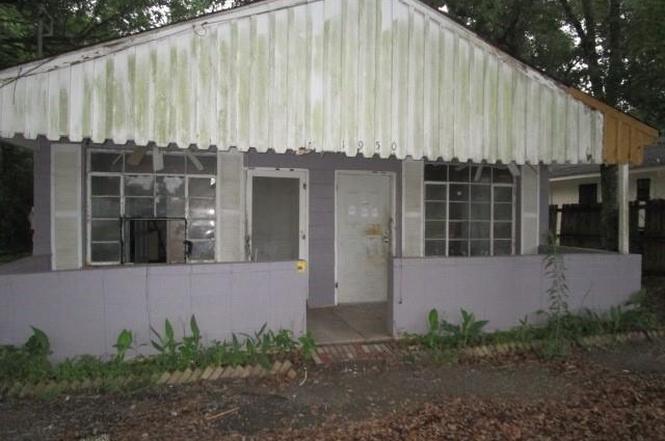
1950 Pleasant Ave · Mobile, AL
Flood risk 1/10 · Minimal
- FEMA flood zone
- X (unshaded)
- Chance of flooding over 30 yrs
- 0.0%
- Est. flood insurance / yr
- $507 – $1,088
Fire risk 1/10 · Minimal
- Est. fire insurance / yr
- $916 – $1,700
Heat risk 9/10 · Severe
- Hot days now (above 104°F)
- 7 days/yr
- Hot days in 30 yrs
- 21 days/yr
Wind risk 9/10 · Severe
- Chance of severe wind over 30 yrs
- 99.0%
Air-quality risk 2/10 · Minimal
- Unhealthy air days now
- 1 days/yr
- Unhealthy air days in 30 yrs
- 1 days/yr
Risk factors via First Street. Map © Google.
Why this score? — see what drove the B- grade
The composite is a weighted blend of 9 inputs, each scored 0–100. Each bar is that input's sub-score; the figure is the points it added to the 100-point composite (weight × sub-score).
- Cash flow +30.0/30.0
- 1% rule +10.0/10.0
- DSCR +10.0/10.0
- Appreciation +7.4/10.0
- Livability +3.8/5.0
- Rent growth +2.5/5.0
- Schools +2.3/10.0
- Condition / age +1.0/5.0
- ARV discount +0.0/15.0
$73,200
🖨 Deal sheet (PDF) 📄 Offer letter ✓ Due diligence
Listing remarks
Investor special duplex in the heart of midtown Mobile. The property was income producing and just waiting to have the right owner with the right potential.
Key facts
- 8,755 sq ft lot
- Listed 3 days
Property features AI
Exterior
- Parking: No parking
- Utilities: Water available; Electric: other; Sewer: other; No land lease
- Home design: Single Family Residence; Residential property
- Construction: Block construction; Composition roof; Block foundation; Located in Pleasant View subdivision
- Exterior features: No special exterior features; No fencing; View available
Interior
- Kitchen: Eat-in kitchen
- Bedrooms: 2 bedrooms
- Flooring: Vinyl flooring
- Bathrooms: 2 full bathrooms
- Heating & cooling: No heating; No cooling
- Interior features: Other interior features; No fireplace; Eat-in kitchen
Neighborhood map
What this means for you Summary
Snapshot
- This is a 2-bed/2.0-bath single-family listed at $73k. Condition is rated poor.
Deal economics
- At list price, monthly cash flow is $482 ($6k/yr) — positive.
- The deal already cash-flows at list — no discount required.
- Meets the 1% rule at list price ($1k rent vs $73k).
- Cap rate 14.2% vs local median 4.9% in Mobile — top-decile yield for the area; either an underpriced asset or a hidden risk that comps aren't pricing in. Stress-test before assuming the spread holds.
Location & tenants
- Location reads 75/100 on livability (#20 in AL, #4,262 nationally) — a middle-class / working-renter tenant base. Strengths: commute A+, cost of living A+, housing A+; Watch: crime F, employment D-.
- Mobile County (urban): math 15% / reading 39% proficiency, ranked #81 of 129 in AL (top 63%) — low school quality limits family demand, transient renter base, plan for 1-2y turnover; 67% free/reduced lunch — lower-income household profile, screen leases tightly.
- Zoned schools: Holloway Elementary (math 5% / reading 19%, grade F, #554 of 627 statewide, top 88%, 498 students, 98% FRL); Booker T Washington Middle School (math 0% / reading 12%, grade F, #252 of 257 statewide, top 98%, 340 students, 95% FRL); John L Leflore Magnet School (math 2% / reading 2%, grade F, #291 of 305 statewide, top 100%, 618 students, 84% FRL) — zoned schools average 92% FRL vs 67% district-wide (25 pts higher); higher-poverty schools than district average — tighter screening recommended.
- Zoned-school proficiency averages 7% at this address vs 27% district-wide (-20 pts) — the specific schools serving this property underperform the Mobile County average; the district grade overstates school quality for this exact location.
- Market conditions: 40 active listings in the ZIP; 11 comparable units currently listed for rent nearby; rentals at typical pace (median 23d on market — plan ~3-4 weeks tenant-placement turnaround); 1,678 units permitted in Mobile County in 2024 (264 in 5+ unit buildings).
Forward outlook
- In year one you build about $4k of equity ($506 loan paydown + $3k appreciation (4.8% local appreciation)).
- Mobile County population projected to shrink 8% by 2050 — rents likely to lag national; underwrite the cash flow, not the appreciation.
- At projected returns (4.8% appreciation + 3.0% rent growth), your $20k cash investment doubles in ~3 years — after that, you're playing with house money.
- By year 8, paydown + projected appreciation supports a ~$30k cash-out refi (75% LTV) — recoverable capital for the next deal without selling this one.
Negotiation context
- Only 3 days on market — expect competitive offers; lowballing is unlikely to land.
Risks & watch-outs
- Climate carrying-cost: severe wind risk, 99% chance of damaging wind over 30y; extreme-heat days projected 7→21/yr by 2055 (HVAC capex compounding) — expect insurance premiums to compound above CPI over the hold.
Questions for the listing agent
- Have any recent inspections been done? Can we get a copy of the seller's disclosures and any deferred-maintenance estimates?
- Is there a deadline driving the sale (1031 exchange, divorce, estate, relocation)? That informs how much negotiation room exists.
- Schools are D-rated, which usually means shorter tenancies and higher turnover. Who's the typical renter profile here, and what's been the actual vacancy rate?
- Crime grade is F in this area — have there been break-ins, vandalism, or insurance claims at this property in the last 3 years? What carrier currently insures it and at what premium?
- What's the average days-on-market for RENTAL listings here right now (not sales)? A rising rental-DOM trend means longer vacancies and softer asking-rent achievability than the comps imply.
- What's the recent tenant-quality profile in this submarket — average credit score on applications, eviction rate, late-payment / NSF rate, and stable-employment percentage? A property-management company in the area should have these aggregated.
- How much new for-sale + rental construction is in the pipeline within 1–3 miles? Heavy new supply typically softens prices + rents 12–24 months out; constrained supply supports both.
Investment metrics
- 1% rule
- 1.71% ✓
- Cap rate
- 14.19%
- Cash-on-cash
- 28.21%
- DSCR
- 2.25
- GRM
- 4.9
CMA / ARV
- ARV (on-the-fly)
- $59,280
- Comps found
- 11
Show comp detail 11 sales within ~0.75 mi
| Address | Dist | Beds/Ba | Sqft | Sold | Price | $/sf | Match |
|---|---|---|---|---|---|---|---|
| 2005 Mott Dr W | 0.40mi | 2/1.0 | 939 (-5%) | 13mo | $38,000 | $40 | 59 |
| 2024 Mott Dr W | 0.52mi | 2/1.0 | 1,070 (+8%) | 0mo | $38,500 | $36 | 58 |
| 557 Kent St | 0.64mi | 2/1.0 | 1,008 (+2%) | 10mo | $37,500 | $37 | 54 |
| 567 Kent St | 0.69mi | 3/1.0 (+1) | 997 (+1%) | 3mo | $39,000 | $39 | 54 |
| 2253 Barlow St | 0.54mi | 3/1.0 (+1) | 970 (-2%) | 13mo | $59,500 | $61 | 52 |
| 1869 S Mott Dr | 0.37mi | 3/1.0 (+1) | 1,076 (+9%) | 13mo | $95,000 | $88 | 48 |
| 500 Summerville St | 0.53mi | 3/1.0 (+1) | 1,036 (+5%) | 15mo | $54,300 | $52 | 46 |
| 2001 Diggs Ave | 0.46mi | 3/1.0 (+1) | 914 (-8%) | 20mo | $75,000 | $82 | 40 |
| 1510 Congress St | 0.71mi | 3/1.0 (+1) | 941 (-5%) | 13mo | $64,900 | $69 | 39 |
| 2106 General Gorgas Dr N | 0.73mi | 3/1.0 (+1) | 975 (-1%) | 19mo | $148,000 | $152 | 39 |
| 2304 Rushing Dr | 0.73mi | 3/1.0 (+1) | 1,092 (+10%) | 4mo | $65,000 | $60 | 36 |
Match score weights: distance 35% · size 25% · config 20% · recency 20%. Top-matched comps best support the ARV.
Projected returns pro-forma
4.78% appreciation · 3.0% rent growth · sell at horizon
- IRR
- 37.2%
- Equity multiple
- 3.28×
- Total profit
- $46,644
- Equity at exit
- $40,493
- IRR
- 35.6%
- Equity multiple
- 6.61×
- Total profit
- $114,979
- Equity at exit
- $69,082
Cash invested: $20,496 (down + closing). Projections, not guarantees.
Landlord ↔ Tenant lean methodology
- Overall (STATE)
- 90 Strongly Landlord-Friendly
- State Alabama
- 90 Strongly Landlord-Friendly · R+15
- County
- — inherits STATE
- City
- — inherits STATE
ZIP-level market 36617
- Home prices YoY
- 3.9%
- Active inventory
- 40
- Price-to-rent
- 4.9×
Monthly cashflow live
- Estimated rent
- $1,250 high interval (Pro) →
- Mortgage (P&I)
- −$384
- Tax est. 1.5%
- −$92 /mo · $1,098/yr
- Insurance
- −$30
- HOA
- −$0
- Vacancy / Maint / Mgmt
- −$263
- Net cashflow
- $482
Break-even live
Sensitivity live
| Price | -10% $532 | -5% $507 | +0% $482 | +5% $456 | +10% $431 |
|---|---|---|---|---|---|
| Rent | -10% $383 | -5% $432 | +0% $482 | +5% $531 | +10% $581 |
| Rate | -1.0pp $519 | -0.5pp $500 | base $482 | +0.5pp $463 | +1.0pp $443 |
UW: 25.0% down · 7.5% · 30yr · 1.5% tax · 5.0% vac · 8.0% maint · 8.0% mgmt
Financing live
Cash to close
- Down payment
- $18,300
- Closing costs
- $2,196
- Reserves months
- —
- Total cash needed
- —
Loan-product check · same deal, 3 products live
Conventional
25% down · 7.5% · 30yr
- Down + closing
- —
- Monthly P&I
- —
- Monthly cashflow
- —
- DSCR
- —
- Eligible?
- —
Personal DTI + credit; lowest rate.
DSCR
20% down · 8.5% · 30yr
- Down + closing
- —
- Monthly P&I
- —
- Monthly cashflow
- —
- DSCR
- —
- Eligible?
- —
No personal income docs; deal must DSCR.
Hard money
10% down · 12.0% · 12mo
- Down + closing
- —
- Monthly P&I
- —
- Monthly cashflow
- —
- DSCR
- —
- Eligible?
- —
Short-term bridge; refi at stabilization.
Rent comps 11 comps
| Address | Beds | Baths | Sqft | Rent | $/sqft | DOM | Units | Dist |
|---|---|---|---|---|---|---|---|---|
| 350 Stanton Rd Unit D25 Mobile, AL | 1.0 | 1.0 | 588 | $895 | $1.52 | 46d | 1 | 0.31mi |
| 186 Stanton Rd Mobile, AL | 1.0–3.0 | 1.0–2.5 | 1263 | $2,062 | $1.63 | 46d | 1 | 0.56mi |
| 12 S Catherine St Unit 2 Mobile, AL | 1.0 | 1.0 | 700 | $725 | $1.04 | 23d | 1 | 1.16mi |
| 2161 Homewood St Unit B Mobile, AL | 1.0 | 1.0 | 600 | $1,295 | $2.16 | 23d | 1 | 1.27mi |
| 57 N Ann St Unit 1043453P Mobile, AL | 2.0 | 2.0 | 1065 | $2,015 | $1.89 | 23d | 1 | 1.30mi |
| 1254 Old Shell Rd Mobile, AL | 1.0–2.0 | 1.0 | 660 | $975 | $1.48 | 15d | 4 | 1.32mi |
| 111 S Catherine St Mobile, AL | 2.0 | 1.0 | 891 | $899 | $1.01 | 46d | 1 | 1.34mi |
| 104 Ellinor St Mobile, AL | 2.0 | 1.0 | 896 | $1,275 | $1.42 | 23d | 1 | 1.40mi |
| 113 Randolph St Unit 1 Mobile, AL | 1.0 | 1.0 | 800 | $958 | $1.20 | 23d | 1 | 1.41mi |
| 2604 Dauphin St Mobile, AL | 2.0 | 1.0 | 950 | $1,072 | $1.13 | 46d | 2 | 1.46mi |
| 2604 Dauphin St #210 Mobile, AL | 2.0 | 1.0 | 950 | $1,150 | $1.21 | 23d | 1 | 1.46mi |
Listing history 3 events
-
2026-06-21days on market $73,200 Active 3 DOM
-
2026-06-18remarks 156-char remark
-
2026-06-18$73,200 Active 1 DOM
ⓘ Source: listings_history table (triggers on properties + properties_extension) + one-shot
backfill from property_details.listing_events for pre-trigger history.
Climate risk First Street
- Flood 1/10 Low FEMA zone X (unshaded) · 0% chance over 30 yrs
- Wildfire 1/10 Low
- Heat 9/10 Extreme 7 d/yr ≥104°F today · 21 d/yr by 30 yrs out
- Wind 9/10 Extreme 99% chance of damaging wind over 30 yrs
- Air quality 2/10 Low 1 unhealthy d/yr today · 1 by 30 yrs out
Nearby sold comps map
Loading sold comps map…
Walkable amenities ~0.75 mi
Loading nearby amenities…
Taxation est. · year 1
- Rental income
- $15,002
- − Mortgage interest
- −$4,100
- − Property taxes
- −$1,098
- − Insurance
- −$366
- − Repairs & maintenance
- −$1,200
- − Management
- −$1,200
- − Depreciation
- −$2,129
- Taxable income
- $4,908
- Est. tax owed @ 24.0%
- −$1,178
- After-tax cash flow
- $4,603/yr
For passive investors: Depreciation is non-cash, so a rental often shows a tax loss while cash-flowing — sheltering income. Rental losses are passive: they offset passive income freely, and up to $25,000/yr can offset ordinary (W-2) income if you actively participate and your MAGI is under $100k (phasing out to $0 by $150k); unused losses carry forward. On sale, claimed depreciation is recaptured at up to 25%, and gains may owe capital-gains tax (a 1031 exchange can defer both). Figures are a year-1 estimate at your 24.0% rate — not tax advice; consult a CPA.
Condition & rehab AI · 6 photos
This property requires extensive repairs and improvements to become move-in ready. Significant structural and aesthetic issues need addressing to increase its value.
Repairs flagged
- Major roof — Significant damage and visible leaks
- Major exterior siding — Severe peeling and damage
- Major flooring — Exposed subflooring and missing flooring
- Major interior walls — Peeling paint and exposed drywall
Value-add opportunities
- Both Landscaping and curb appeal improvements — Enhances curb appeal and property value
- Both Roof replacement — Fixes major structural issue and improves property value
- Both Exterior siding repair and repainting — Improves property appearance and value
- Both Flooring replacement — Fixes major structural issue and improves property value
- Both Interior wall repair and repainting — Improves property appearance and value
Renovation cost estimate screening
| Repair item | Severity | Est. cost |
|---|---|---|
| roof · Significant damage and visible leaks | Major | $15,000–50,000 |
| exterior siding · Severe peeling and damage | Major | $15,000–50,000 |
| flooring · Exposed subflooring and missing flooring | Major | $15,000–50,000 |
| interior walls · Peeling paint and exposed drywall | Major | $15,000–50,000 |
| Total estimated repair cost · 4 items | $60,000–200,000 |
Value-add ROI direction
- Both Landscaping and curb appeal improvements — Enhances curb appeal and property value ↑
- Both Roof replacement — Fixes major structural issue and improves property value ↑
- Both Exterior siding repair and repainting — Improves property appearance and value ↑
- Both Flooring replacement — Fixes major structural issue and improves property value ↑
- Both Interior wall repair and repainting — Improves property appearance and value ↑
ⓘ Cost ranges are severity-bucket heuristics (US national rule-of-thumb). Get contractor quotes + a written scope before underwriting a rehab budget.
Schools (NCES district)
- District
- Mobile County
- NCES district ID
- 0102370
- Math proficiency
- 15% ▼ -28.00%
- Reading proficiency
- 39% ▬ 0.00%
- Median HH income
- $42,455
- Composite
- 22.9/100
- National rank
- #8002
- State rank
- #81 of 129 in AL
Livability — Mobile
- Score
- 75/100
- State rank
- #20
- US rank
- #4262
Category grades
Schools grade is shown separately in the Schools card above.
Census & demographics
- Census place
- Mobile, AL
- City population
- 205,729
- Population (ZIP)
- 11,952
Population outlook (Mobile County) Hauer SSP2
- Today (2025)
- 415,303 people
- By 2030
- 411,755 · -0.9%
- By 2040
- 399,670 · -3.8%
- By 2050
- 382,616 · -7.9%
- By 2075
- 337,353 · -18.8%
- By 2100
- 283,391 · -31.8%
Race, ethnicity, and origin ACS 2023
- Neighborhood character
- Predominantly Black (97%)
- Race & ethnicity
- Black 97% White 2%
- Foreign-born
- 0%
Political lean MEDSL · Mobile
- 2024 margin
- R (+16.4) · D 41.3% · R 57.7%
- 2008→2024 swing
- -7.7pp toward R · 2008: -8.7pp · 2024: -16.4pp
- All cycles
- 2024: R+16.4 2020: R+11.9 2016: R+13.9 2012: R+9.3 2008: R+8.7
Not yet ingested
- Civics
- —
Market trends
- HPI YoY
- ▲ 4.78%
- Current HPI
- 128.8377
- Rent YoY
- —
- Metro
- —
- State GDP YoY
- ▲ 2.94%
- F500 in state
- 4
Industry mix (Fortune 500 HQ in AL)
| Industry | F500 HQs | Revenue |
|---|---|---|
| Financial Services | 1 | $8B |
|
||
| Healthcare | 1 | $5B |
|
||
Price history
1 event — show timeline
- 2026-06-18 Listed $73,200 GCMLS AL
Cash-flow waterfall
monthlySold comps — $/sqft
last 12 mo · ≤1 miLoading sold comps…