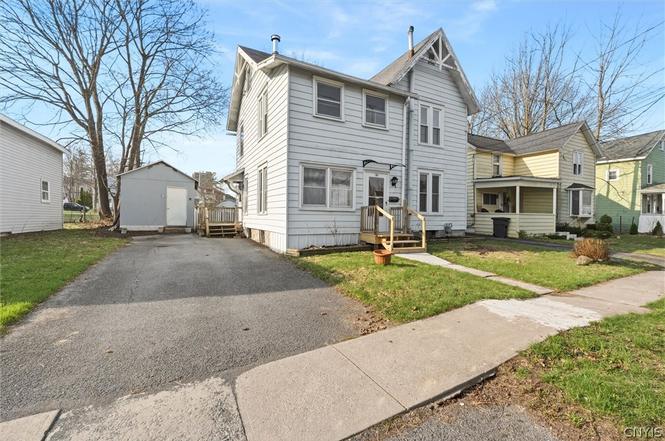
16 Aspen St · Auburn, NY
Flood risk 1/10 · Minimal
- FEMA flood zone
- X (unshaded)
- Chance of flooding over 30 yrs
- 0.0%
- Est. flood insurance / yr
- $473 – $860
Fire risk 1/10 · Minimal
- Est. fire insurance / yr
- $691 – $1,283
Heat risk 2/10 · Minimal
- Hot days now (above 96°F)
- 7 days/yr
- Hot days in 30 yrs
- 15 days/yr
Wind risk 1/10 · Minimal
- Chance of severe wind over 30 yrs
- 1.0%
Air-quality risk 2/10 · Minimal
- Unhealthy air days now
- 0 days/yr
- Unhealthy air days in 30 yrs
- 1 days/yr
Risk factors via First Street. Map © Google.
Why this score? — see what drove the B grade
The composite is a weighted blend of 9 inputs, each scored 0–100. Each bar is that input's sub-score; the figure is the points it added to the 100-point composite (weight × sub-score).
- Cash flow +30.0/30.0
- ARV discount +10.7/15.0
- DSCR +10.0/10.0
- 1% rule +8.8/10.0
- Livability +3.7/5.0
- Schools +3.0/10.0
- Rent growth +2.5/5.0
- Condition / age +2.5/5.0
- Appreciation +0.0/10.0
$132,500
🖨 Deal sheet 📄 Offer letter ✓ Due diligence
Listing remarks
Charming 3 bedroom 1.5 bath home just steps from public parks, transportation, schools and shopping combines comfort with unbeatable convenience. Enjoy an open-concept living room that connects effortlessly to a formal dining room that is perfect for gatherings featuring a beautiful window that fills the space with abundant natural light The downstairs half bath is thoughtfully placed near the kitchen with direct access from the deck, ideal for guest when entertaining outdoors. Well designed galley kitchen has plenty of counter space, ample storage an efficient workflow The upper level offers three good sized bedrooms, a full bathroom and a versatile bonus room ideal for fourth bedroo
Key facts
- Formal dining room
- Galley kitchen
- Downstairs half bath
Tags
Property features AI
Exterior
- Parking: No garage
- Utilities: Cable available; High-speed internet available; Public water connected; Sewer connected; Circuit breaker electrical service; Gas water heater
- Home design: 2-story existing residence
- Construction: Aluminum siding; Copper plumbing; Asphalt roof; Stone foundation; Built as existing structure
- Exterior features: Blacktop driveway; Deck; Near public transit; Rectangular residential lot; City street frontage; Lot dimensions approximately 49 x 100
Interior
- Kitchen: Dishwasher; Gas oven; Gas range; Refrigerator
- Bedrooms: 7 total rooms (includes living and laundry areas)
- Flooring: Carpet; Ceramic tile; Hardwood; Laminate; Varied flooring
- Bathrooms: 1 full bathroom; 1 half bathroom; Main level bathroom available
- Heating & cooling: Gas forced-air heating
- Interior features: Ceiling fan(s); Separate/formal dining room; Separate/formal living room; Full basement
- Laundry & utility: Main level laundry
Neighborhood map
What this means for you Summary
Snapshot
- This is a 3-bed/1.5-bath single-family listed at $132k.
Deal economics
- At list price, monthly cash flow is $558 ($7k/yr) — positive.
- The deal already cash-flows at list — no discount required.
- Meets the 1% rule at list price ($2k rent vs $132k).
- Recommended offer: $121k (9.0% below list) — sets the bar for market timing.
- Cap rate 11.3% vs local median 7.6% in Auburn — top-decile yield for the area; either an underpriced asset or a hidden risk that comps aren't pricing in. Stress-test before assuming the spread holds.
Location & tenants
- Location reads 74/100 on livability (#298 in NY, #4,814 nationally) — a middle-class / working-renter tenant base. Strengths: cost of living A+, housing A+, health & safety A+; Watch: schools D, amenities D-, commute F.
- Auburn City School District (town): math 31% / reading 39% proficiency, ranked #558 of 590 in NY (top 95%) — families likely to look elsewhere, expect single-tenant / working-renter base with shorter leases.
- Market conditions: 221 active listings in the ZIP; 161 units permitted in Cayuga County in 2024 (65 in 5+ unit buildings).
- This rent runs 36% of the median local income ($61k/yr) — at the standard rent-burdened threshold; future hikes will face affordability resistance.
Forward outlook
- Local home prices are declining (-3.0%/yr); year-one equity from $916 of loan paydown is wiped out by about $4k of value loss. Plan a longer hold.
- Cayuga County population projected at -18% by 2050 — secular population decline; favor cash flow + early exit over multi-decade hold.
- At projected returns (-3.0% appreciation + 3.0% rent growth), your $37k cash investment doubles in ~7 years — after that, you're playing with house money.
Negotiation context
- It's been on market 119 days — a 9% lower offer ($121k) is reasonable based on typical stale-listing flexibility.
- Current owner paid $37k; list at $132k implies a 258% gain — meaningful room to come down on a strong offer.
Risks & watch-outs
- Watch-outs: built in 1900 — expect roof / HVAC / electrical / plumbing capex.
Questions for the listing agent
- It's been on market 119 days. Have you received any prior offers? Is the seller open to a 9% concession, seller financing, or rate buy-down credit?
- Built in 1900 — when were the roof, HVAC, electrical panel, plumbing, and water heater last replaced?
- Why hasn't it sold? Are there any deal-killer items the seller is aware of (foundation, flood, title, zoning, code violations)?
- Is there a deadline driving the sale (1031 exchange, divorce, estate, relocation)? That informs how much negotiation room exists.
- Schools are D-rated, which usually means shorter tenancies and higher turnover. Who's the typical renter profile here, and what's been the actual vacancy rate?
- What's the average days-on-market for RENTAL listings here right now (not sales)? A rising rental-DOM trend means longer vacancies and softer asking-rent achievability than the comps imply.
- What's the recent tenant-quality profile in this submarket — average credit score on applications, eviction rate, late-payment / NSF rate, and stable-employment percentage? A property-management company in the area should have these aggregated.
- How much new for-sale + rental construction is in the pipeline within 1–3 miles? Heavy new supply typically softens prices + rents 12–24 months out; constrained supply supports both.
Investment metrics
- 1% rule
- 1.38% ✓
- Cap rate
- 11.34%
- Cash-on-cash
- 18.03%
- DSCR
- 1.80
- GRM
- 6.0
CMA / ARV
- ARV (on-the-fly)
- $142,800
- Comps found
- 12
Show comp detail 12 sales within ~0.75 mi
| Address | Dist | Beds/Ba | Sqft | Sold | Price | $/sf | Match |
|---|---|---|---|---|---|---|---|
| 12 Willard St | 0.05mi | 4/2.0 (+1) | 1,440 (+1%) | 2mo | $140,000 | $97 | 88 |
| 12 Arch St | 0.10mi | 4/2.0 (+1) | 1,430 (+0%) | 6mo | $25,000 | $17 | 83 |
| 28 Delevan St | 0.08mi | 3/1.0 | 1,449 (+2%) | 10mo | $143,100 | $99 | 83 |
| 132 Chapman Ave | 0.18mi | 3/1.5 | 1,488 (+4%) | 10mo | $122,075 | $82 | 76 |
| 35 Parker St | 0.30mi | 3/1.0 | 1,445 (+1%) | 9mo | $60,000 | $42 | 75 |
| 6 Willard St | 0.05mi | 3/1.0 | 1,248 (-13%) | 3mo | $99,900 | $80 | 72 |
| 83 Chapman Ave | 0.20mi | 3/2.0 | 1,245 (-13%) | 7mo | $182,000 | $146 | 61 |
| 9 Wallace Ave | 0.60mi | 3/1.0 | 1,348 (-6%) | 4mo | $144,000 | $107 | 57 |
| 24 Fitch Ave | 0.61mi | 4/1.0 (+1) | 1,476 (+3%) | 2mo | $202,800 | $137 | 57 |
| 24 Wood St | 0.12mi | 4/1.0 (+1) | 1,636 (+15%) | 8mo | $164,300 | $100 | 56 |
| 163 Garrow Street Ext Ext | 0.68mi | 3/1.5 | 1,304 (-9%) | 3mo | $289,000 | $222 | 52 |
| 7 Orchard Ave | 0.54mi | 4/2.0 (+1) | 1,312 (-8%) | 5mo | $170,000 | $130 | 50 |
Match score weights: distance 35% · size 25% · config 20% · recency 20%. Top-matched comps best support the ARV.
Projected returns pro-forma
-3.0% appreciation · 3.0% rent growth · sell at horizon
- IRR
- 9.6%
- Equity multiple
- 1.38×
- Total profit
- $14,052
- Equity at exit
- $19,756
- IRR
- 18.8%
- Equity multiple
- 2.56×
- Total profit
- $58,009
- Equity at exit
- $11,456
Cash invested: $37,100 (down + closing). Projections, not guarantees.
Landlord ↔ Tenant lean methodology
- Overall (STATE)
- 15 Strongly Tenant-Friendly
- State New York
- 15 Strongly Tenant-Friendly · D+10
- County
- — inherits STATE
- City
- — inherits STATE
ZIP-level market 13021
- Home prices YoY
- -22.4%
- Active inventory
- 221
- Price-to-rent
- 6.0×
Monthly cashflow live
- Estimated rent
- $1,831 medium interval (Pro) →
- Mortgage (P&I)
- −$695
- Tax from tax record
- −$139 /mo · $1,665/yr
- Insurance
- −$55
- HOA
- −$0
- Vacancy / Maint / Mgmt
- −$384
- Net cashflow
- $558
Break-even live
UW: 25.0% down · 7.5% · 30yr · 1.5% tax · 5.0% vac · 8.0% maint · 8.0% mgmt
Financing live
Cash to close
- Down payment
- $33,125
- Closing costs
- $3,975
- Reserves months
- —
- Total cash needed
- —
Loan-product check · same deal, 3 products live
Conventional
25% down · 7.5% · 30yr
- Down + closing
- —
- Monthly P&I
- —
- Monthly cashflow
- —
- DSCR
- —
- Eligible?
- —
Personal DTI + credit; lowest rate.
DSCR
20% down · 8.5% · 30yr
- Down + closing
- —
- Monthly P&I
- —
- Monthly cashflow
- —
- DSCR
- —
- Eligible?
- —
No personal income docs; deal must DSCR.
Hard money
10% down · 12.0% · 12mo
- Down + closing
- —
- Monthly P&I
- —
- Monthly cashflow
- —
- DSCR
- —
- Eligible?
- —
Short-term bridge; refi at stabilization.
Listing history 5 events
-
2026-04-29status Pending
-
2026-04-22price $132,500
-
2026-02-28price $135,000
-
2025-12-31$139,500 Active
-
1991-11-27soldstatus $37,000
ⓘ Source: listings_history table (triggers on properties + properties_extension) + one-shot
backfill from property_details.listing_events for pre-trigger history.
Tax reassessment forecast NY · Partial reset (capped growth)
- Current annual tax
- $1,665 · $139/mo
- Projected year-2 tax
- $1,952 · $163/mo
- Expected delta
- +$287/yr (+$24/mo · 17.2%)
ⓘ Screening estimate from a state-policy table — verify with the county assessor before closing.
Climate risk First Street
- Flood 1/10 Low FEMA zone X (unshaded) · 0% chance over 30 yrs
- Wildfire 1/10 Low
- Heat 2/10 Low 7 d/yr ≥96°F today · 15 d/yr by 30 yrs out
- Wind 1/10 Low 100% chance of damaging wind over 30 yrs
- Air quality 2/10 Low 0 unhealthy d/yr today · 1 by 30 yrs out
Nearby sold comps map
Loading sold comps map…
Walkable amenities ~0.75 mi
Loading nearby amenities…
Taxation est. · year 1
- Rental income
- $21,971
- − Mortgage interest
- −$7,422
- − Property taxes
- −$1,665
- − Insurance
- −$662
- − Repairs & maintenance
- −$1,758
- − Management
- −$1,758
- − Depreciation
- −$3,855
- Taxable income
- $4,851
- Est. tax owed @ 24.0%
- −$1,164
- After-tax cash flow
- $5,527/yr
For passive investors: Depreciation is non-cash, so a rental often shows a tax loss while cash-flowing — sheltering income. Rental losses are passive: they offset passive income freely, and up to $25,000/yr can offset ordinary (W-2) income if you actively participate and your MAGI is under $100k (phasing out to $0 by $150k); unused losses carry forward. On sale, claimed depreciation is recaptured at up to 25%, and gains may owe capital-gains tax (a 1031 exchange can defer both). Figures are a year-1 estimate at your 24.0% rate — not tax advice; consult a CPA.
Schools (NCES district)
- District
- Auburn City School District
- NCES district ID
- 3603480
- Math proficiency
- 31% ▼ -17.00%
- Reading proficiency
- 39% ▲ 2.00%
- Median HH income
- $43,567
- Composite
- 29.71/100
- National rank
- #6452
- State rank
- #558 of 590 in NY
Livability — Auburn
- Score
- 74/100
- State rank
- #298
- US rank
- #4814
Category grades
Schools grade is shown separately in the Schools card above.
Census & demographics
- Census place
- Auburn, NY
- County
- Cayuga County · 37,247 people
- City population
- 37,247
- Metro
- Auburn, NY
- Population (ZIP)
- 37,247
- Household income
- $60,712
- Rent vs Own
- Severe rent burden
- 1449.0
Population outlook (Cayuga County) Hauer SSP2
- Today (2025)
- 74,820 people
- By 2030
- 72,402 · -3.2%
- By 2040
- 66,917 · -10.6%
- By 2050
- 61,007 · -18.5%
- By 2075
- 48,047 · -35.8%
- By 2100
- 34,512 · -53.9%
Race, ethnicity, and origin ACS 2023
- Neighborhood character
- Predominantly White (87%)
- Race & ethnicity
- White 87% Two or more races 7% Black 3% Hispanic / Latino 3%
- Common ancestry
- Romanian 8% Subsaharan African 3% Lithuanian 2%
- Foreign-born
- 2% · Canada
- Languages at home
- 95% English-only · Spanish 2% Other Indo-European 1% German/W. Germanic 1%
Political lean MEDSL · Cayuga
- 2024 margin
- R (+13.0) · D 43.5% · R 56.5%
- 2008→2024 swing
- -21.5pp toward R · 2008: 8.5pp · 2024: -13.0pp
- All cycles
- 2024: R+13.0 2020: R+9.2 2016: R+13.2 2012: D+10.8 2008: D+8.5
Not yet ingested
- Civics
- —
Market trends
- HPI YoY
- ▼ -97.53%
- Current HPI
- 338.5537
- Rent YoY
- —
- Metro
- Auburn, NY
- State GDP YoY
- ▲ 2.60%
- F500 in state
- 92
Industry mix (Fortune 500 HQ in NY)
| Industry | F500 HQs | Revenue |
|---|---|---|
| Financial Services | 10 | $950B |
|
||
| Consumer Goods | 9 | $162B |
|
||
| Insurance | 4 | $225B |
|
||
| Telecommunications | 2 | $144B |
|
||
| Pharmaceuticals | 2 | $112B |
|
||
| Media / Entertainment | 2 | $69B |
|
||
Price history
+258.1% since first listed5 events — show timeline
- 2026-04-29 Pending — CNYIS
- 2026-04-22 Price Changed $132,500 CNYIS
- 2026-02-28 Price Changed $135,000 CNYIS
- 2025-12-31 Listed $139,500 CNYIS
- 1991-11-27 Sold (Public Records) $37,000 Public Records
Property tax history
-0.5%/yrLatest (2025): $1,665 · -13.2% YoY. Source: county tax records.
Cash-flow waterfall
monthlySold comps — $/sqft
last 12 mo · ≤1 miLoading sold comps…