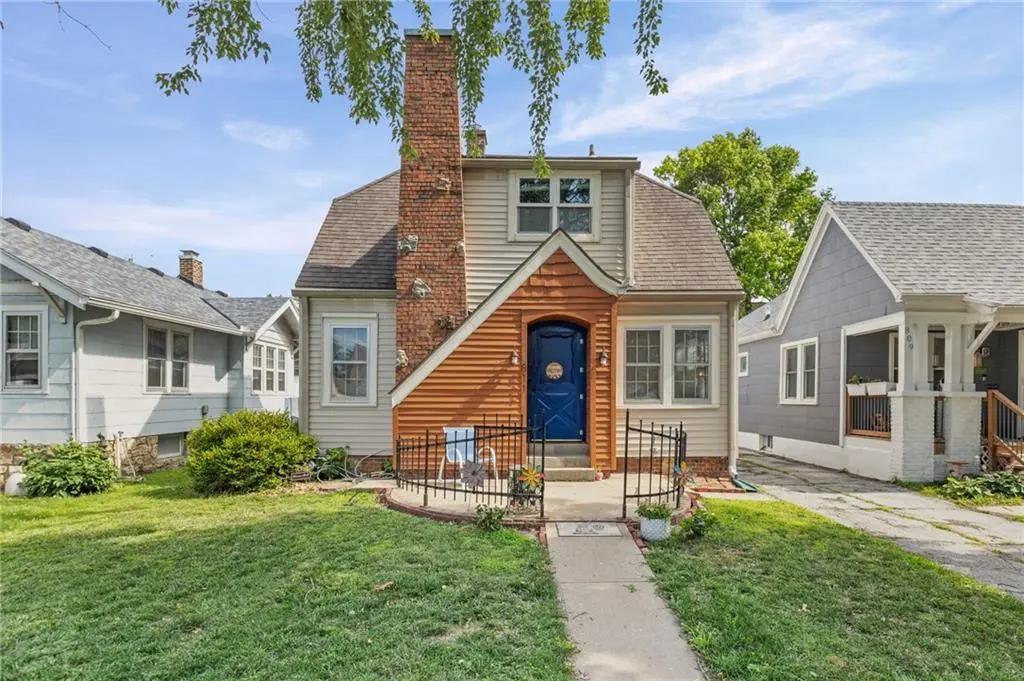
811 E 23rd Ave · North Kansas City, MO
Flood risk 1/10 · Minimal
- FEMA flood zone
- X
- Chance of flooding over 30 yrs
- 0.0%
- Est. flood insurance / yr
- $473 – $860
Fire risk 1/10 · Minimal
- Est. fire insurance / yr
- $1,054 – $1,958
Heat risk 4/10 · Minor
- Hot days now (above 107°F)
- 7 days/yr
- Hot days in 30 yrs
- 17 days/yr
Wind risk 2/10 · Minimal
- Chance of severe wind over 30 yrs
- —
Air-quality risk 3/10 · Minor
- Unhealthy air days now
- 2 days/yr
- Unhealthy air days in 30 yrs
- 3 days/yr
Risk factors via First Street. Map © Google.
Why this score? — see what drove the F grade
The composite is a weighted blend of 9 inputs, each scored 0–100. Each bar is that input's sub-score; the figure is the points it added to the 100-point composite (weight × sub-score).
- Cash flow +7.8/30.0
- Schools +3.8/10.0
- Rent growth +3.7/5.0
- Livability +3.7/5.0
- ARV discount +3.5/15.0
- Condition / age +2.5/5.0
- DSCR +1.9/10.0
- 1% rule +1.7/10.0
- Appreciation +0.0/10.0
$260,000
🖨 Deal sheet (PDF) 📄 Offer letter ✓ Due diligence
Listing remarks MLS
SO CUTE! Move-in ready in popular NKC and houses like this don't come along often - main floor laundry and walk-in closets in both adorable bedrooms! Not a stitch of carpet to replace. Freshly painted interior - and check out that bright, welcoming front door! Spacious living room with two seating areas and an actual dining room too! Airy bright kitchen with lots of cabinet space. Recently re-stained back deck. Carport to keep the snow off! Easy-care vinyl siding and ample storage space in the basement. Brand new HVAC in 2020! Walking distance to everything that NKC has to offer, including breweries, the best movie theater in town (Screenland Armour), Macken Park, Dagg Park, the library, etc.
Key facts
- Covered deck
- Double carport
- 3,920 sq ft lot
Tags
Property features AI
Finance
- HOA & community: No association fees
Exterior
- Parking: Detached carport; Detached 2-car garage; Shared driveway
- Utilities: Public water; Public sewer; Fiber available
- Home design: Single-family residence; 1.5–2 story floor plan; Residential property
- Construction: Vinyl and wood siding; Composition roof
- Exterior features: Deck; Patio; Partial wood fencing; Shed(s); City lot; Publicly maintained road; Not in a flood plain
Interior
- Kitchen: Dishwasher; Disposal; Refrigerator; Electric range; Laminate countertops; Exhaust fan
- Bedrooms: 2 bedrooms (one on the main level, one on the upper level with walk-in closet and built-ins)
- Flooring: Wood flooring; Tile flooring
- Bathrooms: 1 full bathroom; 1 half bathroom; Upper-level bathroom with shower over tub
- Heating & cooling: Natural gas heating; Electric cooling
- Interior features: Ceiling fans; Painted kitchen cabinets; Walk-in closets; Thermal and wood windows; Built-in features; Formal dining area
- Laundry & utility: Main-level laundry room; Washer; Dryer
Neighborhood map
What this means for you Summary
Snapshot
- This is a 2-bed/1.0-bath single-family listed at $260k.
Deal economics
- At list price, monthly cash flow is $-284 ($-3k/yr) — negative.
- To cash-flow at today's rent, offer at most $210k (19.3% below list).
- To meet the 1% rule (rent ≥ 1% of price), the offer needs to be $175k (32.6% below list).
- Recommended offer: $175k (32.6% below list) — sets the bar for 1% rule.
Location & tenants
- Location reads 74/100 on livability (#67 in MO, #4,540 nationally) — a middle-class / working-renter tenant base. Strengths: commute A+, cost of living A+, health & safety A+; Watch: employment D, crime F.
- North Kansas City 74 (urban): math 38% / reading 49% proficiency, ranked #98 of 324 in MO (top 30%) — families likely to look elsewhere, expect single-tenant / working-renter base with shorter leases.
- Zoned schools: Briarcliff Elementary (math 42% / reading 52%, grade D-, #347 of 1,115 statewide, top 35%, 310 students, 46% FRL); Eastgate 6Th Grade Center (math 26% / reading 35%, grade F, #283 of 391 statewide, top 74%, 607 students, 65% FRL); North Kansas City High (math 14% / reading 37%, grade F, #433 of 521 statewide, top 83%, 1,640 students, 55% FRL) — zoned schools average 55% FRL vs 37% district-wide (18 pts higher); higher-poverty schools than district average — tighter screening recommended.
- Market conditions: Rents rising fast (+4.7%/yr); 87 active listings in the ZIP; 17 comparable units currently listed for rent nearby; rentals leasing fast (median 10d on market — plan ~1-2 weeks tenant-placement turnaround); 341 units permitted in Clay County in 2024 (40 in 5+ unit buildings).
- This rent runs 33% of the median local income ($64k/yr) — at the standard rent-burdened threshold; future hikes will face affordability resistance.
Forward outlook
- Local home prices are declining (-3.0%/yr); year-one equity from $2k of loan paydown is wiped out by about $8k of value loss. Plan a longer hold.
- Clay County population projected at +24% by 2050 — long-run rental-demand tailwind backs the buy-and-hold thesis.
Negotiation context
- Only 2 days on market — expect competitive offers; lowballing is unlikely to land.
- 5 sale attempts since 21y ago with the ask held roughly flat each time — persistent listings suggest the price (not the market) is what's stuck; bring a comps-based counter.
Risks & watch-outs
- Watch-outs: built in 1928 — expect roof / HVAC / electrical / plumbing capex.
Questions for the listing agent
- What do current leases actually rent for vs. the listed asking? Can we see a recent rent roll and the last 12 months of T-12 income?
- Built in 1928 — when were the roof, HVAC, electrical panel, plumbing, and water heater last replaced?
- Is there a deadline driving the sale (1031 exchange, divorce, estate, relocation)? That informs how much negotiation room exists.
- Schools are F-rated, which usually means shorter tenancies and higher turnover. Who's the typical renter profile here, and what's been the actual vacancy rate?
- Crime grade is F in this area — have there been break-ins, vandalism, or insurance claims at this property in the last 3 years? What carrier currently insures it and at what premium?
- The area grade is low — what's the realistic commute time and amenity access for the typical tenant pool here? Any planned neighborhood developments (good or bad) we should know about?
- What's the average days-on-market for RENTAL listings here right now (not sales)? A rising rental-DOM trend means longer vacancies and softer asking-rent achievability than the comps imply.
- What's the recent tenant-quality profile in this submarket — average credit score on applications, eviction rate, late-payment / NSF rate, and stable-employment percentage? A property-management company in the area should have these aggregated.
- How much new for-sale + rental construction is in the pipeline within 1–3 miles? Heavy new supply typically softens prices + rents 12–24 months out; constrained supply supports both.
Investment metrics
- 1% rule
- 0.67% ✗
- Cap rate
- 4.98%
- Cash-on-cash
- -4.68%
- DSCR
- 0.79
- GRM
- 12.4
CMA / ARV
- ARV (on-the-fly)
- $238,590
- Comps found
- 12
Show comp detail 12 sales within ~0.75 mi
| Address | Dist | Beds/Ba | Sqft | Sold | Price | $/sf | Match |
|---|---|---|---|---|---|---|---|
| 1026 E 22nd Ave | 0.18mi | 2/1.0 | 962 (-3%) | 1mo | $249,000 | $259 | 86 |
| 1221 E 25th Ave | 0.29mi | 2/1.0 | 953 (-4%) | 6mo | $194,900 | $205 | 76 |
| 831 E 25th Ave | 0.11mi | 2/1.5 | 910 (-8%) | 11mo | $275,000 | $302 | 70 |
| 1212 E 22nd Ave | 0.26mi | 3/2.0 (+1) | 990 (0%) | 11mo | $160,900 | $163 | 70 |
| 1440 E 24th Ave | 0.45mi | 3/1.0 (+1) | 982 (-1%) | 5mo | $265,000 | $270 | 68 |
| 1210 E 23rd Ave | 0.25mi | 2/1.0 | 856 (-14%) | 1mo | $199,999 | $234 | 65 |
| 1416 E 22nd Ave | 0.39mi | 3/1.0 (+1) | 1,002 (+1%) | 13mo | $220,000 | $220 | 64 |
| 1219 E 21st Ave | 0.29mi | 2/1.0 | 888 (-10%) | 7mo | $250,000 | $282 | 64 |
| 1411 E 24th Ave | 0.38mi | 2/2.0 | 966 (-2%) | 13mo | $195,000 | $202 | 63 |
| 1240 E 25th Ave | 0.33mi | 3/1.5 (+1) | 1,036 (+5%) | 10mo | $250,000 | $241 | 61 |
| 1406 E 24th Ave | 0.38mi | 3/1.0 (+1) | 1,092 (+10%) | 1mo | $249,900 | $229 | 60 |
| 2110 Fayette St | 0.22mi | 3/2.0 (+1) | 1,096 (+11%) | 10mo | $359,900 | $328 | 55 |
Match score weights: distance 35% · size 25% · config 20% · recency 20%. Top-matched comps best support the ARV.
Projected returns pro-forma
-3.0% appreciation · 4.74% rent growth · sell at horizon
- IRR
- -22.5%
- Equity multiple
- 0.21×
- Total profit
- $-57,157
- Equity at exit
- $38,767
- IRR
- -13.2%
- Equity multiple
- 0.18×
- Total profit
- $-60,015
- Equity at exit
- $22,480
Cash invested: $72,800 (down + closing). Projections, not guarantees.
Landlord ↔ Tenant lean methodology
- Overall (STATE)
- 81 Strongly Landlord-Friendly
- State Missouri
- 81 Strongly Landlord-Friendly · R+10
- County
- — inherits STATE
- City
- — inherits STATE
ZIP-level market 64116
- Rents YoY
- 4.7%
- Active inventory
- 87
- Price-to-rent
- 12.4×
Monthly cashflow live
- Estimated rent
- $1,752 high interval (Pro) →
- Mortgage (P&I)
- −$1,363
- Tax from tax record
- −$196 /mo · $2,357/yr
- Insurance
- −$108
- HOA
- −$0
- Vacancy / Maint / Mgmt
- −$368
- Net cashflow
- $-284
Break-even live
Sensitivity live
| Price | -10% $-137 | -5% $-210 | +0% $-284 | +5% $-358 | +10% $-431 |
|---|---|---|---|---|---|
| Rent | -10% $-422 | -5% $-353 | +0% $-284 | +5% $-215 | +10% $-146 |
| Rate | -1.0pp $-153 | -0.5pp $-218 | base $-284 | +0.5pp $-351 | +1.0pp $-420 |
UW: 25.0% down · 7.5% · 30yr · 1.5% tax · 5.0% vac · 8.0% maint · 8.0% mgmt
Financing live
Cash to close
- Down payment
- $65,000
- Closing costs
- $7,800
- Reserves months
- —
- Total cash needed
- —
Loan-product check · same deal, 3 products live
Conventional
25% down · 7.5% · 30yr
- Down + closing
- —
- Monthly P&I
- —
- Monthly cashflow
- —
- DSCR
- —
- Eligible?
- —
Personal DTI + credit; lowest rate.
DSCR
20% down · 8.5% · 30yr
- Down + closing
- —
- Monthly P&I
- —
- Monthly cashflow
- —
- DSCR
- —
- Eligible?
- —
No personal income docs; deal must DSCR.
Hard money
10% down · 12.0% · 12mo
- Down + closing
- —
- Monthly P&I
- —
- Monthly cashflow
- —
- DSCR
- —
- Eligible?
- —
Short-term bridge; refi at stabilization.
Rent comps 17 comps
| Address | Beds | Baths | Sqft | Rent | $/sqft | DOM | Units | Dist |
|---|---|---|---|---|---|---|---|---|
| 1023 E 22nd Ave Kansas City, MO | 2.0 | 1.5 | 900 | $3,000 | $3.33 | 25d | 1 | 0.15mi |
| 524 E 26th Ave North Kansas City, MO | 1.0 | 1.0 | 630 | $950 | $1.51 | 45d | 1 | 0.22mi |
| 715 Armour Rd Kansas City, MO | 2.0 | 1.0–2.0 | 1001 | $1,742 | $1.74 | 0d | 9 | 0.22mi |
| 2116 Fayette St Kansas City, MO | 2.0 | 1.0 | 902 | $1,650 | $1.83 | 25d | 1 | 0.22mi |
| 2700 Howell Ter Kansas City, MO | 1.0 | 1.0 | 600 | $1,175 | $1.96 | 25d | 1 | 0.29mi |
| 314 E 26th Ave North Kansas City, MO | 2.0 | 1.0 | 800 | $1,325 | $1.66 | 45d | 1 | 0.34mi |
| 300 E 26th Ave Unit 300E26 North Kansas City, MO | 2.0 | 1.0 | 800 | $1,325 | $1.66 | 9d | 1 | 0.37mi |
| 317 E 28th Ave Kansas City, MO | 1.0 | 1.0 | 648 | $1,100 | $1.70 | 5d | 1 | 0.39mi |
| 200 E 23rd Ave Kansas City, MO | 1.0–2.0 | 1.0–2.0 | 929 | $2,058 | $2.22 | 0d | 14 | 0.40mi |
| 2600 Cityview Dr Kansas City, MO | 2.0 | 1.0–2.0 | 955 | $1,826 | $1.91 | 0d | 22 | 0.45mi |
| 215 E 18th Ave North Kansas City, MO | 1.0 | 1.0 | 613 | $1,922 | $3.13 | 0d | 14 | 0.49mi |
| 1770 Diamond Pkwy Kansas City, MO | 2.0 | 1.0–2.0 | 921 | $1,854 | $2.01 | 0d | 28 | 0.50mi |
| 1619 Orleans Cir North Kansas City, MO | 3.0 | 1.0–2.5 | 1119 | $1,272 | $1.14 | 45d | 1 | 0.52mi |
| 1801 Diamond Pkwy North Kansas City, MO | 3.0 | 1.0–2.0 | 926 | $1,945 | $2.10 | 0d | 29 | 0.54mi |
| 3242 N Virginia Ave Kansas City, MO | 2.0 | 2.0 | 912 | $1,695 | $1.86 | 9d | 1 | 0.68mi |
| 3350 N Holmes St Kansas City, MO | 2.0 | 1.0–2.5 | 975 | $3,329 | $3.41 | 0d | 91 | 0.76mi |
| 3800 N Cherry Ln Kansas City, MO | 2.0 | 1.0 | 825 | $1,138 | $1.38 | 16d | 4 | 1.32mi |
Listing history 2 events
-
2026-06-21remarks 699-char remark
-
2026-06-21$260,000 Active 2 DOM
ⓘ Source: listings_history table (triggers on properties + properties_extension) + one-shot
backfill from property_details.listing_events for pre-trigger history.
Tax reassessment forecast MO · Resets to sale price
- Current annual tax
- $2,357 · $196/mo
- Projected year-2 tax
- $2,522 · $210/mo
- Expected delta
- +$165/yr (+$14/mo · 7.0%)
ⓘ Screening estimate from a state-policy table — verify with the county assessor before closing.
Climate risk First Street
- Flood 1/10 Low FEMA zone X · 0% chance over 30 yrs
- Wildfire 1/10 Low
- Heat 4/10 Moderate 7 d/yr ≥107°F today · 17 d/yr by 30 yrs out
- Wind 2/10 Low
- Air quality 3/10 Moderate 2 unhealthy d/yr today · 3 by 30 yrs out
Nearby sold comps map
Loading sold comps map…
Walkable amenities ~0.75 mi
Loading nearby amenities…
Taxation est. · year 1
- Rental income
- $21,025
- − Mortgage interest
- −$14,564
- − Property taxes
- −$2,357
- − Insurance
- −$1,300
- − Repairs & maintenance
- −$1,682
- − Management
- −$1,682
- − Depreciation
- −$7,564
- Taxable loss
- −$8,124
- Est. tax savings @ 24.0%
- +$1,950
- After-tax cash flow
- $-1,459/yr
For passive investors: Depreciation is non-cash, so a rental often shows a tax loss while cash-flowing — sheltering income. Rental losses are passive: they offset passive income freely, and up to $25,000/yr can offset ordinary (W-2) income if you actively participate and your MAGI is under $100k (phasing out to $0 by $150k); unused losses carry forward. On sale, claimed depreciation is recaptured at up to 25%, and gains may owe capital-gains tax (a 1031 exchange can defer both). Figures are a year-1 estimate at your 24.0% rate — not tax advice; consult a CPA.
Schools (NCES district)
- District
- North Kansas City 74
- NCES district ID
- 2922800
- Math proficiency
- 38% ▼ -11.00%
- Reading proficiency
- 49% ▼ -3.00%
- Median HH income
- $55,444
- Composite
- 37.88/100
- National rank
- #4321
- State rank
- #98 of 324 in MO
Livability — North Kansas City
- Score
- 74/100
- State rank
- #67
- US rank
- #4540
Category grades
Schools grade is shown separately in the Schools card above.
Census & demographics
- Census place
- North Kansas City, MO
- County
- Clay County · 220,651 people
- City population
- 17,535
- Metro
- Kansas City, MO-KS
- Population (ZIP)
- 18,046
- Household income
- $64,123
- Rent vs Own
- Severe rent burden
- 844.0
Population outlook (Clay County) Hauer SSP2
- Today (2025)
- 266,022 people
- By 2030
- 280,057 · +5.3%
- By 2040
- 306,153 · +15.1%
- By 2050
- 328,630 · +23.5%
- By 2075
- 375,182 · +41.0%
- By 2100
- 392,861 · +47.7%
Race, ethnicity, and origin ACS 2023
- Neighborhood character
- Diverse neighborhood (Simpson 0.57)
- Race & ethnicity
- White 63% Two or more races 15% Black 12% Hispanic / Latino 10% Asian 3%
- Hispanic origin (detail)
- Mexican 5% Puerto Rican 2%
- Common ancestry
- Italian 3% Serbian 2% Lithuanian 2%
- Foreign-born
- 8% · Canada, Vietnam, Jamaica
- Languages at home
- 91% English-only · Arabic 2% Spanish 2% Vietnamese 2%
Political lean MEDSL · Clay
- 2024 margin
- Lean R (+5.6) · D 46.4% · R 52.0% · Other 1.6%
- 2008→2024 swing
- -4.9pp toward R · 2008: -0.7pp · 2024: -5.6pp
- All cycles
- 2024: R+5.6 2020: R+4.1 2016: R+11.1 2012: R+8.4 2008: R+0.7
Not yet ingested
- Civics
- —
Market trends
- HPI YoY
- ▼ -180.14%
- Current HPI
- 256.6222
- Rent YoY
- ▲ 4.74%
- Metro
- Kansas City, MO-KS
- State GDP YoY
- ▲ 1.84%
- F500 in state
- 20
Industry mix (Fortune 500 HQ in MO)
| Industry | F500 HQs | Revenue |
|---|---|---|
| Healthcare | 1 | $163B |
|
||
| Insurance | 1 | $21B |
|
||
| Industrial Technology | 1 | $17B |
|
||
| Retail | 1 | $16B |
|
||
| Industrial Distribution | 1 | $10B |
|
||
| Utilities | 1 | $9B |
|
||
Price history
+126.1% since first listed17 events — show timeline
- 2026-06-19 Listed $260,000 Heartland MLS as Distributed by MLS Grid
- 2021-12-01 Sold (Public Records) — Public Records
- 2021-11-30 Sold (MLS) — Heartland MLS as Distributed by MLS Grid
- 2021-11-10 Pending — Heartland MLS as Distributed by MLS Grid
- 2021-11-02 Contingent — Heartland MLS as Distributed by MLS Grid
- 2021-10-29 Listed $190,000 Heartland MLS as Distributed by MLS Grid
- 2018-12-14 Sold (Public Records) — Public Records
- 2018-12-13 Sold (MLS) — Heartland MLS as Distributed by MLS Grid
- 2018-11-21 Pending — Heartland MLS as Distributed by MLS Grid
- 2018-11-12 Contingent — Heartland MLS as Distributed by MLS Grid
- 2018-11-11 Listed $145,000 Heartland MLS as Distributed by MLS Grid
- 2015-07-06 Sold (Public Records) — Public Records
- 2015-07-01 Sold (MLS) — Heartland MLS as Distributed by MLS Grid
- 2015-05-26 Listed $108,000 Heartland MLS as Distributed by MLS Grid
- 2005-07-01 Sold (Public Records) — Public Records
- 2005-06-29 Sold (MLS) — Heartland MLS as Distributed by MLS Grid
- 2005-05-11 Listed $115,000 Heartland MLS as Distributed by MLS Grid
Property tax history
+5.1%/yrLatest (2025): $2,357 · +18.0% YoY. Source: county tax records.
Cash-flow waterfall
monthlySold comps — $/sqft
last 12 mo · ≤1 miLoading sold comps…