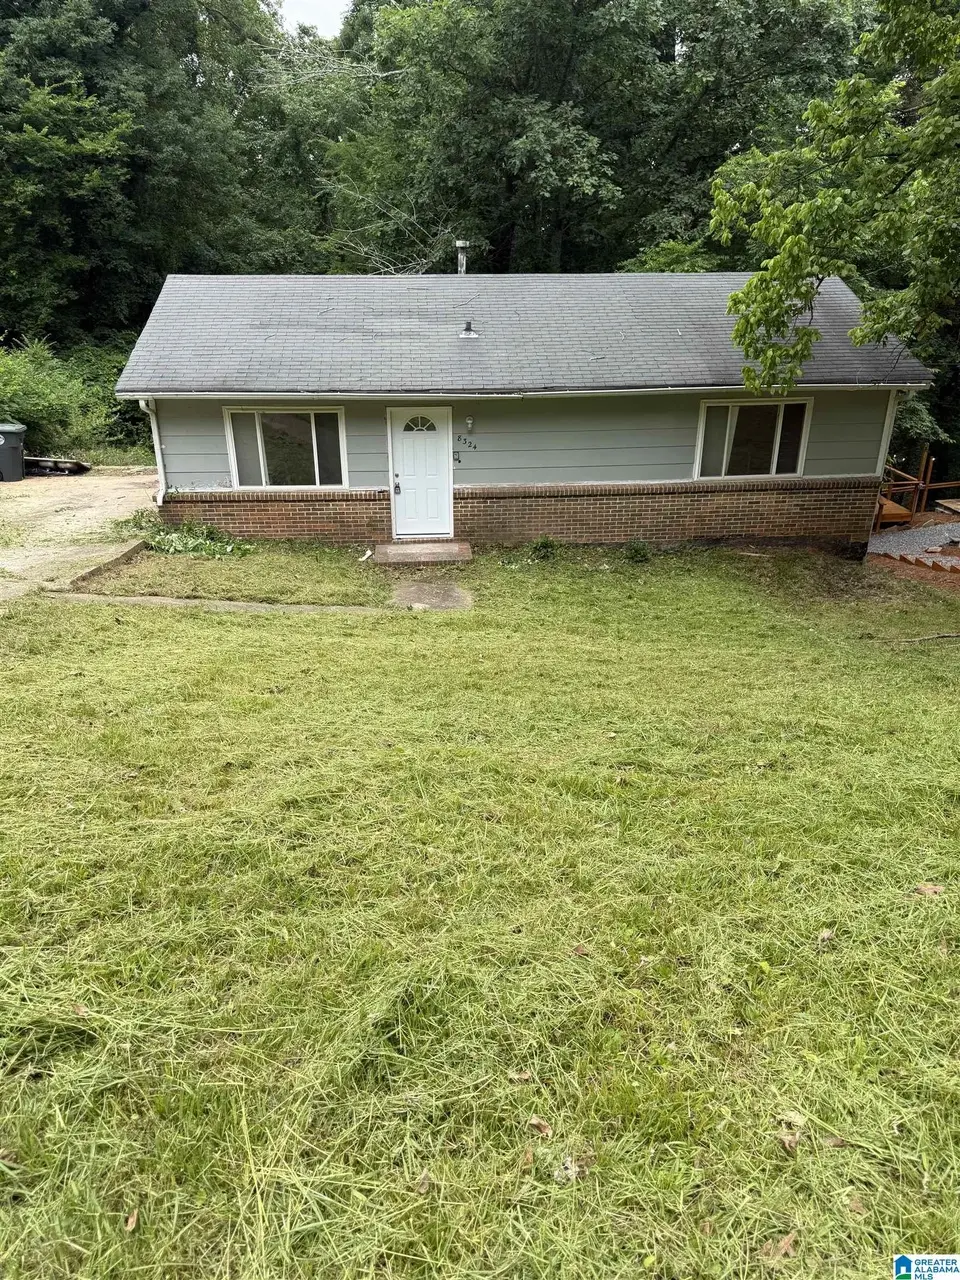
8324 12th Ave S · Birmingham, AL
Flood risk 1/10 · Minimal
- FEMA flood zone
- X (unshaded)
- Chance of flooding over 30 yrs
- 0.0%
- Est. flood insurance / yr
- $507 – $1,088
Fire risk 3/10 · Minor
- Est. fire insurance / yr
- $916 – $1,700
Heat risk 5/10 · Moderate
- Hot days now (above 106°F)
- 5 days/yr
- Hot days in 30 yrs
- 14 days/yr
Wind risk 6/10 · Moderate
- Chance of severe wind over 30 yrs
- 27.0%
Air-quality risk 5/10 · Moderate
- Unhealthy air days now
- 7 days/yr
- Unhealthy air days in 30 yrs
- 9 days/yr
Risk factors via First Street. Map © Google.
Why this score? — see what drove the B- grade
The composite is a weighted blend of 9 inputs, each scored 0–100. Each bar is that input's sub-score; the figure is the points it added to the 100-point composite (weight × sub-score).
- Cash flow +29.7/30.0
- DSCR +10.0/10.0
- 1% rule +8.3/10.0
- ARV discount +7.5/15.0
- Livability +3.4/5.0
- Rent growth +3.0/5.0
- Condition / age +2.5/5.0
- Schools +0.9/10.0
- Appreciation +0.0/10.0
$85,000
🖨 Deal sheet 📄 Offer letter ✓ Due diligence
Listing remarks
Located on one of East Lake’s great streets, this property offers an incredible opportunity for an investor or homeowner looking to finish out a remodel and build instant equity. Much of the heavy lifting has already been started, including a renovated bathroom, fresh interior paint, and updated cabinets. With just the final touches remaining, the next owner can transform this home into an excellent primary residence or strong rental investment. Priced to sell and full of potential, this is your chance to create value in a growing area with character and convenience.
Key facts
- Renovated bathroom
- Updated cabinets
- Fresh interior paint
Tags
Property features AI
Finance
- Other: Located in the East Lake subdivision
Exterior
- Parking: Driveway parking
- Utilities: Public water; Sewer connected; Underground utilities; Internet service available
- Home design: Existing construction; Single-story living areas (rooms listed on level 1)
- Construction: Vinyl siding; Basement foundation
- Exterior features: No pool, patio, decks, or garden/patio; Not waterfront; Lot of approximately 0.32 acre
Interior
- Kitchen: Kitchen on main level
- Bedrooms: Two bedrooms on main level
- Flooring: Subflooring
- Bathrooms: One full bathroom with tub/shower combo
- Heating & cooling: Central heating; Central cooling
- Interior features: Smooth ceilings; Subflooring; Full unfinished basement (concrete block)
- Laundry & utility: Main-level laundry with washer hookup and electric dryer hookup; laundry located in a closet; Attic present
Neighborhood map
What this means for you Summary
Snapshot
- This is a 3-bed/1.0-bath single-family listed at $85k.
Deal economics
- At list price, monthly cash flow is $309 ($4k/yr) — positive.
- The deal already cash-flows at list — no discount required.
- Meets the 1% rule at list price ($1k rent vs $85k).
- Recommended offer: $84k (1.5% below list) — sets the bar for market timing.
- Cap rate 10.7% vs local median 6.2% in Birmingham — top-decile yield for the area; either an underpriced asset or a hidden risk that comps aren't pricing in. Stress-test before assuming the spread holds.
Location & tenants
- Location reads 67/100 on livability (#78 in AL) — a middle-class / working-renter tenant base. Strengths: commute A+, cost of living A+, housing A+; Watch: amenities C-, crime F, employment F.
- Birmingham City (urban): math 4% / reading 20% proficiency, ranked #116 of 129 in AL (top 90%) — low school quality limits family demand, transient renter base, plan for 1-2y turnover; 82% free/reduced lunch — lower-income household profile, screen leases tightly.
- Zoned schools: Barrett Elementary School (math 2% / reading 8%, grade F, #618 of 627 statewide, top 100%, 405 students, 88% FRL); Huffman High Schoolmagnet (math 2% / reading 2%, grade F, #291 of 305 statewide, top 100%, 1,147 students, 72% FRL) — zoned schools at 80% FRL track the district average.
- Market conditions: Rents rising (+1.8%/yr); 128 active listings in the ZIP; 37 comparable units currently listed for rent nearby; rentals lingering (median 44d on market — plan ~5-8 weeks vacancy on turnover, expect pricing pressure); 57% of comp listings sitting > 30 days — soft ceiling on asking rent; lower-income renter base — watch delinquency; 2,114 units permitted in Jefferson County in 2024 (556 in 5+ unit buildings).
- This rent runs 32% of the median local income ($43k/yr) — at the standard rent-burdened threshold; future hikes will face affordability resistance.
Forward outlook
- Local home prices are declining (-3.0%/yr); year-one equity from $588 of loan paydown is wiped out by about $3k of value loss. Plan a longer hold.
- Jefferson County population projected to shrink 4% by 2050 — rents likely to lag national; underwrite the cash flow, not the appreciation.
- At projected returns (-3.0% appreciation + 1.8% rent growth), your $24k cash investment doubles in ~9 years — after that, you're playing with house money.
Negotiation context
- It's been on market 17 days — a 2% lower offer ($84k) is reasonable based on typical stale-listing flexibility.
- Current owner paid $62k; 37% above their basis — modest negotiation headroom, anchor on the comps not their cost.
Risks & watch-outs
- Climate carrying-cost: major wind risk, 27% chance of damaging wind over 30y; extreme-heat days projected 5→14/yr by 2055 (HVAC capex compounding) — expect insurance premiums to compound above CPI over the hold.
Questions for the listing agent
- Is there a deadline driving the sale (1031 exchange, divorce, estate, relocation)? That informs how much negotiation room exists.
- Schools are F-rated, which usually means shorter tenancies and higher turnover. Who's the typical renter profile here, and what's been the actual vacancy rate?
- Crime grade is F in this area — have there been break-ins, vandalism, or insurance claims at this property in the last 3 years? What carrier currently insures it and at what premium?
- What's the average days-on-market for RENTAL listings here right now (not sales)? A rising rental-DOM trend means longer vacancies and softer asking-rent achievability than the comps imply.
- What's the recent tenant-quality profile in this submarket — average credit score on applications, eviction rate, late-payment / NSF rate, and stable-employment percentage? A property-management company in the area should have these aggregated.
- How much new for-sale + rental construction is in the pipeline within 1–3 miles? Heavy new supply typically softens prices + rents 12–24 months out; constrained supply supports both.
Investment metrics
- 1% rule
- 1.33% ✓
- Cap rate
- 10.66%
- Cash-on-cash
- 15.59%
- DSCR
- 1.69
- GRM
- 6.3
CMA / ARV
- ARV (on-the-fly)
- $51,072
- Comps found
- 12
Show comp detail 12 sales within ~0.75 mi
| Address | Dist | Beds/Ba | Sqft | Sold | Price | $/sf | Match |
|---|---|---|---|---|---|---|---|
| 7808 Vienna Ave | 0.59mi | 2/1.0 (-1) | 904 (-1%) | 5mo | $51,000 | $56 | 62 |
| 8609 10th Ave S | 0.29mi | 3/1.0 | 1,040 (+14%) | 6mo | $134,900 | $130 | 58 |
| 8200 Rugby Ave | 0.61mi | 2/1.0 (-1) | 927 (+2%) | 11mo | $52,000 | $56 | 55 |
| 732 S 84th St | 0.37mi | 3/1.0 | 1,036 (+14%) | 6mo | $65,000 | $63 | 55 |
| 429 86th Pl S | 0.74mi | 2/1.0 (-1) | 936 (+3%) | 2mo | $45,000 | $48 | 54 |
| 8214 6th Ave S | 0.66mi | 3/1.0 | 900 (-1%) | 17mo | $45,000 | $50 | 53 |
| 518 84th St S | 0.65mi | 2/1.0 (-1) | 993 (+9%) | 4mo | $45,500 | $46 | 47 |
| 783 80th St | 0.55mi | 2/1.0 (-1) | 1,006 (+10%) | 10mo | $52,000 | $52 | 44 |
| 448 S 87th St | 0.70mi | 3/1.0 | 960 (+5%) | 20mo | $115,000 | $120 | 42 |
| 8215 Rugby Ave | 0.62mi | 3/1.0 | 1,002 (+10%) | 18mo | $95,000 | $95 | 39 |
| 706 80th Pl S | 0.68mi | 2/1.0 (-1) | 828 (-9%) | 13mo | $130,000 | $157 | 37 |
| 624 83rd Pl S | 0.54mi | 2/1.0 (-1) | 780 (-14%) | 16mo | $42,000 | $54 | 32 |
Match score weights: distance 35% · size 25% · config 20% · recency 20%. Top-matched comps best support the ARV.
Projected returns pro-forma
-3.0% appreciation · 1.82% rent growth · sell at horizon
- IRR
- 5.1%
- Equity multiple
- 1.19×
- Total profit
- $4,604
- Equity at exit
- $12,674
- IRR
- 13.4%
- Equity multiple
- 2.01×
- Total profit
- $24,110
- Equity at exit
- $7,349
Cash invested: $23,800 (down + closing). Projections, not guarantees.
Landlord ↔ Tenant lean methodology
- Overall (STATE)
- 90 Strongly Landlord-Friendly
- State Alabama
- 90 Strongly Landlord-Friendly · R+15
- County
- — inherits STATE
- City
- — inherits STATE
ZIP-level market 35206
- Home prices YoY
- -32.0%
- Rents YoY
- 1.8%
- Active inventory
- 128
- Price-to-rent
- 6.3×
Monthly cashflow live
- Estimated rent
- $1,128 high interval (Pro) →
- Mortgage (P&I)
- −$446
- Tax from tax record
- −$101 /mo · $1,212/yr
- Insurance
- −$35
- HOA
- −$0
- Vacancy / Maint / Mgmt
- −$237
- Net cashflow
- $309
Break-even live
UW: 25.0% down · 7.5% · 30yr · 1.5% tax · 5.0% vac · 8.0% maint · 8.0% mgmt
Financing live
Cash to close
- Down payment
- $21,250
- Closing costs
- $2,550
- Reserves months
- —
- Total cash needed
- —
Loan-product check · same deal, 3 products live
Conventional
25% down · 7.5% · 30yr
- Down + closing
- —
- Monthly P&I
- —
- Monthly cashflow
- —
- DSCR
- —
- Eligible?
- —
Personal DTI + credit; lowest rate.
DSCR
20% down · 8.5% · 30yr
- Down + closing
- —
- Monthly P&I
- —
- Monthly cashflow
- —
- DSCR
- —
- Eligible?
- —
No personal income docs; deal must DSCR.
Hard money
10% down · 12.0% · 12mo
- Down + closing
- —
- Monthly P&I
- —
- Monthly cashflow
- —
- DSCR
- —
- Eligible?
- —
Short-term bridge; refi at stabilization.
Rent comps 37 comps
| Address | Beds | Baths | Sqft | Rent | $/sqft | DOM | Units | Dist |
|---|---|---|---|---|---|---|---|---|
| 8229 9th Ave S Birmingham, AL | 2.0 | 1.0 | 997 | $1,195 | $1.20 | 2d | 1 | 0.25mi |
| 730 82nd Pl S Birmingham, AL | 3.0 | 1.0 | 896 | $1,023 | $1.14 | 3d | 1 | 0.49mi |
| 636 83rd Pl S Birmingham, AL | 2.0 | 2.0 | 1062 | $1,175 | $1.11 | 43d | 1 | 0.52mi |
| 764 81st St S Unit B Birmingham, AL | 2.0 | 1.0 | 800 | $800 | $1.00 | 43d | 1 | 0.53mi |
| 8122 Rugby Ave Unit B Birmingham, AL | 2.0 | 1.0 | 900 | $795 | $0.88 | 43d | 1 | 0.55mi |
| 624 83rd Pl S Birmingham, AL | 2.0 | 1.0 | 780 | $975 | $1.25 | 43d | 1 | 0.56mi |
| 832 79th Pl S Birmingham, AL | 3.0 | 1.0 | 960 | $1,250 | $1.30 | 23d | 1 | 0.58mi |
| 7808 Vienna Ave Birmingham, AL | 2.0 | 1.0 | 904 | $850 | $0.94 | 43d | 1 | 0.61mi |
| 8211 Rugby Ave Birmingham, AL | 4.0 | 1.0 | 966 | $1,250 | $1.29 | 43d | 1 | 0.63mi |
| 8408 5th Ave S Birmingham, AL | 3.0 | 1.0 | 890 | $1,295 | $1.46 | 10d | 1 | 0.73mi |
| 8408 5th Ave S Birmingham, AL | 3.0 | 1.0 | 1100 | $1,528 | $1.39 | 43d | 1 | 0.73mi |
| 7825 Rugby Ct Birmingham, AL | 2.0 | 1.0 | 929 | $875 | $0.94 | 21d | 1 | 0.74mi |
| 7823 Rugby Ave Birmingham, AL | 3.0 | 1.0 | 1023 | $1,175 | $1.15 | 43d | 1 | 0.78mi |
| 425 87th St S Birmingham, AL | 2.0 | 1.0 | 890 | $1,077 | $1.21 | 43d | 1 | 0.78mi |
| 836 Vanderbilt St Birmingham, AL | 3.0 | 1.0 | 1072 | $850 | $0.79 | 23d | 1 | 0.80mi |
| 8035 4th Ave S Birmingham, AL | 3.0 | 2.0 | 1096 | $1,050 | $0.96 | 43d | 1 | 0.87mi |
| 756 Vanderbilt St Birmingham, AL | 3.0 | 2.0 | 1096 | $1,000 | $0.91 | 43d | 1 | 0.88mi |
| 8240 2nd Ave S Birmingham, AL | 2.0 | 1.0 | 990 | $875 | $0.88 | 23d | 1 | 0.96mi |
| 8129 2nd Ave S Unit B Birmingham, AL | 2.0 | 1.0 | 900 | $800 | $0.89 | 43d | 1 | 0.96mi |
| 7341 Rome Ave Birmingham, AL | 3.0 | 1.0 | 1000 | $1,300 | $1.30 | 43d | 1 | 1.00mi |
| 7341 Rome Ave Birmingham, AL | 3.0 | 1.0 | 1000 | $1,275 | $1.27 | 3d | 1 | 1.00mi |
| 7740 Rugby Ave Unit 2 Birmingham, AL | 2.0 | 1.0 | 800 | $1,000 | $1.25 | 43d | 1 | 1.01mi |
| 7740 Rugby Ave Unit b Birmingham, AL | 2.0 | 1.0 | 800 | $1,100 | $1.38 | 43d | 1 | 1.01mi |
| 7701 7th Ave S Birmingham, AL | 2.0 | 1.0 | 800 | $850 | $1.06 | 23d | 1 | 1.05mi |
| 7829 3rd Ave S Birmingham, AL | 3.0 | 1.5 | 1005 | $1,025 | $1.02 | 43d | 1 | 1.05mi |
| 7728 Rugby Ave Birmingham, AL | 2.0 | 1.0 | 700 | $850 | $1.21 | 43d | 1 | 1.06mi |
| 7404 Paris Ave Birmingham, AL | 3.0 | 1.5 | 802 | $1,200 | $1.50 | 43d | 1 | 1.08mi |
| 630 77th St S Birmingham, AL | 2.0 | 2.0 | 1100 | $983 | $0.89 | 2d | 1 | 1.08mi |
| 8021 1st Ave S Unit A Birmingham, AL | 3.0 | 1.0 | 980 | $950 | $0.97 | 23d | 1 | 1.09mi |
| 7801 3rd Ave S Unit B Birmingham, AL | 2.0 | 1.5 | 1100 | $1,000 | $0.91 | 43d | 1 | 1.09mi |
| 7313 Paris Ave Birmingham, AL | 3.0 | 2.0 | 1000 | $1,395 | $1.40 | 2d | 1 | 1.13mi |
| 7216 Paris Ave Birmingham, AL | 3.0 | 1.5 | 966 | $1,125 | $1.16 | 19d | 1 | 1.23mi |
| 7721 1st Ave S Birmingham, AL | 3.0 | 1.0 | 956 | $949 | $0.99 | 23d | 1 | 1.28mi |
| 8917 Roebuck Blvd Apt 11 Birmingham, AL | 2.0 | 1.0 | 880 | $725 | $0.82 | 15d | 1 | 1.31mi |
| 7213 Naples Ave Birmingham, AL | 3.0 | 1.5 | 937 | $1,100 | $1.17 | 11d | 1 | 1.31mi |
| 7213 Naples Ave Birmingham, AL | 3.0 | 1.5 | 925 | $1,100 | $1.19 | 43d | 1 | 1.31mi |
| 7728 1st Ave S Apt C Birmingham, AL | 2.0 | 1.0 | 950 | $950 | $1.00 | 43d | 1 | 1.31mi |
Listing history 12 events
-
2026-06-18days on market $85,000 Active 17 DOM
-
2026-06-17days on market $85,000 Active 16 DOM
-
2026-06-16days on market $85,000 Active 15 DOM
-
2026-06-15days on market $85,000 Active 14 DOM
-
2026-06-13days on market $85,000 Active 12 DOM
-
2026-06-10days on market $85,000 Active 9 DOM
-
2026-06-09days on market $85,000 Active 8 DOM
-
2026-06-08days on market $85,000 Active 7 DOM
-
2026-06-07days on market $85,000 Active 6 DOM
-
2026-06-03days on market $85,000 Active 2 DOM
-
2026-06-02remarks 573-char remark
-
2026-06-02$85,000 Active 1 DOM
ⓘ Source: listings_history table (triggers on properties + properties_extension) + one-shot
backfill from property_details.listing_events for pre-trigger history.
Tax reassessment forecast AL · Resets to sale price
- Current annual tax
- $1,212 · $101/mo
- Projected year-2 tax
- $1,212 · $101/mo
- Expected delta
- $0/yr ($0/mo · 0.0%)
ⓘ Screening estimate from a state-policy table — verify with the county assessor before closing.
Climate risk First Street
- Flood 1/10 Low FEMA zone X (unshaded) · 0% chance over 30 yrs
- Wildfire 3/10 Moderate
- Heat 5/10 Major 5 d/yr ≥106°F today · 14 d/yr by 30 yrs out
- Wind 6/10 Major 27% chance of damaging wind over 30 yrs
- Air quality 5/10 Major 7 unhealthy d/yr today · 9 by 30 yrs out
Nearby sold comps map
Loading sold comps map…
Walkable amenities ~0.75 mi
Loading nearby amenities…
Taxation est. · year 1
- Rental income
- $13,539
- − Mortgage interest
- −$4,761
- − Property taxes
- −$1,212
- − Insurance
- −$425
- − Repairs & maintenance
- −$1,083
- − Management
- −$1,083
- − Depreciation
- −$2,473
- Taxable income
- $2,501
- Est. tax owed @ 24.0%
- −$600
- After-tax cash flow
- $3,109/yr
For passive investors: Depreciation is non-cash, so a rental often shows a tax loss while cash-flowing — sheltering income. Rental losses are passive: they offset passive income freely, and up to $25,000/yr can offset ordinary (W-2) income if you actively participate and your MAGI is under $100k (phasing out to $0 by $150k); unused losses carry forward. On sale, claimed depreciation is recaptured at up to 25%, and gains may owe capital-gains tax (a 1031 exchange can defer both). Figures are a year-1 estimate at your 24.0% rate — not tax advice; consult a CPA.
Schools (NCES district)
- District
- Birmingham City
- NCES district ID
- 0100390
- Math proficiency
- 4% ▼ -17.00%
- Reading proficiency
- 20% ▼ -4.00%
- Median HH income
- $31,988
- Composite
- 9.49/100
- National rank
- #9850
- State rank
- #116 of 129 in AL
Livability — Birmingham
- Score
- 67/100
- State rank
- #78
- US rank
- #10412
Category grades
Schools grade is shown separately in the Schools card above.
Census & demographics
- Census place
- Birmingham, AL
- County
- Jefferson County · 527,445 people
- City population
- 210,422
- Metro
- Birmingham-Hoover, AL
- Population (ZIP)
- 15,621
- Household income
- $42,549
- Rent vs Own
- Severe rent burden
- 1169.0
Population outlook (Jefferson County) Hauer SSP2
- Today (2025)
- 669,185 people
- By 2030
- 669,694 · +0.1%
- By 2040
- 661,388 · -1.2%
- By 2050
- 643,086 · -3.9%
- By 2075
- 577,267 · -13.7%
- By 2100
- 474,758 · -29.1%
Race, ethnicity, and origin ACS 2023
- Neighborhood character
- Predominantly Black (73%)
- Race & ethnicity
- Black 73% White 22% Two or more races 3% Hispanic / Latino 2%
- Common ancestry
- Slovak 1%
- Foreign-born
- 3% · Canada
- Languages at home
- 97% English-only · Spanish 2% Other Indo-European 0%
Political lean MEDSL · Jefferson
- 2024 margin
- D (+10.4) · D 54.6% · R 44.2% · Other 1.2%
- 2008→2024 swing
- +5.4pp toward D · 2008: 5.1pp · 2024: 10.4pp
- All cycles
- 2024: D+10.4 2020: D+13.2 2016: D+7.2 2012: D+6.0 2008: D+5.1
Not yet ingested
- Civics
- —
Market trends
- HPI YoY
- ▼ -68.70%
- Current HPI
- 146.2168
- Rent YoY
- ▲ 1.82%
- Metro
- Birmingham-Hoover, AL
- State GDP YoY
- ▲ 2.94%
- F500 in state
- 4
Industry mix (Fortune 500 HQ in AL)
| Industry | F500 HQs | Revenue |
|---|---|---|
| Financial Services | 1 | $8B |
|
||
| Healthcare | 1 | $5B |
|
||
Price history
+37.3% since first listed3 events — show timeline
- 2026-06-01 Listed $85,000 Greater Alabama MLS
- 2022-05-12 Price Changed $750 RENT.
- 2001-06-05 Sold (Public Records) $61,900 Public Records
Property tax history
+13.1%/yrLatest (2025): $1,212 · +2.6% YoY. Source: county tax records.
Cash-flow waterfall
monthlySold comps — $/sqft
last 12 mo · ≤1 miLoading sold comps…