 Multi-family
470 E Avenida Olancha · Palm Springs, CA
Flood risk 1/10 · Minimal
- FEMA flood zone
- X (shaded)
- Chance of flooding over 30 yrs
- 0.0%
- Est. flood insurance / yr
- $507 – $1,088
Fire risk 5/10 · Moderate
- Est. fire insurance / yr
- $659 – $1,223
Heat risk 9/10 · Severe
- Hot days now (above 110°F)
- 9 days/yr
- Hot days in 30 yrs
- 26 days/yr
Wind risk 1/10 · Minimal
- Chance of severe wind over 30 yrs
- —
Air-quality risk 5/10 · Moderate
- Unhealthy air days now
- 6 days/yr
- Unhealthy air days in 30 yrs
- 8 days/yr
Risk factors via First Street. Map © Google.
Why this score? — see what drove the B- grade
The composite is a weighted blend of 9 inputs, each scored 0–100. Each bar is that input's sub-score; the figure is the points it added to the 100-point composite (weight × sub-score).
- Cash flow +30.0/30.0
- 1% rule +10.0/10.0
- DSCR +10.0/10.0
- ARV discount +7.5/15.0
- Livability +3.3/5.0
- Schools +2.7/10.0
- Condition / age +2.5/5.0
- Rent growth +2.4/5.0
- Appreciation +0.0/10.0
$175,000
🖨 Deal sheet (PDF) 📄 Offer letter ✓ Due diligence
Multi-family units
County records classify this as Multi-Family (2-4 Unit). Listing-text estimate: 1 unit. estimate disagrees with records
Listing remarks
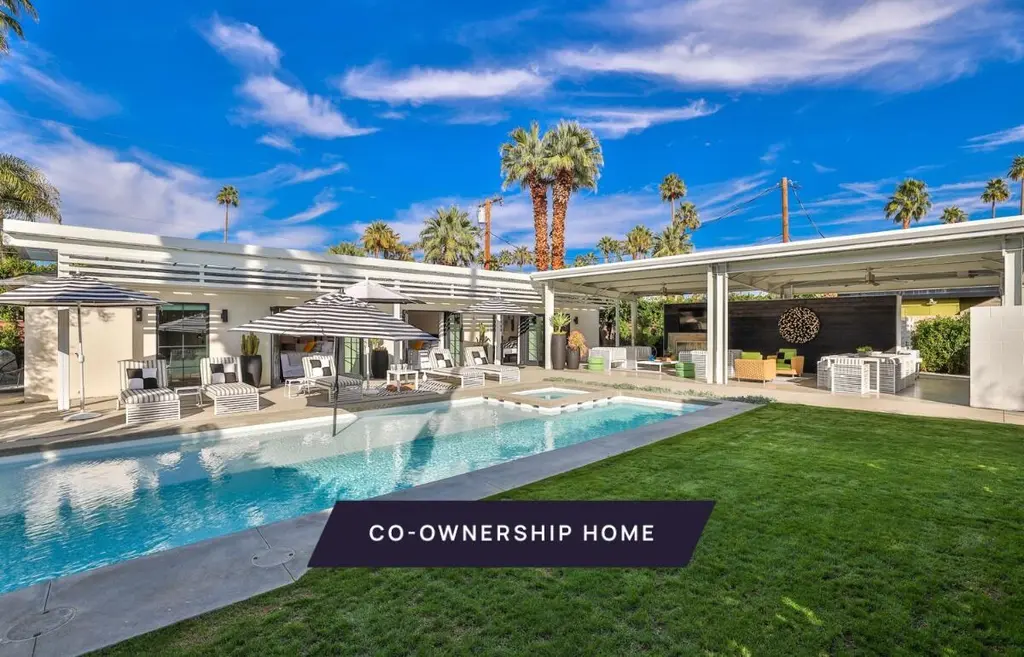
New co-ownership opportunity by Pacaso: Own one-eighth of Bacana, a professionally managed, turnkey home. Bacana is a 5-bedroom, 5-bathroom compound perfectly situated at the end of a little cul-de-sac in sunny South Palm Springs. Overlooking the beautiful San Jacinto mountain range, this flexible vacation home is designed to be simple, fresh, and efficient. The compound has been completely reimagined to accommodate families, friends and large groups with fully furnished designer rooms, efficient kitchens, top-of-the-line appliances and original artwork. The five micro living spaces have three full kitchens, two mini bars and five spa-like bathrooms. The compound has been designed to provid
Key facts
- Turnkey home
- Cul-de-sac
- Efficient kitchens
Tags
Property features AI
Finance
- Other: Fee simple land
- HOA & community: No monthly association fees
Exterior
- Parking: Driveway parking; Three total parking spaces (all uncovered/assigned)
- Security: Closed-circuit cameras; Card/code access
- Utilities: Sewer: connected and paid; PUD: no
- Home design: Single-story home; One level; Year built (owner-provided)
- Construction: In-ground pool and spa
- Exterior features: Built-in gas BBQ; Covered patio; Private in-ground saltwater pool; Private in-ground spa/hot tub; Sprinkler system; Mountain, pool and panoramic views; Updated/remodeled condition; Detached property
Interior
- Kitchen: Refrigerator; Freezer; Dishwasher
- Flooring: Stained concrete
- Bathrooms: Five full bathrooms
- Heating & cooling: Central heating; Air conditioning
- Interior features: Ground-level, no-step entry; Fully furnished; Fireplace (patio)
- Laundry & utility: Washer; Dryer
Neighborhood map
What this means for you Summary
Snapshot
- This is a 3-bed/5.0-bath multifamily listed at $175k.
Deal economics
- At list price, monthly cash flow is $2k ($24k/yr) — positive.
- The deal already cash-flows at list — no discount required.
- Meets the 1% rule at list price ($4k rent vs $175k).
- Recommended offer: $172k (1.5% below list) — sets the bar for market timing.
- Cap rate 20.2% vs local median 2.7% in Palm Springs — top-decile yield for the area; either an underpriced asset or a hidden risk that comps aren't pricing in. Stress-test before assuming the spread holds.
Location & tenants
- Location reads 66/100 on livability (#348 in CA) — a middle-class / working-renter tenant base. Strengths: amenities A+, commute A+; Watch: crime F, cost of living F, health & safety F.
- Palm Springs Unified (suburban): math 21% / reading 42% proficiency, ranked #328 of 517 in CA (top 63%) — families likely to look elsewhere, expect single-tenant / working-renter base with shorter leases; 73% free/reduced lunch — lower-income household profile, screen leases tightly.
- Zoned schools: Cahuilla Elementary (421 students, 93% FRL); Raymond Cree Middle (708 students, 98% FRL); Palm Springs High (math 30% / reading 51%, grade F, #508 of 1,170 statewide, top 44%, 1,584 students, 97% FRL) — zoned schools average 96% FRL vs 73% district-wide (22 pts higher); higher-poverty schools than district average — tighter screening recommended.
- Market conditions: Rents soft (-0.4%/yr); 498 active listings in the ZIP; 40 comparable units currently listed for rent nearby; rentals at typical pace (median 27d on market — plan ~3-4 weeks tenant-placement turnaround); solid renter incomes; 9,195 units permitted in Riverside County in 2024 (1,512 in 5+ unit buildings).
- At $4,099/mo this rent would consume 63% of the median local household income ($78k/yr) (locally 1215% of renters already pay >50% of income on rent) — very limited rent-growth headroom before tenants either downsize or default.
Forward outlook
- Local home prices are declining (-3.0%/yr); year-one equity from $1k of loan paydown is wiped out by about $5k of value loss. Plan a longer hold.
- Riverside County population projected at +22% by 2050 — long-run rental-demand tailwind backs the buy-and-hold thesis.
- At projected returns (-3.0% appreciation + 0.0% rent growth), your $49k cash investment doubles in ~3 years — after that, you're playing with house money.
Negotiation context
- It's been on market 26 days — a 2% lower offer ($172k) is reasonable based on typical stale-listing flexibility.
- 15 sale attempts since 11y ago with the ask held roughly flat each time — persistent listings suggest the price (not the market) is what's stuck; bring a comps-based counter.
Risks & watch-outs
- Watch-outs: built in 1949 — expect roof / HVAC / electrical / plumbing capex.
- Climate carrying-cost: moderate wildfire risk; extreme-heat days projected 9→26/yr by 2055 (HVAC capex compounding) — expect insurance premiums to compound above CPI over the hold.
Questions for the listing agent
- Built in 1949 — when were the roof, HVAC, electrical panel, plumbing, and water heater last replaced?
- Is there a deadline driving the sale (1031 exchange, divorce, estate, relocation)? That informs how much negotiation room exists.
- Crime grade is F in this area — have there been break-ins, vandalism, or insurance claims at this property in the last 3 years? What carrier currently insures it and at what premium?
- What's the average days-on-market for RENTAL listings here right now (not sales)? A rising rental-DOM trend means longer vacancies and softer asking-rent achievability than the comps imply.
- What's the recent tenant-quality profile in this submarket — average credit score on applications, eviction rate, late-payment / NSF rate, and stable-employment percentage? A property-management company in the area should have these aggregated.
- How much new apartment / multifamily construction is in the pipeline within 1–3 miles? Heavy new supply (>2% of stock underway) typically softens rents 12–24 months out; light construction supports rent growth.
Investment metrics
- 1% rule
- 2.34% ✓
- Cap rate
- 20.20%
- Cash-on-cash
- 49.69%
- DSCR
- 3.21
- GRM
- 3.6
CMA / ARV
- ARV (median comp)
- $28,274
- List price
- $175,000
- Delta
- 518.94%
- Verdict
- OVERPRICED
- Comps
- 1 within 2.0 mi
Projected returns pro-forma
-3.0% appreciation · 0.0% rent growth · sell at horizon
- IRR
- 43.9%
- Equity multiple
- 2.81×
- Total profit
- $88,909
- Equity at exit
- $26,093
- IRR
- 48.5%
- Equity multiple
- 5.03×
- Total profit
- $197,635
- Equity at exit
- $15,131
Cash invested: $49,000 (down + closing). Projections, not guarantees.
Landlord ↔ Tenant lean methodology
- Overall (STATE)
- 18 Strongly Tenant-Friendly
- State California
- 18 Strongly Tenant-Friendly · D+13
- County
- — inherits STATE
- City
- — inherits STATE
ZIP-level market 92264
- Rents YoY
- -0.4%
- Active inventory
- 498
- Price-to-rent
- 7.1×
Monthly cashflow live
- Estimated rent
- $4,099 high interval (Pro) →
- Mortgage (P&I)
- −$918
- Tax est. 1.5%
- −$219 /mo · $2,625/yr
- Insurance
- −$73
- HOA
- −$0
- Vacancy / Maint / Mgmt
- −$861
- Net cashflow
- $2,029
Break-even live
Sensitivity live
| Price | -10% $2,150 | -5% $2,089 | +0% $2,029 | +5% $1,968 | +10% $1,908 |
|---|---|---|---|---|---|
| Rent | -10% $1,705 | -5% $1,867 | +0% $2,029 | +5% $2,191 | +10% $2,353 |
| Rate | -1.0pp $2,117 | -0.5pp $2,073 | base $2,029 | +0.5pp $1,983 | +1.0pp $1,937 |
2-unit breakdown (identical units grouped — click to expand)
| Units | Beds | Baths | Est. rent |
|---|---|---|---|
| 2× units | 1 | 1 | $4,098 |
| #1 | 1 | 1 | $2,049 |
| #2 | 1 | 1 | $2,049 |
| Total (2 units) | $4,099 | ||
UW: 25.0% down · 7.5% · 30yr · 1.5% tax · 5.0% vac · 8.0% maint · 8.0% mgmt
Financing live
Cash to close
- Down payment
- $43,750
- Closing costs
- $5,250
- Reserves months
- —
- Total cash needed
- —
Loan-product check · same deal, 3 products live
Conventional
25% down · 7.5% · 30yr
- Down + closing
- —
- Monthly P&I
- —
- Monthly cashflow
- —
- DSCR
- —
- Eligible?
- —
Personal DTI + credit; lowest rate.
DSCR
20% down · 8.5% · 30yr
- Down + closing
- —
- Monthly P&I
- —
- Monthly cashflow
- —
- DSCR
- —
- Eligible?
- —
No personal income docs; deal must DSCR.
Hard money
10% down · 12.0% · 12mo
- Down + closing
- —
- Monthly P&I
- —
- Monthly cashflow
- —
- DSCR
- —
- Eligible?
- —
Short-term bridge; refi at stabilization.
Rent comps 40 comps
| Address | Beds | Baths | Sqft | Rent | $/sqft | DOM | Units | Dist |
|---|---|---|---|---|---|---|---|---|
| 500 Paseo Soleado Unit 497 Palm Springs, CA | 3.0 | 2.5 | 1812 | $3,000 | $1.66 | 46d | 1 | 0.08mi |
| 500 Paseo Soleado Unit 485 Palm Springs, CA | 2.0 | 2.5 | 1712 | $2,800 | $1.64 | 46d | 1 | 0.08mi |
| 780 E Palm Canyon Dr #202 Palm Springs, CA | 2.0 | 2.0 | 1305 | $2,950 | $2.26 | 26d | 1 | 0.14mi |
| 1425 Via Soledad Unit 1 Palm Springs, CA | 2.0 | 2.0 | 1050 | $2,500 | $2.38 | 26d | 1 | 0.18mi |
| 1425 Via Soledad Unit 1 Palm Springs, CA | 2.0 | 2.0 | 1050 | $2,500 | $2.38 | 46d | 1 | 0.18mi |
| 1428 S Camino Real Palm Springs, CA | 2.0 | 2.0 | 1054 | $2,300 | $2.18 | 46d | 1 | 0.22mi |
| 791 E Twin Palms Dr Palm Springs, CA | 3.0 | 2.0 | 1793 | $9,700 | $5.41 | 46d | 1 | 0.26mi |
| 965 E Twin Palms Dr Palm Springs, CA | 3.0 | 2.0 | 1600 | $15,000 | $9.38 | 46d | 1 | 0.32mi |
| 1201 Surrey Ln Palm Springs, CA | 2.0 | 2.5 | 1896 | $5,500 | $2.90 | 46d | 1 | 0.38mi |
| 1150 E Palm Canyon Dr #60 Palm Springs, CA | 2.0 | 2.0 | 1240 | $2,595 | $2.09 | 26d | 1 | 0.44mi |
| 722 E San Lorenzo Rd Palm Springs, CA | 3.0 | 1.0–2.0 | 750 | $2,425 | $3.23 | 10d | 3 | 0.46mi |
| 722 E San Lorenzo Rd Unit 02 Palm Springs, CA | 3.0 | 2.0 | 1200 | $2,425 | $2.02 | 6d | 1 | 0.46mi |
| 1947 S Joshua Tree Pl Palm Springs, CA | 3.0 | 2.5 | 1928 | $6,000 | $3.11 | 26d | 1 | 0.48mi |
| 157 Calle Bravo Palm Springs, CA | 2.0 | 3.0 | 1694 | $2,950 | $1.74 | 1d | 1 | 0.50mi |
| 1970 S Joshua Tree Pl Palm Springs, CA | 3.0 | 2.0 | 1957 | $8,175 | $4.18 | 17d | 1 | 0.52mi |
| 1970 S Joshua Tree Pl Palm Springs, CA | 3.0 | 2.0 | 1957 | $8,175 | $4.18 | 46d | 1 | 0.52mi |
| 1486 E Palm Tree Dr Palm Springs, CA | 2.0 | 2.0 | 1300 | $3,000 | $2.31 | 46d | 1 | 0.62mi |
| 251 E La Verne Way Unit F Palm Springs, CA | 2.0 | 2.0 | 1345 | $2,550 | $1.90 | 26d | 1 | 0.70mi |
| 1041 S La Verne Way Palm Springs, CA | 2.0 | 2.0 | 1325 | $2,800 | $2.11 | 26d | 1 | 0.71mi |
| 1423 E San Lorenzo Rd Palm Springs, CA | 4.0 | 2.0 | 1824 | $4,200 | $2.30 | 26d | 1 | 0.75mi |
| 2220 S Calle Palo Fierro #23 Palm Springs, CA | 2.0 | 2.0 | 1200 | $2,995 | $2.50 | 13d | 1 | 0.75mi |
| 451 E Via Carisma #72 Palm Springs, CA | 2.0 | 2.0 | 1170 | $2,200 | $1.88 | 26d | 1 | 0.76mi |
| 1331 S Sunrise Way Palm Springs, CA | 3.0 | 3.0 | 2160 | $7,000 | $3.24 | 46d | 1 | 0.80mi |
| 1111 E Ramon Rd #87 Palm Springs, CA | 3.0 | 2.0 | 1313 | $4,500 | $3.43 | 19d | 1 | 0.83mi |
| 1710 E Sonora Rd Palm Springs, CA | 2.0 | 2.0 | 1391 | $2,800 | $2.01 | 26d | 1 | 0.83mi |
| 250 E San Jose Rd Palm Springs, CA | 2.0–3.0 | 2.0 | 1187 | $2,400 | $2.02 | 46d | 2 | 0.85mi |
| 250 E San Jose Rd #63 Palm Springs, CA | 2.0 | 2.0 | 1152 | $2,400 | $2.08 | 26d | 1 | 0.85mi |
| 1745 Capri Cir Palm Springs, CA | 2.0 | 2.0 | 1200 | $2,495 | $2.08 | 26d | 1 | 0.91mi |
| 1111 E Ramon Rd Palm Springs, CA | 2.0–3.0 | 2.0 | 1191 | $4,500 | $3.78 | 19d | 2 | 0.98mi |
| 1111 E Ramon Rd Palm Springs, CA | 2.0–3.0 | 2.0 | 1191 | $4,500 | $3.78 | 26d | 2 | 0.98mi |
| 453 Village Square E Palm Springs, CA | 2.0 | 2.0 | 1400 | $3,000 | $2.14 | 19d | 1 | 0.99mi |
| 874 Village Square N Palm Springs, CA | 2.0 | 2.0 | 1680 | $3,000 | $1.79 | 20d | 1 | 1.02mi |
| 998 Village Square N Palm Springs, CA | 2.0 | 2.0 | 1588 | $3,000 | $1.89 | 26d | 1 | 1.03mi |
| 1050 E Ramon Rd Palm Springs, CA | 2.0 | 2.0 | 1253 | $3,815 | $3.04 | 46d | 2 | 1.04mi |
| 1050 E Ramon Rd Palm Springs, CA | 2.0 | 2.0 | 1135 | $3,264 | $2.88 | 1d | 3 | 1.04mi |
| 3000 Cahuilla Hills Dr Palm Springs, CA | 3.0 | 3.0 | 2120 | $7,000 | $3.30 | 46d | 1 | 1.12mi |
| 17 Cahuilla Hills Dr Palm Springs, CA | 2.0 | 2.0 | 1965 | $10,500 | $5.34 | 46d | 1 | 1.13mi |
| 900 E Saturnino Rd Palm Springs, CA | 1.0–3.0 | 1.0–2.0 | 1020 | $2,575 | $2.52 | 0d | 6 | 1.14mi |
| 255 E Avenida Granada #324 Palm Springs, CA | 2.0 | 2.0 | 1198 | $2,100 | $1.75 | 10d | 1 | 1.23mi |
| 255 E Avenida Granada #525 Palm Springs, CA | 2.0 | 2.0 | 1198 | $2,195 | $1.83 | 20d | 1 | 1.23mi |
Listing history 48 events
-
2026-06-17status $175,000 Pending 26 DOM
-
2026-06-17days on market $175,000 Active 26 DOM
-
2026-06-16days on market $175,000 Active 25 DOM
-
2026-06-15days on market $175,000 Active 24 DOM
-
2026-06-13days on market $175,000 Active 22 DOM
-
2026-06-13days on market $175,000 Active 21 DOM
-
2026-06-09days on market $175,000 Active 18 DOM
-
2026-06-08days on market $175,000 Active 17 DOM
-
2026-06-07days on market $175,000 Active 16 DOM
-
2026-06-04days on market $175,000 Active 13 DOM
-
2026-06-03days on market $175,000 Active 12 DOM
-
2026-06-02days on market $175,000 Active 11 DOM
-
2026-06-01days on market $175,000 Active 10 DOM
-
2026-05-31days on market $175,000 Active 9 DOM
-
2026-03-12$175,000 Active 1245-char remark
-
2026-02-24historical
-
2026-02-24historical
-
2026-02-20$175,000 Active
-
2026-02-04$175,000 Active
-
2024-12-11historical
-
2024-08-01$285,000 Active
-
2024-02-13historical
-
2023-10-09$285,000 Active
-
2023-07-17historical
-
2023-05-24historical
-
2023-05-24$285,000 Active
-
2022-11-22$285,000 Active
-
2022-05-02historical
-
2022-04-04$285,000 Active
-
2021-09-02historical
-
2021-07-15$285,000 Active
-
2021-07-14historical
-
2021-03-03soldstatus $285,000 Closed
-
2021-03-03soldstatus $2,000,000
-
2021-03-03$285,000 Active
-
2021-03-02soldstatus $2,000,000
-
2021-02-18status Pending
-
2021-01-26$285,000 Active
-
2021-01-13$2,000,000
-
2016-01-29soldstatus $440,000 Closed
-
2016-01-29soldstatus $440,000 Closed
-
2016-01-29soldstatus $440,000
-
2016-01-19status Pending
-
2015-12-24status Backup Offers Accepted
-
2015-12-10$369,000 Active
-
2015-12-09$369,000
-
2000-10-12soldstatus $25,500
-
1987-08-03soldstatus $110,000
ⓘ Source: listings_history table (triggers on properties + properties_extension) + one-shot
backfill from property_details.listing_events for pre-trigger history.
Climate risk First Street
- Flood 1/10 Low FEMA zone X (shaded) · 0% chance over 30 yrs
- Wildfire 5/10 Major
- Heat 9/10 Extreme 9 d/yr ≥110°F today · 26 d/yr by 30 yrs out
- Wind 1/10 Low
- Air quality 5/10 Major 6 unhealthy d/yr today · 8 by 30 yrs out
Nearby sold comps map
Loading sold comps map…
Walkable amenities ~0.75 mi
Loading nearby amenities…
Taxation est. · year 1
- Rental income
- $49,188
- − Mortgage interest
- −$9,803
- − Property taxes
- −$2,625
- − Insurance
- −$875
- − Repairs & maintenance
- −$3,935
- − Management
- −$3,935
- − Depreciation
- −$5,091
- Taxable income
- $22,924
- Est. tax owed @ 24.0%
- −$5,502
- After-tax cash flow
- $18,844/yr
For passive investors: Depreciation is non-cash, so a rental often shows a tax loss while cash-flowing — sheltering income. Rental losses are passive: they offset passive income freely, and up to $25,000/yr can offset ordinary (W-2) income if you actively participate and your MAGI is under $100k (phasing out to $0 by $150k); unused losses carry forward. On sale, claimed depreciation is recaptured at up to 25%, and gains may owe capital-gains tax (a 1031 exchange can defer both). Figures are a year-1 estimate at your 24.0% rate — not tax advice; consult a CPA.
Schools (NCES district)
- District
- Palm Springs Unified
- NCES district ID
- 0629550
- Math proficiency
- 21% ▼ -7.00%
- Reading proficiency
- 42% ▬ 0.00%
- Median HH income
- $43,638
- Composite
- 26.76/100
- National rank
- #7131
- State rank
- #328 of 517 in CA
Livability — Palm Springs
- Score
- 66/100
- State rank
- #348
- US rank
- #11850
Category grades
Schools grade is shown separately in the Schools card above.
Census & demographics
- Census place
- Palm Springs, CA
- County
- Riverside County · 2,287,001 people
- City population
- 46,786
- Metro
- Riverside-San Bernardino-Ontario, CA
- Population (ZIP)
- 19,899
- Household income
- $77,688
- Rent vs Own
- Severe rent burden
- 1215.0
Population outlook (Riverside County) Hauer SSP2
- Today (2025)
- 2,664,475 people
- By 2030
- 2,802,692 · +5.2%
- By 2040
- 3,050,904 · +14.5%
- By 2050
- 3,256,783 · +22.2%
- By 2075
- 3,655,058 · +37.2%
- By 2100
- 3,766,594 · +41.4%
Race, ethnicity, and origin ACS 2023
- Neighborhood character
- Predominantly White (68%)
- Race & ethnicity
- White 68% Hispanic / Latino 20% Two or more races 12% Asian 6% Black 2% Native American 1%
- Hispanic origin (detail)
- Mexican 16%
- Common ancestry
- Lithuanian 4% Romanian 3% Slovak 3%
- Foreign-born
- 16% · Canada, China, South Korea
- Languages at home
- 81% English-only · Spanish 13% Tagalog/Filipino 2% Other Asian/Pacific 1%
Political lean MEDSL · Riverside
- 2024 margin
- Toss-up / Even · D 48.0% · R 49.3% · Other 2.6%
- 2008→2024 swing
- -3.6pp toward R · 2008: 2.3pp · 2024: -1.3pp
- All cycles
- 2024: R+1.3 2020: D+8.0 2016: D+4.3 2012: R+0.4 2008: D+2.3
Not yet ingested
- Civics
- —
Market trends
- HPI YoY
- ▼ -489.04%
- Current HPI
- 357.0969
- Rent YoY
- ▼ -0.43%
- Metro
- Riverside-San Bernardino-Ontario, CA
- State GDP YoY
- ▲ 3.21%
- F500 in state
- 116
Industry mix (Fortune 500 HQ in CA)
| Industry | F500 HQs | Revenue |
|---|---|---|
| Technology | 27 | $1,492B |
|
||
| Financial Services | 3 | $174B |
|
||
| Retail | 3 | $44B |
|
||
| Insurance | 3 | $26B |
|
||
| Media / Entertainment | 2 | $115B |
|
||
| Pharmaceuticals / Biotech | 2 | $62B |
|
||
Price history
+59.1% since first listed37 events — show timeline
- 2026-06-17 Pending — GPSMLS
- 2026-05-22 Listed $175,000 GPSMLS
- 2026-05-20 Listing Removed — GPSMLS
- 2026-03-12 Listed $175,000 GPSMLS
- 2026-02-24 Listing Removed — GPSMLS
- 2026-02-24 Listing Removed — GPSMLS
- 2026-02-20 Listed $175,000 GPSMLS
- 2026-02-04 Listed $175,000 GPSMLS
- 2024-12-11 Listing Removed — GPSMLS
- 2024-08-01 Listed $285,000 GPSMLS
- 2024-02-13 Listing Removed — GPSMLS
- 2023-10-09 Listed $285,000 GPSMLS
- 2023-07-17 Listing Removed — GPSMLS
- 2023-05-24 Listing Removed — GPSMLS
- 2023-05-24 Listed $285,000 GPSMLS
- 2022-11-22 Listed $285,000 GPSMLS
- 2022-05-02 Listing Removed — GPSMLS
- 2022-04-04 Listed $285,000 GPSMLS
- 2021-09-02 Listing Removed — GPSMLS
- 2021-07-15 Listed $285,000 GPSMLS
- 2021-07-14 Listing Removed — GPSMLS
- 2021-03-03 Listed $285,000 GPSMLS
- 2021-03-03 Sold (MLS) $2,000,000 GPSMLS
- 2021-03-03 Sold (MLS) $285,000 GPSMLS
- 2021-03-02 Sold (Public Records) $2,000,000 Public Records
- 2021-02-18 Pending — GPSMLS
- 2021-01-26 Listed $285,000 GPSMLS
- 2021-01-13 Listed $2,000,000 GPSMLS
- 2016-01-29 Sold (MLS) $440,000 SDMLS
- 2016-01-29 Sold (MLS) $440,000 GPSMLS
- 2016-01-29 Sold (MLS) $440,000 GPSMLS
- 2016-01-19 Pending — GPSMLS
- 2015-12-24 Pending — GPSMLS
- 2015-12-10 Listed $369,000 GPSMLS
- 2015-12-09 Listed $369,000 SDMLS
- 2000-10-12 Sold (Public Records) $25,500 Public Records
- 1987-08-03 Sold (Public Records) $110,000 Public Records
Property tax history
+15.6%/yrLatest (2025): $26,106 · -2.6% YoY. Source: county tax records.
Cash-flow waterfall
monthlySold comps — $/sqft
last 12 mo · ≤1 miLoading sold comps…