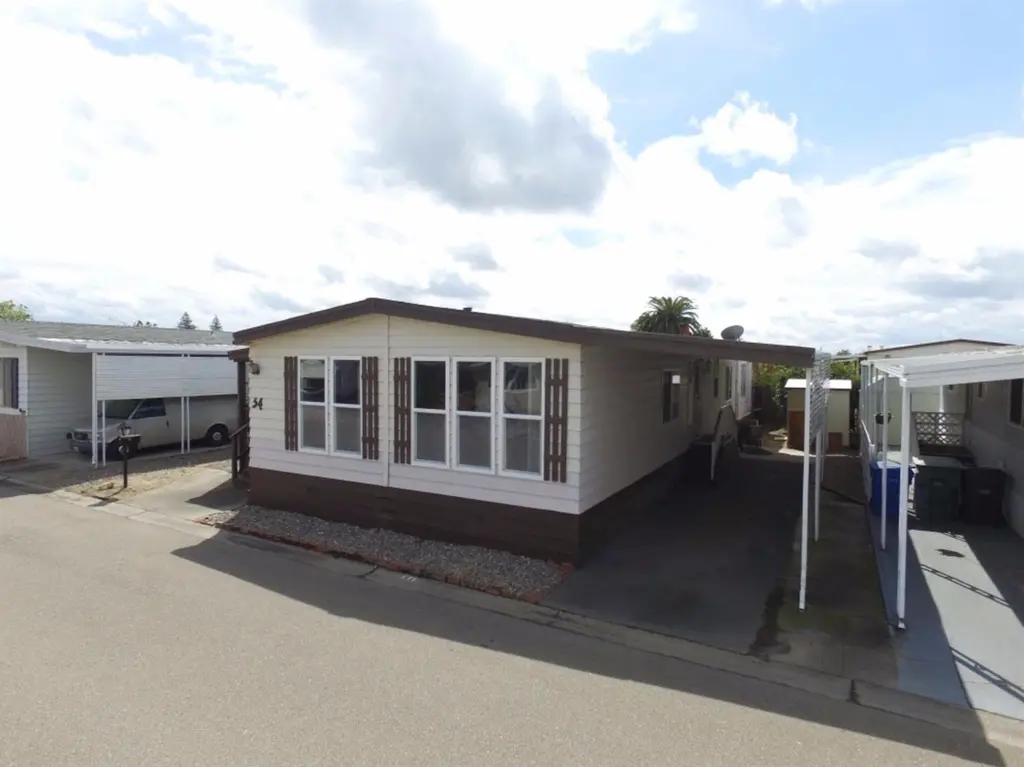
150 Pestana Ave #54 · Manteca, CA
Flood risk 1/10 · Minimal
- FEMA flood zone
- X (unshaded)
- Chance of flooding over 30 yrs
- 0.0%
- Est. flood insurance / yr
- $507 – $1,088
Fire risk 6/10 · Moderate
- Est. fire insurance / yr
- $659 – $1,223
Heat risk 7/10 · Major
- Hot days now (above 102°F)
- 7 days/yr
- Hot days in 30 yrs
- 15 days/yr
Wind risk 1/10 · Minimal
- Chance of severe wind over 30 yrs
- —
Air-quality risk 10/10 · Severe
- Unhealthy air days now
- 30 days/yr
- Unhealthy air days in 30 yrs
- 31 days/yr
Risk factors via First Street. Map © Google.
Why this score? — see what drove the C grade
The composite is a weighted blend of 9 inputs, each scored 0–100. Each bar is that input's sub-score; the figure is the points it added to the 100-point composite (weight × sub-score).
- Cash flow +28.4/30.0
- DSCR +10.0/10.0
- 1% rule +7.8/10.0
- Livability +3.1/5.0
- Schools +2.9/10.0
- Condition / age +2.5/5.0
- Rent growth +2.3/5.0
- ARV discount +1.8/15.0
- Appreciation +0.0/10.0
$180,000
🖨 Deal sheet 📄 Offer letter ✓ Due diligence
Listing remarks
A gem nestled in the desirable Almond Blossom Estates 55+ senior living community. This double wide mobile 2 bed / 2 bath home with 1,664 square feet of living space offers an open living/dining combo with vaulted ceilings, remodeled kitchen eqipped with pantry and stainless steel appliances, primary bedroom suite, flex room (family/den optional), laundry room with washer/dryer and linen cabinets. Other amenities include Central Heat and AC, double pane windows and glass sliders, ceiling fan, enclosed front porch, covered carport and a pavered backyard with fruit trees. Minutes to major thoroughfares, shopping centers, schools, restaurants and gym. A must see!!!
Key facts
- Garage
- Community pool
- Built 1976
Property features AI
Finance
- Other: Zoned SFD
- HOA & community: No association fee listed (0); Gated community; Community pool
Exterior
- Parking: Covered parking; 1 covered space; 1-car garage
- Security: Security gate; Carbon monoxide detector(s)
- Utilities: Public water; Sewer connected; Electric: 220 volts in kitchen and laundry
- Home design: Residential mobile home; Built in 1976; Remodeled kitchen and baths within last 5 years
- Construction: Composition/shingle roof; Concrete, pillar/post/pier and block foundation; Other construction materials
- Exterior features: Entry at ground level (entry level 0); Community pool; Gated community; Age restrictions
Interior
- Kitchen: Microwave; Disposal; Free‑standing refrigerator; Free‑standing gas range
- Bedrooms: 2 bedrooms
- Flooring: Laminate
- Bathrooms: 2 full bathrooms
- Heating & cooling: Central heating; Central air
- Interior features: Updated/remodeled condition; Inside laundry; Central heating; Central air conditioning; Security gate; Double-strapped water heater; Carbon monoxide detector(s)
- Laundry & utility: Washer; Dryer; 220V in laundry; 220V in kitchen
Neighborhood map
What this means for you Summary
Snapshot
- This is a 2-bed/2.0-bath manufactured listed at $180k.
Deal economics
- At list price, monthly cash flow is $583 ($7k/yr) — positive.
- The deal already cash-flows at list — no discount required.
- Meets the 1% rule at list price ($2k rent vs $180k).
- Cap rate 10.2% vs local median 2.7% in Manteca — top-decile yield for the area; either an underpriced asset or a hidden risk that comps aren't pricing in. Stress-test before assuming the spread holds.
Location & tenants
- Location reads 61/100 on livability (#535 in CA) — a middle-class / working-renter tenant base. Strengths: housing A+, employment A; Watch: schools D+, amenities D, commute F.
- Manteca Unified (suburban): math 15% / reading 48% proficiency, ranked #297 of 517 in CA (top 57%) — families likely to look elsewhere, expect single-tenant / working-renter base with shorter leases.
- Market conditions: Rents soft (-0.7%/yr); 270 active listings in the ZIP; 7 comparable units currently listed for rent nearby; rentals at typical pace (median 19d on market — plan ~3-4 weeks tenant-placement turnaround); solid renter incomes; 3,779 units permitted in San Joaquin County in 2024 (0 in 5+ unit buildings).
- This rent runs 31% of the median local income ($89k/yr) — at the standard rent-burdened threshold; future hikes will face affordability resistance.
Forward outlook
- Local home prices are declining (-3.0%/yr); year-one equity from $1k of loan paydown is wiped out by about $5k of value loss. Plan a longer hold.
- San Joaquin County population projected at +17% by 2050 — long-run rental-demand tailwind backs the buy-and-hold thesis.
Negotiation context
- Only 5 days on market — expect competitive offers; lowballing is unlikely to land.
- 2 sale attempts with the ask held roughly flat each time — persistent listings suggest the price (not the market) is what's stuck; bring a comps-based counter.
Risks & watch-outs
- Climate carrying-cost: major wildfire risk; extreme-heat days projected 7→15/yr by 2055 (HVAC capex compounding) — expect insurance premiums to compound above CPI over the hold.
Questions for the listing agent
- Built in 1976 — when were the roof, HVAC, electrical panel, plumbing, and water heater last replaced?
- Is there a deadline driving the sale (1031 exchange, divorce, estate, relocation)? That informs how much negotiation room exists.
- Schools are D-rated, which usually means shorter tenancies and higher turnover. Who's the typical renter profile here, and what's been the actual vacancy rate?
- What's the average days-on-market for RENTAL listings here right now (not sales)? A rising rental-DOM trend means longer vacancies and softer asking-rent achievability than the comps imply.
- What's the recent tenant-quality profile in this submarket — average credit score on applications, eviction rate, late-payment / NSF rate, and stable-employment percentage? A property-management company in the area should have these aggregated.
- How much new for-sale + rental construction is in the pipeline within 1–3 miles? Heavy new supply typically softens prices + rents 12–24 months out; constrained supply supports both.
Investment metrics
- 1% rule
- 1.28% ✓
- Cap rate
- 10.18%
- Cash-on-cash
- 13.87%
- DSCR
- 1.62
- GRM
- 6.5
CMA / ARV
- ARV (on-the-fly)
- $159,744
- Comps found
- 12
Show comp detail 12 sales within ~0.75 mi
| Address | Dist | Beds/Ba | Sqft | Sold | Price | $/sf | Match |
|---|---|---|---|---|---|---|---|
| 1830 Yosemite Ave #118 | 0.26mi | 2/2.0 | 1,624 (-2%) | 10mo | $207,000 | $127 | 75 |
| 150 Pestana | 0.01mi | 2/2.0 | 1,554 (-7%) | 20mo | $171,000 | $110 | 72 |
| 1830 E Yosemite #207 | 0.29mi | 2/2.0 | 1,536 (-8%) | 7mo | $148,000 | $96 | 68 |
| 1830 E Yosemite Ave #275 | 0.29mi | 2/2.0 | 1,500 (-10%) | 7mo | $114,000 | $76 | 64 |
| 1830 E Yosemite #128 | 0.28mi | 2/2.0 | 1,440 (-14%) | 2mo | $100,000 | $69 | 62 |
| 1830 E Yosemite Ave #257 | 0.29mi | 2/2.0 | 1,488 (-11%) | 11mo | $143,500 | $96 | 59 |
| 150 Pestana Ave #25 | 0.00mi | 3/2.0 (+1) | 1,440 (-14%) | 16mo | $125,000 | $87 | 59 |
| 150 Pestana #34 | 0.05mi | 3/2.0 (+1) | 1,440 (-14%) | 19mo | $149,888 | $104 | 54 |
| 1830 E Yosemite Ave #1 | 0.33mi | 2/2.0 | 1,444 (-13%) | 14mo | $232,000 | $161 | 51 |
| 1830 E Yosemite Ave #251 | 0.28mi | 2/2.0 | 1,440 (-14%) | 20mo | $138,000 | $96 | 48 |
| 1830 E Yosemite Ave #137 | 0.29mi | 3/2.0 (+1) | 1,440 (-14%) | 17mo | $125,000 | $87 | 45 |
| 1830 E Yosemite Ave #197 | 0.29mi | 2/2.0 | 1,440 (-14%) | 24mo | $90,000 | $63 | 44 |
Match score weights: distance 35% · size 25% · config 20% · recency 20%. Top-matched comps best support the ARV.
Projected returns pro-forma
-3.0% appreciation · 0.0% rent growth · sell at horizon
- IRR
- 0.6%
- Equity multiple
- 1.02×
- Total profit
- $1,198
- Equity at exit
- $26,839
- IRR
- 7.0%
- Equity multiple
- 1.45×
- Total profit
- $22,779
- Equity at exit
- $15,563
Cash invested: $50,400 (down + closing). Projections, not guarantees.
Landlord ↔ Tenant lean methodology
- Overall (STATE)
- 18 Strongly Tenant-Friendly
- State California
- 18 Strongly Tenant-Friendly · D+13
- County
- — inherits STATE
- City
- — inherits STATE
ZIP-level market 95336
- Rents YoY
- -0.7%
- Active inventory
- 270
- Price-to-rent
- 6.5×
Monthly cashflow live
- Estimated rent
- $2,312 high interval (Pro) →
- Mortgage (P&I)
- −$944
- Tax est. 1.5%
- −$225 /mo · $2,700/yr
- Insurance
- −$75
- HOA
- −$0
- Vacancy / Maint / Mgmt
- −$486
- Net cashflow
- $583
Break-even live
UW: 25.0% down · 7.5% · 30yr · 1.5% tax · 5.0% vac · 8.0% maint · 8.0% mgmt
Financing live
Cash to close
- Down payment
- $45,000
- Closing costs
- $5,400
- Reserves months
- —
- Total cash needed
- —
Loan-product check · same deal, 3 products live
Conventional
25% down · 7.5% · 30yr
- Down + closing
- —
- Monthly P&I
- —
- Monthly cashflow
- —
- DSCR
- —
- Eligible?
- —
Personal DTI + credit; lowest rate.
DSCR
20% down · 8.5% · 30yr
- Down + closing
- —
- Monthly P&I
- —
- Monthly cashflow
- —
- DSCR
- —
- Eligible?
- —
No personal income docs; deal must DSCR.
Hard money
10% down · 12.0% · 12mo
- Down + closing
- —
- Monthly P&I
- —
- Monthly cashflow
- —
- DSCR
- —
- Eligible?
- —
Short-term bridge; refi at stabilization.
Rent comps 7 comps
| Address | Beds | Baths | Sqft | Rent | $/sqft | DOM | Units | Dist |
|---|---|---|---|---|---|---|---|---|
| 1815 Azure Ct Unit C Manteca, CA | 2.0 | 2.0 | 1400 | $1,800 | $1.29 | 19d | 1 | 0.09mi |
| 2054 Hyannis Cir Manteca, CA | 3.0 | 2.0 | 1664 | $2,495 | $1.50 | 19d | 1 | 0.16mi |
| 1634 Sierra Creek Dr Manteca, CA | 3.0 | 2.0 | 1411 | $3,100 | $2.20 | 19d | 1 | 0.57mi |
| 311 Charles Ave Manteca, CA | 3.0 | 2.0 | 1092 | $2,750 | $2.52 | 23d | 1 | 0.80mi |
| 794 Button Ave Manteca, CA | 2.0 | 2.0 | 1075 | $2,300 | $2.14 | 14d | 1 | 0.87mi |
| 522 Dawn Dr Manteca, CA | 3.0 | 2.5 | 1687 | $2,500 | $1.48 | 43d | 1 | 1.25mi |
| 708 Meadow Way Manteca, CA | 3.0 | 2.0 | 1843 | $2,750 | $1.49 | 14d | 1 | 1.35mi |
Listing history 6 events
-
2026-06-18days on market $180,000 Active 5 DOM
-
2026-06-17days on market $180,000 Active 4 DOM
-
2026-06-16days on market $180,000 Active 3 DOM
-
2026-06-15days on market $180,000 Active 2 DOM
-
2026-06-14remarks 670-char remark
-
2026-06-14$180,000 Active 1 DOM
ⓘ Source: listings_history table (triggers on properties + properties_extension) + one-shot
backfill from property_details.listing_events for pre-trigger history.
Climate risk First Street
- Flood 1/10 Low FEMA zone X (unshaded) · 0% chance over 30 yrs
- Wildfire 6/10 Major
- Heat 7/10 Severe 7 d/yr ≥102°F today · 15 d/yr by 30 yrs out
- Wind 1/10 Low
- Air quality 10/10 Extreme 30 unhealthy d/yr today · 31 by 30 yrs out
Nearby sold comps map
Loading sold comps map…
Walkable amenities ~0.75 mi
Loading nearby amenities…
Taxation est. · year 1
- Rental income
- $27,745
- − Mortgage interest
- −$10,083
- − Property taxes
- −$2,700
- − Insurance
- −$900
- − Repairs & maintenance
- −$2,220
- − Management
- −$2,220
- − Depreciation
- −$5,236
- Taxable income
- $4,387
- Est. tax owed @ 24.0%
- −$1,053
- After-tax cash flow
- $5,938/yr
For passive investors: Depreciation is non-cash, so a rental often shows a tax loss while cash-flowing — sheltering income. Rental losses are passive: they offset passive income freely, and up to $25,000/yr can offset ordinary (W-2) income if you actively participate and your MAGI is under $100k (phasing out to $0 by $150k); unused losses carry forward. On sale, claimed depreciation is recaptured at up to 25%, and gains may owe capital-gains tax (a 1031 exchange can defer both). Figures are a year-1 estimate at your 24.0% rate — not tax advice; consult a CPA.
Schools (NCES district)
- District
- Manteca Unified
- NCES district ID
- 0623610
- Math proficiency
- 15% ▼ -14.00%
- Reading proficiency
- 48% ▬ 0.00%
- Median HH income
- $62,426
- Composite
- 28.5/100
- National rank
- #6737
- State rank
- #297 of 517 in CA
Livability — Manteca
- Score
- 61/100
- State rank
- #535
- US rank
- #17877
Category grades
Schools grade is shown separately in the Schools card above.
Census & demographics
- Census place
- Manteca, CA
- County
- San Joaquin County · 729,570 people
- City population
- 98,916
- Metro
- Stockton, CA
- Population (ZIP)
- 50,185
- Household income
- $89,172
- Rent vs Own
- Severe rent burden
- 876.0
Population outlook (San Joaquin County) Hauer SSP2
- Today (2025)
- 796,965 people
- By 2030
- 828,849 · +4.0%
- By 2040
- 885,611 · +11.1%
- By 2050
- 929,798 · +16.7%
- By 2075
- 994,578 · +24.8%
- By 2100
- 971,291 · +21.9%
Race, ethnicity, and origin ACS 2023
- Neighborhood character
- Diverse neighborhood (Simpson 0.63)
- Race & ethnicity
- Hispanic / Latino 43% White 42% Two or more races 18% Asian 7% Black 2%
- Hispanic origin (detail)
- Mexican 37%
- Common ancestry
- Russian 3% Lithuanian 2% Slovak 1%
- Foreign-born
- 17% · Canada
- Languages at home
- 69% English-only · Spanish 23% Other Asian/Pacific 3% Other Indo-European 2%
Political lean MEDSL · San Joaquin
- 2024 margin
- Toss-up / Even · D 48.0% · R 48.9% · Other 3.0%
- 2008→2024 swing
- -11.6pp toward R · 2008: 10.7pp · 2024: -0.9pp
- All cycles
- 2024: R+0.9 2020: D+13.9 2016: D+12.9 2012: D+8.9 2008: D+10.7
Not yet ingested
- Civics
- —
Market trends
- HPI YoY
- ▼ -407.05%
- Current HPI
- 268.5708
- Rent YoY
- ▼ -0.68%
- Metro
- Stockton, CA
- State GDP YoY
- ▲ 3.21%
- F500 in state
- 116
Industry mix (Fortune 500 HQ in CA)
| Industry | F500 HQs | Revenue |
|---|---|---|
| Technology | 27 | $1,492B |
|
||
| Financial Services | 3 | $174B |
|
||
| Retail | 3 | $44B |
|
||
| Insurance | 3 | $26B |
|
||
| Media / Entertainment | 2 | $115B |
|
||
| Pharmaceuticals / Biotech | 2 | $62B |
|
||
Price history
-10.0% since first listed2 events — show timeline
- 2026-06-13 Listed $180,000 San Francisco MLS
- 2025-05-02 Listed $200,000 San Francisco MLS
Cash-flow waterfall
monthlySold comps — $/sqft
last 12 mo · ≤1 miLoading sold comps…