 🏷️ Likely Rental
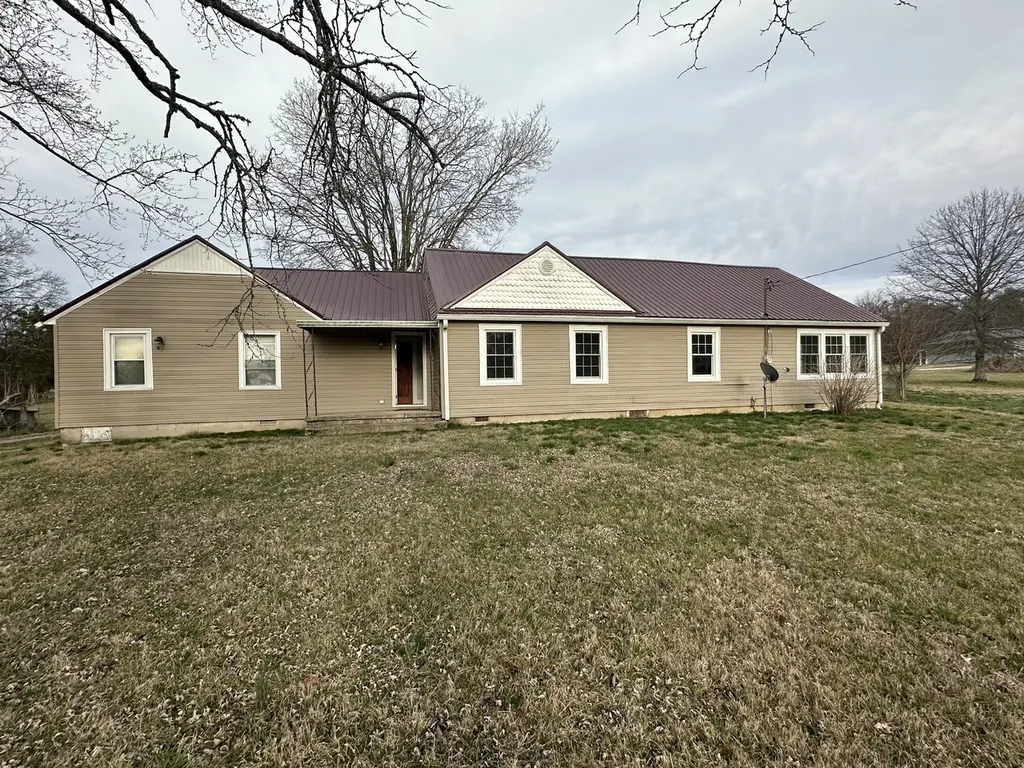
280 Oscar Crowell Rd · Lakewood Park, TN
Flood risk 1/10 · Minimal
- FEMA flood zone
- X (unshaded)
- Chance of flooding over 30 yrs
- 0.0%
- Est. flood insurance / yr
- $507 – $1,088
Fire risk 3/10 · Minor
- Est. fire insurance / yr
- $949 – $1,763
Heat risk 5/10 · Moderate
- Hot days now (above 103°F)
- 7 days/yr
- Hot days in 30 yrs
- 21 days/yr
Wind risk 4/10 · Minor
- Chance of severe wind over 30 yrs
- 10.0%
Air-quality risk 2/10 · Minimal
- Unhealthy air days now
- 1 days/yr
- Unhealthy air days in 30 yrs
- 2 days/yr
Risk factors via First Street. Map © Google.
Why this score? — see what drove the D grade
The composite is a weighted blend of 9 inputs, each scored 0–100. Each bar is that input's sub-score; the figure is the points it added to the 100-point composite (weight × sub-score).
- ARV discount +15.0/15.0
- Appreciation +10.0/10.0
- Cash flow +5.6/30.0
- Livability +2.6/5.0
- Rent growth +2.5/5.0
- Condition / age +2.5/5.0
- Schools +2.1/10.0
- 1% rule +0.0/10.0
- DSCR +0.0/10.0
$285,000
🖨 Deal sheet (PDF) 📄 Offer letter ✓ Due diligence
Listing remarks MLS
Investor Opportunity! Home is leased until 2/28/27 ($1,800/mo). Enjoy peaceful country living with stunning sunset views at 280 Oscar Crowell Rd in Beechgrove, TN. This 1,982 SF home sits on a beautiful 2-acre tract and offers 3 bedrooms and 2 bathrooms with a spacious, functional kitchen perfect for everyday living and entertaining. Some original hardwood floors add character and warmth throughout the home. Step outside to relax on the covered back porch and take in the breathtaking sunsets and surrounding countryside. The property also includes a shed and a small barn, ideal for storage, hobbies, or light livestock use. HVAC was replaced in March of 2026. Conveniently located just minutes from I-24, this home provides easy access to Murfreesboro, Manchester, and beyond while still offering the privacy and charm of rural living. Property next door is also available for sale (336 Oscar Crowell Rd).
Key facts
- Shed
- 2 acre tract
- Small barn
Tags
Neighborhood map
What this means for you Summary
Snapshot
- This is a 3-bed/2.0-bath single-family listed at $285k.
Deal economics
- At list price, monthly cash flow is $-600 ($-7k/yr) — negative.
- To cash-flow at today's rent, offer at most $179k (37.2% below list).
- To meet the 1% rule (rent ≥ 1% of price), the offer needs to be $140k (51.0% below list).
- Recommended offer: $140k (51.0% below list) — sets the bar for 1% rule.
- Cap rate 3.8% vs local median 2.1% in Lakewood Park — top-decile yield for the area; either an underpriced asset or a hidden risk that comps aren't pricing in. Stress-test before assuming the spread holds.
Location & tenants
- Location reads 52/100 on livability (#395 in TN) — a working-class tenant base; expect higher turnover. Strengths: cost of living A+, housing A+; Watch: health & safety C-, schools F, crime F.
- Coffee County (rural): math 22% / reading 27% proficiency, ranked #87 of 139 in TN (top 63%) — low school quality limits family demand, transient renter base, plan for 1-2y turnover.
- Market conditions: 36 active listings in the ZIP; 389 units permitted in Coffee County in 2024 (6 in 5+ unit buildings).
Forward outlook
- In year one you build about $30k of equity ($2k loan paydown + $28k appreciation (10.0% local appreciation)).
- Coffee County population projected at +9% by 2050 — modest demand growth; plan on rents tracking national, not racing it.
- By year 2, paydown + projected appreciation supports a ~$49k cash-out refi (75% LTV) — recoverable capital for the next deal without selling this one.
Negotiation context
- It's been on market 102 days — a 9% lower offer ($259k) is reasonable based on typical stale-listing flexibility.
- 2 sale attempts since 13y ago with the ask held roughly flat each time — persistent listings suggest the price (not the market) is what's stuck; bring a comps-based counter.
- Current owner paid $145k; list at $285k implies a 97% gain — meaningful room to come down on a strong offer.
Risks & watch-outs
- Climate carrying-cost: extreme-heat days projected 7→21/yr by 2055 (HVAC capex compounding) — expect insurance premiums to compound above CPI over the hold.
Questions for the listing agent
- What do current leases actually rent for vs. the listed asking? Can we see a recent rent roll and the last 12 months of T-12 income?
- It's been on market 102 days. Have you received any prior offers? Is the seller open to a 51% concession, seller financing, or rate buy-down credit?
- Why hasn't it sold? Are there any deal-killer items the seller is aware of (foundation, flood, title, zoning, code violations)?
- Is there a deadline driving the sale (1031 exchange, divorce, estate, relocation)? That informs how much negotiation room exists.
- Schools are F-rated, which usually means shorter tenancies and higher turnover. Who's the typical renter profile here, and what's been the actual vacancy rate?
- Crime grade is F in this area — have there been break-ins, vandalism, or insurance claims at this property in the last 3 years? What carrier currently insures it and at what premium?
- The area grade is low — what's the realistic commute time and amenity access for the typical tenant pool here? Any planned neighborhood developments (good or bad) we should know about?
- What's the average days-on-market for RENTAL listings here right now (not sales)? A rising rental-DOM trend means longer vacancies and softer asking-rent achievability than the comps imply.
- What's the recent tenant-quality profile in this submarket — average credit score on applications, eviction rate, late-payment / NSF rate, and stable-employment percentage? A property-management company in the area should have these aggregated.
- How much new for-sale + rental construction is in the pipeline within 1–3 miles? Heavy new supply typically softens prices + rents 12–24 months out; constrained supply supports both.
Investment metrics
- 1% rule
- 0.49% ✗
- Cap rate
- 3.77%
- Cash-on-cash
- -9.02%
- DSCR
- 0.60
- GRM
- 17.0
CMA / ARV
- ARV (median comp)
- $482,050
- List price
- $285,000
- Delta
- -40.88%
- Verdict
- UNDERPRICED
- Comps
- 2 within 1.0 mi
Show comp detail 1 sale within ~0.75 mi
| Address | Dist | Beds/Ba | Sqft | Sold | Price | $/sf | Match |
|---|---|---|---|---|---|---|---|
| 413 Bankshire Rd | 0.22mi | 3/2.0 | 1,947 (-2%) | 2mo | $430,000 | $221 | 85 |
Match score weights: distance 35% · size 25% · config 20% · recency 20%. Top-matched comps best support the ARV.
Projected returns pro-forma
10.0% appreciation · 3.0% rent growth · sell at horizon
- IRR
- 17.9%
- Equity multiple
- 2.46×
- Total profit
- $116,878
- Equity at exit
- $256,751
- IRR
- 16.8%
- Equity multiple
- 5.69×
- Total profit
- $373,940
- Equity at exit
- $553,692
Cash invested: $79,800 (down + closing). Projections, not guarantees.
Landlord ↔ Tenant lean methodology
- Overall (STATE)
- 87 Strongly Landlord-Friendly
- State Tennessee
- 87 Strongly Landlord-Friendly · R+13
- County
- — inherits STATE
- City
- — inherits STATE
ZIP-level market 37018
- Home prices YoY
- 24.8%
- Active inventory
- 36
- Price-to-rent
- 17.0×
Monthly cashflow live
- Estimated rent
- $1,396 medium interval (Pro) →
- Mortgage (P&I)
- −$1,495
- Tax from tax record
- −$89 /mo · $1,070/yr
- Insurance
- −$119
- HOA
- −$0
- Vacancy / Maint / Mgmt
- −$293
- Net cashflow
- $-600
Break-even live
Sensitivity live
| Price | -10% $-438 | -5% $-519 | +0% $-600 | +5% $-680 | +10% $-761 |
|---|---|---|---|---|---|
| Rent | -10% $-710 | -5% $-655 | +0% $-600 | +5% $-545 | +10% $-489 |
| Rate | -1.0pp $-456 | -0.5pp $-527 | base $-600 | +0.5pp $-674 | +1.0pp $-749 |
UW: 25.0% down · 7.5% · 30yr · 1.5% tax · 5.0% vac · 8.0% maint · 8.0% mgmt
Financing live
Cash to close
- Down payment
- $71,250
- Closing costs
- $8,550
- Reserves months
- —
- Total cash needed
- —
Loan-product check · same deal, 3 products live
Conventional
25% down · 7.5% · 30yr
- Down + closing
- —
- Monthly P&I
- —
- Monthly cashflow
- —
- DSCR
- —
- Eligible?
- —
Personal DTI + credit; lowest rate.
DSCR
20% down · 8.5% · 30yr
- Down + closing
- —
- Monthly P&I
- —
- Monthly cashflow
- —
- DSCR
- —
- Eligible?
- —
No personal income docs; deal must DSCR.
Hard money
10% down · 12.0% · 12mo
- Down + closing
- —
- Monthly P&I
- —
- Monthly cashflow
- —
- DSCR
- —
- Eligible?
- —
Short-term bridge; refi at stabilization.
Listing history 23 events
-
2026-06-21days on market $285,000 Active 102 DOM
-
2026-06-19days on market $285,000 Active 100 DOM
-
2026-06-18days on market $285,000 Active 99 DOM
-
2026-06-17days on market $285,000 Active 98 DOM
-
2026-06-16days on market $285,000 Active 97 DOM
-
2026-06-15days on market $285,000 Active 96 DOM
-
2026-06-14days on market $285,000 Active 94 DOM
-
2026-06-13days on market $285,000 Active 93 DOM
-
2026-06-10days on market $285,000 Active 91 DOM
-
2026-06-09days on market $285,000 Active 90 DOM
-
2026-06-08days on market $285,000 Active 89 DOM
-
2026-06-07days on market $285,000 Active 88 DOM
-
2026-06-05days on market $285,000 Active 85 DOM
-
2026-06-02days on market $285,000 Active 83 DOM
-
2026-06-01days on market $285,000 Active 82 DOM
-
2026-05-31days on market $285,000 Active 81 DOM
-
2026-05-30days on market $285,000 Active 80 DOM
-
2026-03-11$285,000 Active 911-char remark
Show marketing remark (911 chars)
Investor Opportunity! Home is leased until 2/28/27 ($1,800/mo). Enjoy peaceful country living with stunning sunset views at 280 Oscar Crowell Rd in Beechgrove, TN. This 1,982 SF home sits on a beautiful 2-acre tract and offers 3 bedrooms and 2 bathrooms with a spacious, functional kitchen perfect for everyday living and entertaining. Some original hardwood floors add character and warmth throughout the home. Step outside to relax on the covered back porch and take in the breathtaking sunsets and surrounding countryside. The property also includes a shed and a small barn, ideal for storage, hobbies, or light livestock use. HVAC was replaced in March of 2026. Conveniently located just minutes from I-24, this home provides easy access to Murfreesboro, Manchester, and beyond while still offering the privacy and charm of rural living. Property next door is also available for sale (336 Oscar Crowell Rd).
-
2018-08-10soldstatus $145,000
-
2013-03-22soldstatus $44,150 230-char remark
Show marketing remark (230 chars)
1940's Farmhouse on 2 acres. Covered porch, hardwood flooring, seperate dining area, lots of storage. Under Freddie Mac "First Look" initiative until Feb. 14th. Buyer to verify all information/measurements, if important.
-
2013-02-13historical 230-char remark
Show marketing remark (230 chars)
1940's Farmhouse on 2 acres. Covered porch, hardwood flooring, seperate dining area, lots of storage. Under Freddie Mac "First Look" initiative until Feb. 14th. Buyer to verify all information/measurements, if important.
-
2013-01-30$44,900 230-char remark
Show marketing remark (230 chars)
1940's Farmhouse on 2 acres. Covered porch, hardwood flooring, seperate dining area, lots of storage. Under Freddie Mac "First Look" initiative until Feb. 14th. Buyer to verify all information/measurements, if important.
-
1999-10-06soldstatus $76,000
ⓘ Source: listings_history table (triggers on properties + properties_extension) + one-shot
backfill from property_details.listing_events for pre-trigger history.
Tax reassessment forecast TN · Resets to sale price
- Current annual tax
- $1,070 · $89/mo
- Projected year-2 tax
- $2,024 · $169/mo
- Expected delta
- +$954/yr (+$79/mo · 89.1%)
ⓘ Screening estimate from a state-policy table — verify with the county assessor before closing.
Climate risk First Street
- Flood 1/10 Low FEMA zone X (unshaded) · 0% chance over 30 yrs
- Wildfire 3/10 Moderate
- Heat 5/10 Major 7 d/yr ≥103°F today · 21 d/yr by 30 yrs out
- Wind 4/10 Moderate 10% chance of damaging wind over 30 yrs
- Air quality 2/10 Low 1 unhealthy d/yr today · 2 by 30 yrs out
Nearby sold comps map
Loading sold comps map…
Walkable amenities ~0.75 mi
Loading nearby amenities…
Taxation est. · year 1
- Rental income
- $16,751
- − Mortgage interest
- −$15,964
- − Property taxes
- −$1,070
- − Insurance
- −$1,425
- − Repairs & maintenance
- −$1,340
- − Management
- −$1,340
- − Depreciation
- −$8,291
- Taxable loss
- −$12,680
- Est. tax savings @ 24.0%
- +$3,043
- After-tax cash flow
- $-4,154/yr
For passive investors: Depreciation is non-cash, so a rental often shows a tax loss while cash-flowing — sheltering income. Rental losses are passive: they offset passive income freely, and up to $25,000/yr can offset ordinary (W-2) income if you actively participate and your MAGI is under $100k (phasing out to $0 by $150k); unused losses carry forward. On sale, claimed depreciation is recaptured at up to 25%, and gains may owe capital-gains tax (a 1031 exchange can defer both). Figures are a year-1 estimate at your 24.0% rate — not tax advice; consult a CPA.
Schools (NCES district)
- District
- Coffee County
- NCES district ID
- 4700780
- Math proficiency
- 22% ▼ -13.00%
- Reading proficiency
- 27% ▼ -9.00%
- Median HH income
- $44,951
- Composite
- 21.15/100
- National rank
- #8428
- State rank
- #87 of 139 in TN
Livability — Lakewood Park
- Score
- 52/100
- State rank
- #395
- US rank
- #24746
Category grades
Schools grade is shown separately in the Schools card above.
Census & demographics
- Population (ZIP)
- 2,459
Population outlook (Coffee County) Hauer SSP2
- Today (2025)
- 57,234 people
- By 2030
- 58,571 · +2.3%
- By 2040
- 60,972 · +6.5%
- By 2050
- 62,537 · +9.3%
- By 2075
- 65,694 · +14.8%
- By 2100
- 63,355 · +10.7%
Race, ethnicity, and origin ACS 2023
- Neighborhood character
- Predominantly White (89%)
- Race & ethnicity
- White 89% Two or more races 6% Asian 3% Hispanic / Latino 3%
- Common ancestry
- Italian 3% Romanian 1% Slovak 1%
- Foreign-born
- 3%
- Languages at home
- 96% English-only · Other Indo-European 3% Spanish 1%
Political lean MEDSL · Coffee
- 2024 margin
- Solid R (+55.1) · D 21.8% · R 76.9% · Other 1.3%
- 2008→2024 swing
- -25.7pp toward R · 2008: -29.4pp · 2024: -55.1pp
- All cycles
- 2024: R+55.1 2020: R+50.2 2016: R+48.6 2012: R+37.1 2008: R+29.4
Not yet ingested
- Civics
- —
Market trends
- HPI YoY
- ▲ 103.01%
- Current HPI
- 518.5912
- Rent YoY
- —
- Metro
- —
- State GDP YoY
- ▲ 2.78%
- F500 in state
- 22
Industry mix (Fortune 500 HQ in TN)
| Industry | F500 HQs | Revenue |
|---|---|---|
| Healthcare | 3 | $91B |
|
||
| Retail | 3 | $72B |
|
||
| Transportation / Logistics | 1 | $88B |
|
||
| Paper / Packaging | 1 | $19B |
|
||
| Insurance | 1 | $13B |
|
||
| Energy | 1 | $12B |
|
||
Price history
+275.0% since first listed6 events — show timeline
- 2026-03-11 Listed $285,000 REALTRACS as Distributed by MLS Grid
- 2018-08-10 Sold (Public Records) $145,000 Public Records
- 2013-03-22 Sold (MLS) $44,150 REALTRACS as Distributed by MLS Grid
- 2013-02-13 Listing Removed — REALTRACS as Distributed by MLS Grid
- 2013-01-30 Listed $44,900 REALTRACS as Distributed by MLS Grid
- 1999-10-06 Sold (Public Records) $76,000 Public Records
Property tax history
+7.5%/yrLatest (2025): $1,070 · +0.0% YoY. Source: county tax records.
Cash-flow waterfall
monthlySold comps — $/sqft
last 12 mo · ≤1 miLoading sold comps…