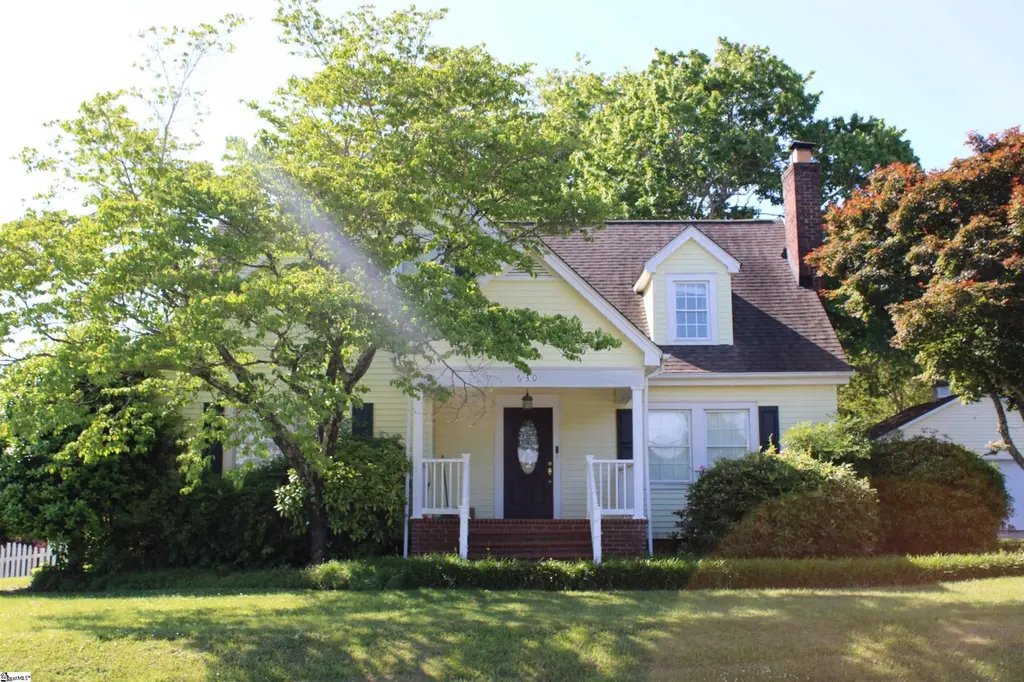
630 College St · Central, SC
Flood risk 1/10 · Minimal
- FEMA flood zone
- X (unshaded)
- Chance of flooding over 30 yrs
- 0.0%
- Est. flood insurance / yr
- $507 – $1,088
Fire risk 4/10 · Minor
- Est. fire insurance / yr
- $783 – $1,453
Heat risk 6/10 · Moderate
- Hot days now (above 105°F)
- 7 days/yr
- Hot days in 30 yrs
- 17 days/yr
Wind risk 2/10 · Minimal
- Chance of severe wind over 30 yrs
- 1.0%
Air-quality risk 4/10 · Minor
- Unhealthy air days now
- 3 days/yr
- Unhealthy air days in 30 yrs
- 5 days/yr
Risk factors via First Street. Map © Google.
Why this score? — see what drove the D+ grade
The composite is a weighted blend of 9 inputs, each scored 0–100. Each bar is that input's sub-score; the figure is the points it added to the 100-point composite (weight × sub-score).
- Cash flow +15.3/30.0
- ARV discount +10.7/15.0
- DSCR +4.7/10.0
- Schools +3.9/10.0
- 1% rule +3.4/10.0
- Livability +3.2/5.0
- Rent growth +2.5/5.0
- Condition / age +2.5/5.0
- Appreciation +0.0/10.0
$349,000
🖨 Deal sheet (PDF) 📄 Offer letter ✓ Due diligence
Listing remarks
5 bedrooms and 2.5 bathrooms. Inside, you will find a bright, flexible layout with hardwood floors on the main level and large rooms perfect for living and entertaining. Step outside to enjoy a screened-in porch and additional open porch areas, ideal for relaxing in this quiet, established neighborhood. Set on a generous lot with a 1.88-acre footprint, the property features a detached garage. This home is ideal for a large family, university employee, or an investor looking for a unique property in the rapidly growing Pickens County/Clemson area.
Key facts
- 1.9 acre lot
- 2 parking spots
- Pool
Neighborhood map
What this means for you Summary
Snapshot
- This is a 4-bed/3.0-bath single-family listed at $349k.
Deal economics
- At list price, monthly cash flow is $125 ($2k/yr) — positive.
- The deal already cash-flows at list — no discount required.
- To meet the 1% rule (rent ≥ 1% of price), the offer needs to be $294k (15.6% below list).
- Recommended offer: $294k (15.6% below list) — sets the bar for 1% rule.
- Cap rate 6.7% vs local median 3.2% in Central — top-decile yield for the area; either an underpriced asset or a hidden risk that comps aren't pricing in. Stress-test before assuming the spread holds.
Location & tenants
- Location reads 63/100 on livability (#176 in SC) — a middle-class / working-renter tenant base. Strengths: crime A+, cost of living A+, housing B+; Watch: amenities F, commute F, employment F.
- Pickens 01 (rural): math 42% / reading 50% proficiency, ranked #21 of 80 in SC (top 26%) — families likely to look elsewhere, expect single-tenant / working-renter base with shorter leases.
- Zoned schools: Central Academy of The Arts (math 37% / reading 42%, grade F, #295 of 597 statewide, top 50%, 443 students, 100% FRL); R. C. Edwards Middle (math 56% / reading 53%, grade B-, #24 of 229 statewide, top 11%, 840 students, 54% FRL); D. W. Daniel High (math 42% / reading 90%, grade B, #81 of 196 statewide, top 42%, 1,201 students, 47% FRL) — zoned schools average 67% FRL vs 42% district-wide (25 pts higher); higher-poverty schools than district average — tighter screening recommended.
- Market conditions: 155 active listings in the ZIP; 2 comparable units currently listed for rent nearby; 1,440 units permitted in Pickens County in 2024 (245 in 5+ unit buildings).
- At $2,944/mo this rent would consume 64% of the median local household income ($55k/yr) (locally 803% of renters already pay >50% of income on rent) — very limited rent-growth headroom before tenants either downsize or default.
Forward outlook
- Local home prices are declining (-3.0%/yr); year-one equity from $2k of loan paydown is wiped out by about $10k of value loss. Plan a longer hold.
- Pickens County population projected at +6% by 2050 — modest demand growth; plan on rents tracking national, not racing it.
Negotiation context
- Only 0 days on market — expect competitive offers; lowballing is unlikely to land.
- 3 sale attempts since 3y ago with the ask held roughly flat each time — persistent listings suggest the price (not the market) is what's stuck; bring a comps-based counter.
Risks & watch-outs
- Watch-outs: built in 1930 — expect roof / HVAC / electrical / plumbing capex.
- Climate carrying-cost: extreme-heat days projected 7→17/yr by 2055 (HVAC capex compounding) — expect insurance premiums to compound above CPI over the hold.
Questions for the listing agent
- Built in 1930 — when were the roof, HVAC, electrical panel, plumbing, and water heater last replaced?
- Is there a deadline driving the sale (1031 exchange, divorce, estate, relocation)? That informs how much negotiation room exists.
- The area grade is low — what's the realistic commute time and amenity access for the typical tenant pool here? Any planned neighborhood developments (good or bad) we should know about?
- What's the average days-on-market for RENTAL listings here right now (not sales)? A rising rental-DOM trend means longer vacancies and softer asking-rent achievability than the comps imply.
- What's the recent tenant-quality profile in this submarket — average credit score on applications, eviction rate, late-payment / NSF rate, and stable-employment percentage? A property-management company in the area should have these aggregated.
- How much new for-sale + rental construction is in the pipeline within 1–3 miles? Heavy new supply typically softens prices + rents 12–24 months out; constrained supply supports both.
Investment metrics
- 1% rule
- 0.84% ✗
- Cap rate
- 6.72%
- Cash-on-cash
- 1.54%
- DSCR
- 1.07
- GRM
- 9.9
CMA / ARV
- ARV (on-the-fly)
- $375,300
- Comps found
- 12
Show comp detail 12 sales within ~0.75 mi
| Address | Dist | Beds/Ba | Sqft | Sold | Price | $/sf | Match |
|---|---|---|---|---|---|---|---|
| 215 Nicholson Dr | 0.09mi | 4/2.5 | 2,033 (-2%) | 6mo | $325,000 | $160 | 84 |
| 19 Sweetgrass St Lot 22 | 0.23mi | 4/3.0 | 2,295 (+10%) | 6mo | $300,000 | $131 | 68 |
| 11 Sweetgrass St Lot 18 | 0.23mi | 4/3.0 | 2,295 (+10%) | 7mo | $304,900 | $133 | 67 |
| 23 Gateway Dr Lot 50 | 0.23mi | 4/2.0 | 1,933 (-7%) | 8mo | $345,000 | $178 | 67 |
| 5 Thunder Trl | 0.66mi | 4/2.0 | 1,956 (-6%) | 1mo | $367,600 | $188 | 54 |
| 45 Halsey St | 0.70mi | 4/2.5 | 1,976 (-5%) | 3mo | $348,630 | $176 | 54 |
| 108 Walnut Trace Ct | 0.67mi | 4/3.0 | 2,270 (+9%) | 1mo | $533,534 | $235 | 53 |
| 5 Thunder Trl Lot 60 | 0.66mi | 4/2.0 | 1,933 (-7%) | 1mo | $367,600 | $190 | 53 |
| 37 Halsey St | 0.73mi | 4/2.5 | 1,946 (-7%) | 2mo | $352,900 | $181 | 51 |
| 13 Thunder Trl | 0.63mi | 4/2.5 | 1,861 (-11%) | 1mo | $334,698 | $180 | 50 |
| 403 Wesleyan Dr | 0.40mi | 3/2.0 (-1) | 1,800 (-14%) | 7mo | $380,000 | $211 | 44 |
| 19 Gateway Dr | 0.74mi | 4/2.5 | 1,861 (-11%) | 4mo | $313,000 | $168 | 42 |
Match score weights: distance 35% · size 25% · config 20% · recency 20%. Top-matched comps best support the ARV.
Projected returns pro-forma
-3.0% appreciation · 3.0% rent growth · sell at horizon
- IRR
- -13.9%
- Equity multiple
- 0.50×
- Total profit
- $-48,657
- Equity at exit
- $52,037
- IRR
- -5.1%
- Equity multiple
- 0.67×
- Total profit
- $-32,440
- Equity at exit
- $30,175
Cash invested: $97,720 (down + closing). Projections, not guarantees.
Landlord ↔ Tenant lean methodology
- Overall (STATE)
- 90 Strongly Landlord-Friendly
- State South Carolina
- 90 Strongly Landlord-Friendly · R+6
- County
- — inherits STATE
- City
- — inherits STATE
ZIP-level market 29630
- Home prices YoY
- -15.3%
- Active inventory
- 155
- Price-to-rent
- 9.9×
Monthly cashflow live
- Estimated rent
- $2,944 medium interval (Pro) →
- Mortgage (P&I)
- −$1,830
- Tax from tax record
- −$225 /mo · $2,699/yr
- Insurance
- −$145
- HOA
- −$0
- Vacancy / Maint / Mgmt
- −$618
- Net cashflow
- $125
Break-even live
Sensitivity live
| Price | -10% $323 | -5% $224 | +0% $125 | +5% $27 | +10% $-72 |
|---|---|---|---|---|---|
| Rent | -10% $-107 | -5% $9 | +0% $125 | +5% $242 | +10% $358 |
| Rate | -1.0pp $301 | -0.5pp $214 | base $125 | +0.5pp $35 | +1.0pp $-57 |
UW: 25.0% down · 7.5% · 30yr · 1.5% tax · 5.0% vac · 8.0% maint · 8.0% mgmt
Financing live
Cash to close
- Down payment
- $87,250
- Closing costs
- $10,470
- Reserves months
- —
- Total cash needed
- —
Loan-product check · same deal, 3 products live
Conventional
25% down · 7.5% · 30yr
- Down + closing
- —
- Monthly P&I
- —
- Monthly cashflow
- —
- DSCR
- —
- Eligible?
- —
Personal DTI + credit; lowest rate.
DSCR
20% down · 8.5% · 30yr
- Down + closing
- —
- Monthly P&I
- —
- Monthly cashflow
- —
- DSCR
- —
- Eligible?
- —
No personal income docs; deal must DSCR.
Hard money
10% down · 12.0% · 12mo
- Down + closing
- —
- Monthly P&I
- —
- Monthly cashflow
- —
- DSCR
- —
- Eligible?
- —
Short-term bridge; refi at stabilization.
Rent comps 2 comps
| Address | Beds | Baths | Sqft | Rent | $/sqft | DOM | Units | Dist |
|---|---|---|---|---|---|---|---|---|
| 5 Thunder Trl Central, SC | 4.0 | 2.0 | 1933 | $2,100 | $1.09 | 12d | 1 | 0.67mi |
| 19 Sweetgrass St Central, SC | 5.0 | 3.0 | 2295 | $6,000 | $2.61 | 21d | 1 | 0.82mi |
Listing history 7 events
-
2026-05-11$349,000
-
2026-05-11historical
-
2026-05-11$349,000
-
2026-05-11historical
-
2024-02-04historical $1,725
-
2024-01-12price $1,725
-
2023-12-20$1,750
ⓘ Source: listings_history table (triggers on properties + properties_extension) + one-shot
backfill from property_details.listing_events for pre-trigger history.
Tax reassessment forecast SC · Resets to sale price
- Current annual tax
- $2,699 · $225/mo
- Projected year-2 tax
- $2,699 · $225/mo
- Expected delta
- $0/yr ($0/mo · 0.0%)
ⓘ Screening estimate from a state-policy table — verify with the county assessor before closing.
Climate risk First Street
- Flood 1/10 Low FEMA zone X (unshaded) · 0% chance over 30 yrs
- Wildfire 4/10 Moderate
- Heat 6/10 Major 7 d/yr ≥105°F today · 17 d/yr by 30 yrs out
- Wind 2/10 Low 100% chance of damaging wind over 30 yrs
- Air quality 4/10 Moderate 3 unhealthy d/yr today · 5 by 30 yrs out
Nearby sold comps map
Loading sold comps map…
Walkable amenities ~0.75 mi
Loading nearby amenities…
Taxation est. · year 1
- Rental income
- $35,329
- − Mortgage interest
- −$19,549
- − Property taxes
- −$2,699
- − Insurance
- −$1,745
- − Repairs & maintenance
- −$2,826
- − Management
- −$2,826
- − Depreciation
- −$10,153
- Taxable loss
- −$4,470
- Est. tax savings @ 24.0%
- +$1,073
- After-tax cash flow
- $2,576/yr
For passive investors: Depreciation is non-cash, so a rental often shows a tax loss while cash-flowing — sheltering income. Rental losses are passive: they offset passive income freely, and up to $25,000/yr can offset ordinary (W-2) income if you actively participate and your MAGI is under $100k (phasing out to $0 by $150k); unused losses carry forward. On sale, claimed depreciation is recaptured at up to 25%, and gains may owe capital-gains tax (a 1031 exchange can defer both). Figures are a year-1 estimate at your 24.0% rate — not tax advice; consult a CPA.
Schools (NCES district)
- District
- Pickens 01
- NCES district ID
- 4503330
- Math proficiency
- 42% ▼ -11.00%
- Reading proficiency
- 50% ▼ -2.00%
- Median HH income
- $42,534
- Composite
- 38.73/100
- National rank
- #4130
- State rank
- #21 of 80 in SC
Livability — Central
- Score
- 63/100
- State rank
- #176
- US rank
- #15558
Category grades
Schools grade is shown separately in the Schools card above.
Census & demographics
- County
- Pickens County · 102,825 people
- City population
- 15,982
- Metro
- Greenville-Anderson, SC
- Population (ZIP)
- 15,982
- Household income
- $55,264
- Rent vs Own
- Severe rent burden
- 803.0
Population outlook (Pickens County) Hauer SSP2
- Today (2025)
- 126,530 people
- By 2030
- 128,780 · +1.8%
- By 2040
- 132,151 · +4.4%
- By 2050
- 133,800 · +5.7%
- By 2075
- 137,594 · +8.7%
- By 2100
- 139,784 · +10.5%
Race, ethnicity, and origin ACS 2023
- Neighborhood character
- Predominantly White (77%)
- Race & ethnicity
- White 77% Two or more races 8% Hispanic / Latino 6% Black 6% Asian 5%
- Hispanic origin (detail)
- Mexican 2% Cuban 2%
- Common ancestry
- Lithuanian 4% Slovak 3% Serbian 2%
- Foreign-born
- 6% · Canada, China, Dominican Republic
- Languages at home
- 91% English-only · Spanish 4% Chinese 2% Other Indo-European 2%
Political lean MEDSL · Pickens
- 2024 margin
- Solid R (+52.7) · D 23.0% · R 75.6% · Other 1.4%
- 2008→2024 swing
- -6.4pp toward R · 2008: -46.2pp · 2024: -52.7pp
- All cycles
- 2024: R+52.7 2020: R+50.9 2016: R+52.7 2012: R+49.0 2008: R+46.2
Not yet ingested
- Civics
- —
Market trends
- HPI YoY
- ▼ -53.24%
- Current HPI
- 293.5998
- Rent YoY
- —
- Metro
- Greenville-Anderson, SC
- State GDP YoY
- ▲ 4.51%
- F500 in state
- 2
Industry mix (Fortune 500 HQ in SC)
| Industry | F500 HQs | Revenue |
|---|---|---|
| Packaging | 1 | $7B |
|
||
Price history
+19842.9% since first listed7 events — show timeline
- 2026-05-11 Listing Removed — Greater Greenville MLS
- 2026-05-11 Listed $349,000 Greater Greenville MLS
- 2026-05-11 Listing Removed — WUMLS
- 2026-05-11 Listed $349,000 WUMLS
- 2024-02-04 Rental Removed $1,725 BUILDIUM
- 2024-01-12 Price Changed $1,725 BUILDIUM
- 2023-12-20 Listed for Rent $1,750 BUILDIUM
Property tax history
+15.8%/yrLatest (2025): $2,699 · +7.5% YoY. Source: county tax records.
Cash-flow waterfall
monthlySold comps — $/sqft
last 12 mo · ≤1 miLoading sold comps…