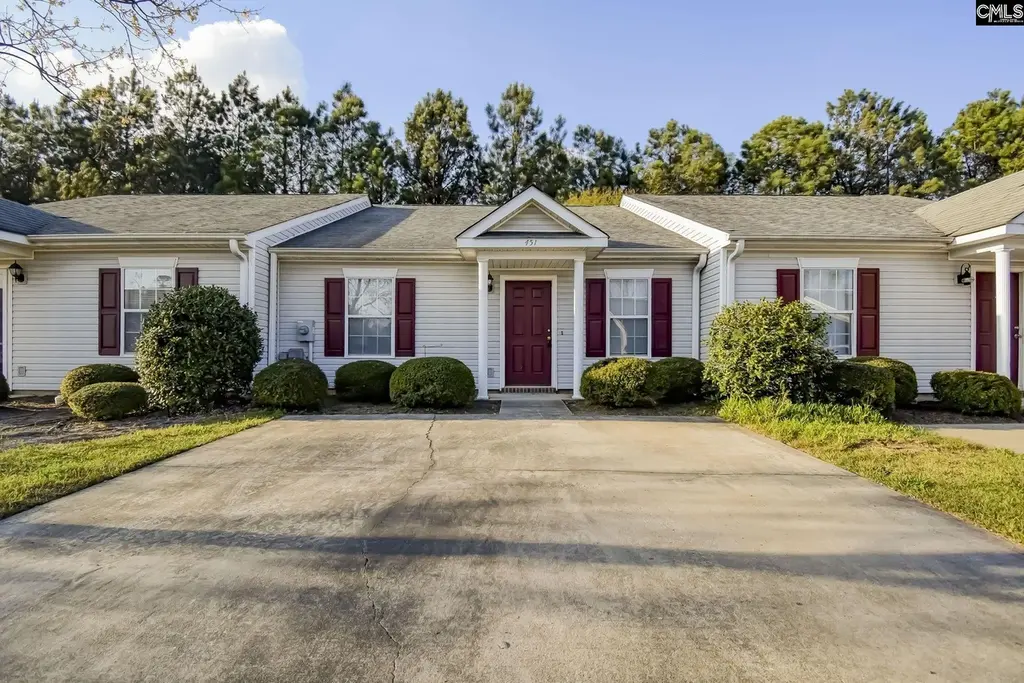
451 Regency Park · Columbia, SC
Flood risk 1/10 · Minimal
- FEMA flood zone
- X (unshaded)
- Chance of flooding over 30 yrs
- 0.0%
- Est. flood insurance / yr
- $507 – $1,088
Fire risk 3/10 · Minor
- Est. fire insurance / yr
- $783 – $1,453
Heat risk 7/10 · Major
- Hot days now (above 108°F)
- 7 days/yr
- Hot days in 30 yrs
- 16 days/yr
Wind risk 6/10 · Moderate
- Chance of severe wind over 30 yrs
- 69.0%
Air-quality risk 3/10 · Minor
- Unhealthy air days now
- 2 days/yr
- Unhealthy air days in 30 yrs
- 3 days/yr
Risk factors via First Street. Map © Google.
Why this score? — see what drove the D- grade
The composite is a weighted blend of 9 inputs, each scored 0–100. Each bar is that input's sub-score; the figure is the points it added to the 100-point composite (weight × sub-score).
- Cash flow +12.8/30.0
- ARV discount +7.5/15.0
- Livability +3.9/5.0
- DSCR +3.8/10.0
- Rent growth +3.8/5.0
- 1% rule +2.9/10.0
- Schools +2.6/10.0
- Condition / age +2.5/5.0
- Appreciation +0.0/10.0
$162,250
🖨 Deal sheet (PDF) 📄 Offer letter ✓ Due diligence
Listing remarks
Move-in ready, all one-level home with modern updates throughout! This home features an open floor plan with vaulted ceilings in the dining and family room, creating a bright and spacious feel. Enjoy no carpet with LVP flooring throughout, fresh paint, and new lighting. The updated kitchen includes a new backsplash, bar seating area, and all new appliances including the refrigerator. Both bathrooms have been updated, and the owner’s suite features an oversized tub for relaxing at the end of the day. Step outside to a fenced-in yard with storage, perfect for everyday living and outdoor enjoyment. A beautifully updated home that’s truly move-in ready! Disclaimer: CMLS has not rev
Key facts
- Bar seating area
- Open floor plan
- Updated kitchen
Tags
Property features AI
Finance
- Other: Paved road access
- Financial info:
- HOA & community: Has association; Association maintains common areas, front yard, and green areas
Exterior
- Parking:
- Security:
- Utilities: Public water; Public sewer
- Home design: Vinyl exterior finish
- Construction: Slab foundation
- Exterior features: Patio; Privacy wood fence in rear
Interior
- Kitchen: Eat-in kitchen with bar; Granite countertops with granite and tile backsplash; Wood cabinets (other); Luxury vinyl plank flooring; Free-standing range; Disposal; Refrigerator
- Bedrooms: Master bedroom on main level with garden tub, private bath, walk-in closet, tub/shower, ceiling fan, private closet, and luxury vinyl plank flooring; Second bedroom on main level with shared bath, tub/shower, and private closet
- Flooring: Luxury vinyl plank flooring throughout main living areas
- Bathrooms: Two full bathrooms
- Heating & cooling: Central heating; Central air conditioning
- Interior features: Ceiling fans; Vaulted and high (over 9 ft) ceilings; Attic access
- Laundry & utility: Laundry on main level in heated space; Dryer
Neighborhood map
What this means for you Summary
Snapshot
- This is a 2-bed/2.0-bath condo listed at $162k.
Deal economics
- At list price, monthly cash flow is $-16 ($-187/yr) — negative.
- To cash-flow at today's rent, offer at most $160k (1.7% below list).
- To meet the 1% rule (rent ≥ 1% of price), the offer needs to be $129k (20.7% below list).
- Recommended offer: $129k (20.7% below list) — sets the bar for 1% rule.
- Cap rate 6.2% vs local median 5.0% in Columbia — meaningfully above typical; check what's discounted (condition, days-on-market, listing class) to confirm the premium yield is real.
Location & tenants
- Location reads 78/100 on livability (#18 in SC, #2,436 nationally) — a middle-class / working-renter tenant base. Strengths: amenities A+, commute A+, cost of living A+; Watch: employment D, crime F.
- Richland 01 (urban): math 26% / reading 36% proficiency, ranked #54 of 80 in SC (top 68%) — families likely to look elsewhere, expect single-tenant / working-renter base with shorter leases; 64% free/reduced lunch — lower-income household profile, screen leases tightly.
- Zoned schools: Pine Grove Elementary (math 24% / reading 15%, grade F, #496 of 597 statewide, top 83%, 541 students, 100% FRL); Columbia High (math 17% / reading 67%, grade F, #174 of 196 statewide, top 90%, 665 students, 100% FRL) — zoned schools average 100% FRL vs 64% district-wide (36 pts higher); higher-poverty schools than district average — tighter screening recommended.
- Market conditions: Rents rising fast (+5.0%/yr); 145 active listings in the ZIP; 34 comparable units currently listed for rent nearby; rentals at typical pace (median 22d on market — plan ~3-4 weeks tenant-placement turnaround); 3,472 units permitted in Richland County in 2024 (1,096 in 5+ unit buildings).
- This rent runs 30% of the median local income ($51k/yr) — at the standard rent-burdened threshold; future hikes will face affordability resistance.
Forward outlook
- Local home prices are declining (-3.0%/yr); year-one equity from $1k of loan paydown is wiped out by about $5k of value loss. Plan a longer hold.
- Richland County population projected at +30% by 2050 — long-run rental-demand tailwind backs the buy-and-hold thesis.
Negotiation context
- It's been on market 49 days — a 3% lower offer ($157k) is reasonable based on typical stale-listing flexibility.
- Current owner paid $105k; list at $162k implies a 55% gain — meaningful room to come down on a strong offer.
Risks & watch-outs
- Climate carrying-cost: major wind risk, 69% chance of damaging wind over 30y; extreme-heat days projected 7→16/yr by 2055 (HVAC capex compounding) — expect insurance premiums to compound above CPI over the hold.
Questions for the listing agent
- What do current leases actually rent for vs. the listed asking? Can we see a recent rent roll and the last 12 months of T-12 income?
- It's been on market 49 days. Have you received any prior offers? Is the seller open to a 21% concession, seller financing, or rate buy-down credit?
- What does the HOA fee cover, when was the last increase, and are there any pending special assessments or reserve-fund shortfalls?
- Any open or pending special assessments — roof, HVAC, plumbing, elevator, façade? What's the per-unit balance and payoff schedule, and is the seller paying it off at close or rolling it to the buyer?
- Is there a deadline driving the sale (1031 exchange, divorce, estate, relocation)? That informs how much negotiation room exists.
- Schools are D-rated, which usually means shorter tenancies and higher turnover. Who's the typical renter profile here, and what's been the actual vacancy rate?
- Crime grade is F in this area — have there been break-ins, vandalism, or insurance claims at this property in the last 3 years? What carrier currently insures it and at what premium?
- The area grade is low — what's the realistic commute time and amenity access for the typical tenant pool here? Any planned neighborhood developments (good or bad) we should know about?
- What's the average days-on-market for RENTAL listings here right now (not sales)? A rising rental-DOM trend means longer vacancies and softer asking-rent achievability than the comps imply.
- What's the recent tenant-quality profile in this submarket — average credit score on applications, eviction rate, late-payment / NSF rate, and stable-employment percentage? A property-management company in the area should have these aggregated.
- How much new apartment / multifamily construction is in the pipeline within 1–3 miles? Heavy new supply (>2% of stock underway) typically softens rents 12–24 months out; light construction supports rent growth.
Investment metrics
- 1% rule
- 0.79% ✗
- Cap rate
- 6.18%
- Cash-on-cash
- -0.41%
- DSCR
- 0.98
- GRM
- 10.5
CMA / ARV
No comps found within radius.
Projected returns pro-forma
-3.0% appreciation · 5.0% rent growth · sell at horizon
- IRR
- -15.0%
- Equity multiple
- 0.46×
- Total profit
- $-24,678
- Equity at exit
- $24,192
- IRR
- -3.6%
- Equity multiple
- 0.74×
- Total profit
- $-11,622
- Equity at exit
- $14,028
Cash invested: $45,430 (down + closing). Projections, not guarantees.
Landlord ↔ Tenant lean methodology
- Overall (STATE)
- 90 Strongly Landlord-Friendly
- State South Carolina
- 90 Strongly Landlord-Friendly · R+6
- County
- — inherits STATE
- City
- — inherits STATE
ZIP-level market 29210
- Home prices YoY
- -32.2%
- Rents YoY
- 5.0%
- Active inventory
- 145
- Price-to-rent
- 10.5×
Monthly cashflow live
- Estimated rent
- $1,286 high interval (Pro) →
- Mortgage (P&I)
- −$851
- Tax from tax record
- −$48 /mo · $581/yr
- Insurance
- −$68
- HOA
- −$65
- Vacancy / Maint / Mgmt
- −$270
- Net cashflow
- $-16
Break-even live
Sensitivity live
| Price | -10% $76 | -5% $30 | +0% $-16 | +5% $-61 | +10% $-107 |
|---|---|---|---|---|---|
| Rent | -10% $-117 | -5% $-66 | +0% $-16 | +5% $35 | +10% $86 |
| Rate | -1.0pp $66 | -0.5pp $26 | base $-16 | +0.5pp $-58 | +1.0pp $-100 |
UW: 25.0% down · 7.5% · 30yr · 1.5% tax · 5.0% vac · 8.0% maint · 8.0% mgmt
Financing live
Cash to close
- Down payment
- $40,562
- Closing costs
- $4,868
- Reserves months
- —
- Total cash needed
- —
Loan-product check · same deal, 3 products live
Conventional
25% down · 7.5% · 30yr
- Down + closing
- —
- Monthly P&I
- —
- Monthly cashflow
- —
- DSCR
- —
- Eligible?
- —
Personal DTI + credit; lowest rate.
DSCR
20% down · 8.5% · 30yr
- Down + closing
- —
- Monthly P&I
- —
- Monthly cashflow
- —
- DSCR
- —
- Eligible?
- —
No personal income docs; deal must DSCR.
Hard money
10% down · 12.0% · 12mo
- Down + closing
- —
- Monthly P&I
- —
- Monthly cashflow
- —
- DSCR
- —
- Eligible?
- —
Short-term bridge; refi at stabilization.
Rent comps 34 comps
| Address | Beds | Baths | Sqft | Rent | $/sqft | DOM | Units | Dist |
|---|---|---|---|---|---|---|---|---|
| 1473 Haviland Cir Columbia, SC | 3.0 | 2.0 | 1425 | $1,499 | $1.05 | 11d | 1 | 0.19mi |
| 169 Brook Pines Dr Columbia, SC | 1.0–2.0 | 1.0 | 700 | $1,185 | $1.69 | 11d | 26 | 0.28mi |
| 4248 Donavan Dr Columbia, SC | 3.0 | 2.0 | 1231 | $1,586 | $1.29 | 19d | 1 | 0.49mi |
| 1335 Cactus Ave Columbia, SC | 3.0 | 2.0 | 1155 | $1,450 | $1.26 | 15d | 1 | 0.66mi |
| 800 Beatty Rd Columbia, SC | 1.0–3.0 | 1.0–1.5 | 930 | $1,074 | $1.15 | 24d | 1 | 0.69mi |
| 265 Timber Ct Columbia, SC | 3.0 | 1.5 | 1000 | $1,495 | $1.50 | 22d | 1 | 0.74mi |
| 1211 Metze Rd Unit G3 Columbia, SC | 2.0 | 2.0 | 826 | $1,100 | $1.33 | 22d | 1 | 0.76mi |
| 135 Hunters Grove Dr Columbia, SC | 3.0 | 2.5 | 1428 | $1,595 | $1.12 | 22d | 1 | 0.77mi |
| 405 Hickory Hill Dr Unit 405 Columbia, SC | 3.0 | 1.5 | 1400 | $1,400 | $1.00 | 24d | 1 | 0.79mi |
| 1008 Creekside Way Unit 1 Columbia, SC | 2.0 | 2.0 | 1150 | $1,295 | $1.13 | 11d | 1 | 0.83mi |
| 1002 Creekside Way Columbia, SC | 2.0 | 2.0 | 1200 | $1,350 | $1.12 | 15d | 1 | 0.84mi |
| 6007 Village Creek Dr Unit 6007 Columbia, SC | 2.0 | 2.0 | 1300 | $1,195 | $0.92 | 24d | 1 | 0.85mi |
| 217 Wynn Way Unit B Columbia, SC | 2.0 | 1.5 | 1160 | $1,095 | $0.94 | 19d | 1 | 0.90mi |
| 2025 Apple Valley Rd Unit B Columbia, SC | 2.0 | 1.0 | 842 | $925 | $1.10 | 24d | 1 | 0.94mi |
| 1212 Metze Rd Columbia, SC | 1.0–3.0 | 1.0–2.0 | 1026 | $1,125 | $1.10 | 24d | 13 | 0.95mi |
| 3609 Juneau Rd Unit A4 Columbia, SC | 2.0 | 2.0 | 1000 | $1,195 | $1.20 | 19d | 1 | 1.04mi |
| 2218 Apple Valley Rd Apt B Columbia, SC | 2.0 | 1.0 | 900 | $995 | $1.11 | 24d | 1 | 1.05mi |
| 2218 Apple Valley Rd Columbia, SC | 3.0 | 1.0 | 972 | $1,295 | $1.33 | 24d | 1 | 1.05mi |
| 3609 Juneau Rd Unit B28 Columbia, SC | 2.0 | 2.0 | 1000 | $995 | $0.99 | 24d | 1 | 1.07mi |
| 3300 Kay St Columbia, SC | 2.0 | 2.5 | 1200 | $1,350 | $1.12 | 15d | 19 | 1.08mi |
| 1510 Saint Andrews Rd Columbia, SC | 3.0 | 2.0 | 1196 | $1,215 | $1.02 | 15d | 36 | 1.08mi |
| 846 Piney Grove Rd Columbia, SC | 3.0 | 2.5 | 1400 | $1,495 | $1.07 | 24d | 1 | 1.08mi |
| 3609 Juneau Rd Unit 3609 F-73 Columbia, SC | 2.0 | 2.0 | 1000 | $1,195 | $1.20 | 24d | 1 | 1.11mi |
| 3609 Juneau Rd Unit F 74 Columbia, SC | 2.0 | 2.0 | 1000 | $1,145 | $1.15 | 3d | 1 | 1.11mi |
| 3609 Juneau Rd Unit F73 Columbia, SC | 2.0 | 2.0 | 1000 | $1,255 | $1.25 | 22d | 1 | 1.11mi |
| 3500 Fernandina Rd Columbia, SC | 1.0–2.0 | 1.0–1.5 | 1011 | $1,350 | $1.34 | 24d | 5 | 1.13mi |
| 3406 Fernandina Rd Columbia, SC | 2.0 | 2.0 | 1008 | $1,245 | $1.24 | 24d | 1 | 1.15mi |
| 1200 Saint Andrews Rd Columbia, SC | 1.0–2.0 | 1.0–2.0 | 867 | $1,360 | $1.57 | 11d | 32 | 1.18mi |
| 240 Jamil Rd Columbia, SC | 2.0 | 1.5 | 1013 | $1,172 | $1.16 | 4d | 2 | 1.20mi |
| 240 Jamil Rd #3 Columbia, SC | 2.0 | 1.5 | 1027 | $1,250 | $1.22 | 24d | 1 | 1.20mi |
| 961 Zimalcrest Dr Columbia, SC | 1.0–3.0 | 1.0–2.0 | 915 | $1,062 | $1.16 | 11d | 9 | 1.23mi |
| 601 St Andrews Rd Columbia, SC | 1.0–3.0 | 1.0–2.0 | 1085 | $1,238 | $1.14 | 4d | 19 | 1.36mi |
| 1725 Kathleen Dr Unit B Columbia, SC | 2.0 | 2.0 | 1100 | $1,275 | $1.16 | 24d | 1 | 1.38mi |
| 51 Heritage Village Ln Unit 1 Columbia, SC | 2.0 | 2.0 | 1150 | $1,400 | $1.22 | 24d | 1 | 1.42mi |
HOA detail condo
- Monthly dues
- $65 · $780/yr
- Assessments
- None detected in remarks — confirm with the listing agent.
Listing history 6 events
-
2026-05-19status Pending
-
2026-05-13price $162,250
-
2026-04-23price $167,500
-
2026-03-31$170,000 Active
-
2026-02-27soldstatus $105,000
-
2026-01-29soldstatus $67,000
ⓘ Source: listings_history table (triggers on properties + properties_extension) + one-shot
backfill from property_details.listing_events for pre-trigger history.
Tax reassessment forecast SC · Resets to sale price
- Current annual tax
- $581 · $48/mo
- Projected year-2 tax
- $925 · $77/mo
- Expected delta
- +$344/yr (+$29/mo · 59.2%)
ⓘ Screening estimate from a state-policy table — verify with the county assessor before closing.
Climate risk First Street
- Flood 1/10 Low FEMA zone X (unshaded) · 0% chance over 30 yrs
- Wildfire 3/10 Moderate
- Heat 7/10 Severe 7 d/yr ≥108°F today · 16 d/yr by 30 yrs out
- Wind 6/10 Major 69% chance of damaging wind over 30 yrs
- Air quality 3/10 Moderate 2 unhealthy d/yr today · 3 by 30 yrs out
Nearby sold comps map
Loading sold comps map…
Walkable amenities ~0.75 mi
Loading nearby amenities…
Taxation est. · year 1
- Rental income
- $15,438
- − Mortgage interest
- −$9,089
- − Property taxes
- −$581
- − Insurance
- −$811
- − Repairs & maintenance
- −$1,235
- − Management
- −$1,235
- − HOA
- −$780
- − Depreciation
- −$4,720
- Taxable loss
- −$3,013
- Est. tax savings @ 24.0%
- +$723
- After-tax cash flow
- $536/yr
For passive investors: Depreciation is non-cash, so a rental often shows a tax loss while cash-flowing — sheltering income. Rental losses are passive: they offset passive income freely, and up to $25,000/yr can offset ordinary (W-2) income if you actively participate and your MAGI is under $100k (phasing out to $0 by $150k); unused losses carry forward. On sale, claimed depreciation is recaptured at up to 25%, and gains may owe capital-gains tax (a 1031 exchange can defer both). Figures are a year-1 estimate at your 24.0% rate — not tax advice; consult a CPA.
Schools (NCES district)
- District
- Richland 01
- NCES district ID
- 4503360
- Math proficiency
- 26% ▼ -7.00%
- Reading proficiency
- 36% ▼ -5.00%
- Median HH income
- $38,931
- Composite
- 25.94/100
- National rank
- #7335
- State rank
- #54 of 80 in SC
Livability — Columbia
- Score
- 78/100
- State rank
- #18
- US rank
- #2436
Category grades
Schools grade is shown separately in the Schools card above.
Census & demographics
- Census place
- Columbia, SC
- County
- Richland County · 389,530 people
- City population
- 335,994
- Metro
- Columbia, SC
- Population (ZIP)
- 39,962
- Household income
- $50,871
- Rent vs Own
- Severe rent burden
- 2859.0
Population outlook (Richland County) Hauer SSP2
- Today (2025)
- 459,667 people
- By 2030
- 487,524 · +6.1%
- By 2040
- 542,035 · +17.9%
- By 2050
- 595,371 · +29.5%
- By 2075
- 732,998 · +59.5%
- By 2100
- 820,415 · +78.5%
Race, ethnicity, and origin ACS 2023
- Neighborhood character
- Diverse neighborhood (Simpson 0.58)
- Race & ethnicity
- Black 55% White 34% Two or more races 6% Hispanic / Latino 4% Asian 2%
- Common ancestry
- Arab 2% Lithuanian 2% Slovak 1%
- Foreign-born
- 7% · Canada
- Languages at home
- 91% English-only · Spanish 3%
Political lean MEDSL · Richland
- 2024 margin
- Solid D (+34.6) · D 66.4% · R 31.8% · Other 1.8%
- 2008→2024 swing
- +5.7pp toward D · 2008: 28.9pp · 2024: 34.6pp
- All cycles
- 2024: D+34.6 2020: D+38.3 2016: D+32.9 2012: D+33.3 2008: D+28.9
Not yet ingested
- Civics
- —
Market trends
- HPI YoY
- ▼ -107.61%
- Current HPI
- 226.2564
- Rent YoY
- ▲ 5.00%
- Metro
- Columbia, SC
- State GDP YoY
- ▲ 4.51%
- F500 in state
- 2
Industry mix (Fortune 500 HQ in SC)
| Industry | F500 HQs | Revenue |
|---|---|---|
| Packaging | 1 | $7B |
|
||
Price history
+142.2% since first listed6 events — show timeline
- 2026-05-19 Pending — Consolidated MLS
- 2026-05-13 Price Changed $162,250 Consolidated MLS
- 2026-04-23 Price Changed $167,500 Consolidated MLS
- 2026-03-31 Listed $170,000 Consolidated MLS
- 2026-02-27 Sold (Public Records) $105,000 Public Records
- 2026-01-29 Sold (Public Records) $67,000 Public Records
Property tax history
-0.7%/yrLatest (2025): $581 · +3.8% YoY. Source: county tax records.
Cash-flow waterfall
monthlySold comps — $/sqft
last 12 mo · ≤1 miLoading sold comps…